Measured 7 and 8 October 2026 · Playwright, Lighthouse 13.5, Chromium 154 · View source & raw data →
TL;DR
We built a Trello-style board on which several people drag cards at the same time, rendered entirely on the server: one Go binary, one SQLite file, Datastar in the browser. We measured it against PLANKA Community 2.2.1, a popular self-hosted Kanban app built with React, Redux, Sails.js and PostgreSQL. Both held the same boards, and the measured person used a slowed phone behind a 150 ms round trip.
Our board transfers 58 kB and is on screen after 0.6 seconds; PLANKA transfers 2.6 MB and shows its board after 15.4 seconds. A dropped card is in its new place after 252 ms, already accepted by the server; PLANKA shows the move after 481 ms and has the server's confirmation after 712 ms. Our board never shows a move the server hasn't accepted. PLANKA is faster at one thing we measured: adding a comment.
Why a Kanban board
Our AI chat comparison leaves one objection open: server-rendered HTML may work for forms and chats, but an app with drag and drop, where several people edit the same screen at once, needs a single-page app. A Kanban board is that app. PLANKA is a real product built the single-page way, with about 12,600 stars on GitHub.
The two apps
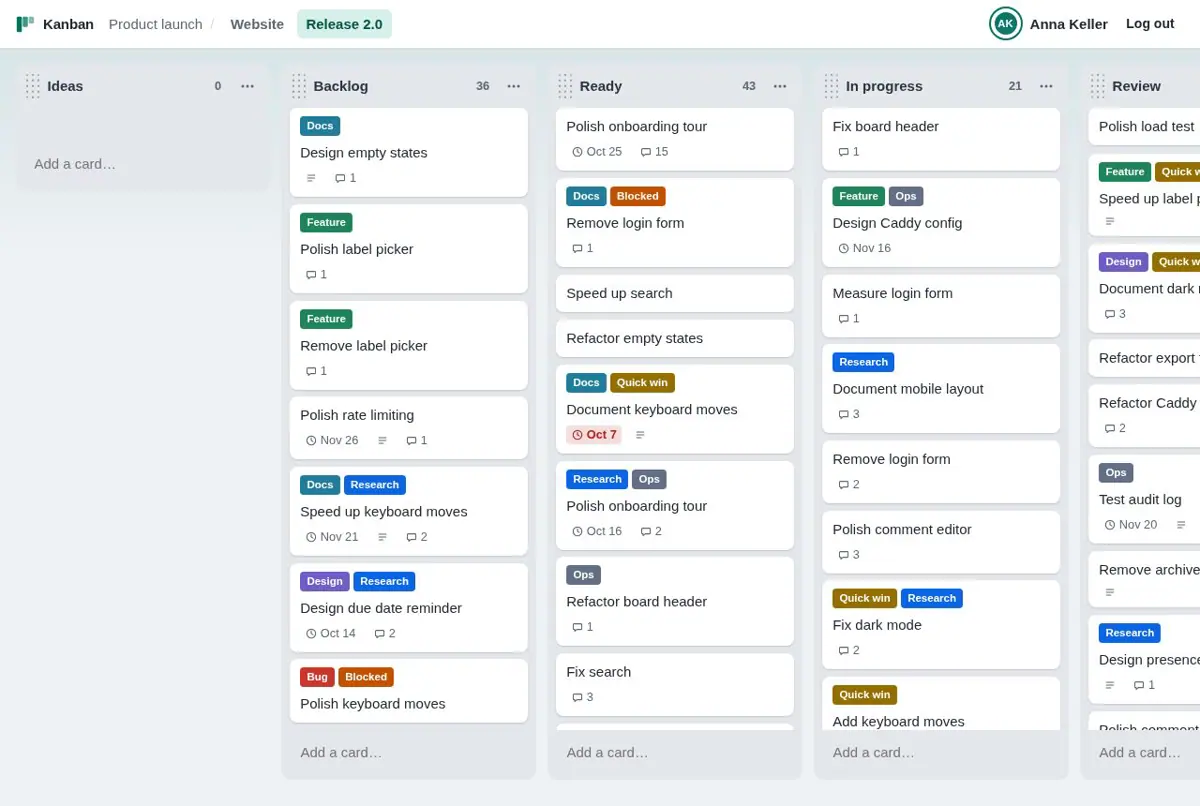
Both apps do what we compared: log in; add, rename, reorder and archive lists; add, rename, move and archive cards, by dragging and with the keyboard; a card view with a Markdown description, labels, a due date and comments; and live collaboration, where everyone on a board sees every change and who else is there.
PLANKA does a lot more: card members, search and filters, other board views, an activity history, editing comments, deleting cards, a stopwatch, attachments, task lists, custom fields, notifications, webhooks, a REST API and two-factor login. We compared only what both apps do, and PLANKA's bundle and memory also pay for the rest.
| Part | Ours | PLANKA Community 2.2.1 |
|---|---|---|
| Server | Go, one binary | Node.js with Sails.js, socket.io |
| Database | SQLite, one file | PostgreSQL 16 |
| Browser | Datastar 1.0.4, Starbase components | React 18, Redux, redux-saga, react-beautiful-dnd |
| Live updates | server-sent events, HTML | WebSocket, JSON events |
How the board stays in sync
- BrowserA card is dropped. The page sends a POST with an operation id.
- WriterOne goroutine owns the only write connection and commits the queued commands in one transaction. The request gets an empty 204.
- RenderThe board is rendered at most every 50 ms, once for everyone looking at it.
- Every open pageEach page's stream gets the new HTML, compressed with Brotli, and Datastar morphs it in.
Every action on our board is a POST request that changes the database and answers with an empty 204. Each open page holds one stream of server-sent events, and after every change the server sends the board down that stream as HTML. Cards that didn't change come from a cache keyed by their content, and a slow connection gets the newest frame instead of a queue of old ones. A frame carries only the lists that changed, and Brotli compresses across frames, so a frame after one moved card costs under a kilobyte on the wire. Brotli's window belongs to one connection, so every stream compresses each frame for itself; everything else about a frame is done once, and at most half the processor cores compress at a time, so a burst of frames never holds up an action.
All writes go through the one goroutine with the write connection. While a transaction commits, new commands queue up, and the next transaction takes all of them, each in its own savepoint, so one refused command undoes only its own changes. The check "did someone move this card since your page was drawn" runs inside that command, with no lock held across the network. The design follows Anders Murphy's measurements of SQLite under contention. SQLite runs with synchronous=FULL, so every commit waits for the disk.
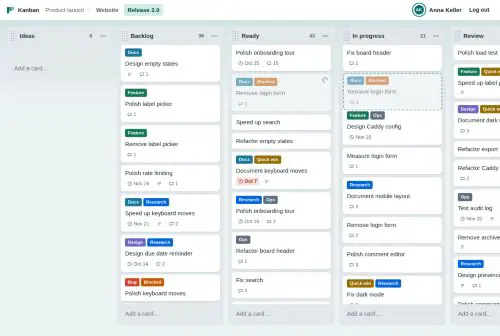
A dropped card stays where the server last put it and looks pending (dimmed, with a spinner) until the frame that shows it in its new place arrives; that frame also clears the pending look. Meanwhile the board opens a gap where the card was dropped and shows a dashed copy of it there: what the person did, not what the server has done. If the server refuses the move, the card stays put and the page says why: "Anna moved ‘Fix login’ to ‘Done’ meanwhile." Every action carries an id, so a request the browser sends twice after a network error is applied once.
How we measured
- Same data. Our seed creates four people and two boards. The measured one, "Release 2.0", has 8 lists, 200 cards and 268 comments. We exported it and loaded it into a freshly installed PLANKA through its API, labels, due dates and comment authors included. After all runs, both databases still held the same lists, cards and comments; 2 of 200 cards sat in a different place, because a drop lands at a slightly different spot when the cards have different heights.
- Same machine. Both apps, the database and the browser ran on one machine (Intel i5-13500). PLANKA ran from its official Docker image, with a Compose file derived from the official one.
- Same slow network. A small TCP proxy in front of each app adds a 150 ms round trip and limits bandwidth to 1.6 Mbit/s down and 750 kbit/s up, for every packet, including those on our stream and PLANKA's WebSocket. Chrome's own network throttling adds its delay when a request starts and left data arriving later on an open stream undelayed in our first runs.
- A slow phone. Chrome slowed the measured person's CPU four times. A second person watched the same board on a normal CPU.
- A cold load is a first visit of a signed-in person: a new browser profile with only the session cookie, no cache and no open connection.
- Mouse drags. Each move dragged a card one list to the right. PLANKA's keyboard dragging didn't move cards in our automated runs, so both apps were measured with the mouse.
- Three runs each, 20 moves per run. Moves, card openings and comments pool the samples of all runs, so each app's p95 rests on 60 moves; load figures are medians of the runs. Lighthouse ran three times per form factor, signed in, with an empty cache, and we kept the median run.
Loading the board
| Cold load of the 200-card board | Ours | PLANKA | Difference |
|---|---|---|---|
| Transferred | 58 kB | 2,576 kB | 44× less |
| JavaScript transferred | 40 kB | 2,226 kB | 56× less |
| Board on screen (largest contentful paint) | 0.6 s | 15.4 s | 27× sooner |
| All scripts in (load event) | 0.6 s | 12.5 s | 20× sooner |
| Layout shift (CLS) | 0 | 0.02 | none |
PLANKA downloads its whole application before it asks for the board, so on a slow connection most of the 15.4 seconds go to 2.2 MB of JavaScript. Our server sends the board as HTML in the first response, and the browser paints it as soon as the stylesheet has arrived. Our JavaScript loads after that, five files in one wave: Datastar and one file for each Starbase component. Dragging works once they are in, after 0.6 seconds on this connection.

Lighthouse
| Metric | Ours, desktop | PLANKA, desktop | Ours, mobile | PLANKA, mobile |
|---|---|---|---|---|
| Performance score | 100 | 69 | 98 | 33 |
| First contentful paint | 0.3 s | 2.4 s | 1.4 s | 14.0 s |
| Largest contentful paint | 0.3 s | 2.6 s | 1.4 s | 14.9 s |
| Total blocking time | 0 ms | 140 ms | 160 ms | 990 ms |
Lighthouse simulates the slow network and the slow phone itself (mobile: 150 ms round trip, 1.6 Mbit/s, 4× CPU) and keeps its own model of how requests overlap, so its mobile numbers differ from our measured ones. With one file per component, it counts 160 ms of total blocking time on mobile for our board; with the same components as 17 separate modules, it counted 80 ms.
Moving a card
Ours
253 ms
PLANKA
712 ms
- The card stays in place and looks pending; a dashed copy marks where it goes
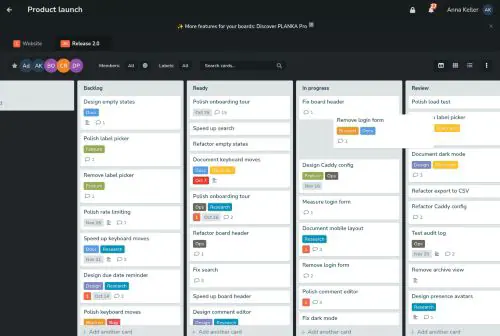
- PLANKA's drop animation
- Shown in the new list, not yet accepted by the server
- In its new place and accepted by the server
| Pointer drag, one list to the right | Ours | PLANKA | Difference |
|---|---|---|---|
| Card shown in its new list | 252 ms | 481 ms | 1.9× sooner |
| Move confirmed by the server | 253 ms | 712 ms | 2.8× sooner |
| Move confirmed, p95 | 276 ms | 756 ms | 2.7× sooner |
| A second person sees the move | 199 ms | 656 ms | 3.3× sooner |
The two apps mean different things by "shown". Both mark the target at once: PLANKA's list opens a gap during the drag and its card floats into it after the drop, and our board opens a gap with a dashed copy of the card. PLANKA moves the card itself in the browser and tells the server afterwards; its card is in the list after 481 ms, at the end of its drop animation, and the server's confirmation arrives at 712 ms. If the server refuses the move, the card has already been shown where it isn't. Our board moves the card only when the server's frame brings it, at 252 ms, and the same frame clears its pending look. PLANKA sends the move only after its drop animation, which is also why the second person sees it later.
| Add a comment (p50) | Ours | PLANKA | Difference |
|---|---|---|---|
| Comment shown | 302 ms | 90 ms | PLANKA 3.4× sooner |
| Comment confirmed by the server | 302 ms | 229 ms | PLANKA 1.3× sooner |
PLANKA is faster here. It shows a new comment immediately, before the server has it, and gets the confirmation over its open WebSocket after 229 ms. Our board sends an HTTP request and shows the comment with the card view's next frame, which the slowed CPU has to morph, after 302 ms.
Responsiveness and memory in the browser
| After the session | Ours | PLANKA | Difference |
|---|---|---|---|
| Interaction to Next Paint (INP) | 64 ms | 256 ms | 4× shorter |
| JavaScript heap | 4.4 MB | 45.0 MB | 10× less |
| DOM elements | 1,843 | 3,295 | 1.8× fewer |
| Opening a card | 258 ms | 318 ms | 1.2× sooner |
Many people on one board
We also loaded our board with simulated people, each with a real compressed stream, moving random cards on the 200-card board on a fixed schedule. The tool measures what a person waits for: from sending a move to its outcome arriving on their own stream. Server and load tool ran on separate cores of the same machine; the figures are medians of three 30-second runs.
| Measure | 50 people, a move each per second | 200 people, four moves each per second |
|---|---|---|
| Moves per second | 48 | 790 |
| Refused as stale | 15 of 1,508 | 4,425 of 23,967 |
| Request answered (204), p95 | 14 ms | 12 ms |
| Outcome on the person's stream, p95 | 77 ms | 99 ms |
| Bytes per frame on the wire | 532 | 999 |
| Server CPU | 1.6 cores | 4.9 cores |
| Server memory | 258 MB | 1.2 GB |
"Refused as stale" means two people moved the same card at the same moment and the second one was told who moved it where.
The database is not what the server spends its time on. Rendering the board takes about 2 ms per frame, once for everyone. At 800 moves a second, every frame changes all eight lists, about 140 kB of HTML, and each of the 200 streams compresses it with its own Brotli window: that is most of the five cores. The compressor's state is also most of the memory, about 2.2 MB per busy stream, which Go's garbage collector roughly doubles. Two hundred people on a quiet board need 150 MB.
The writer alone
Without HTTP or streams, our writer handles about 13,800 moves a second when 200 people move at once, and 240 to 340 when one person moves alone. At first it was about 10,000: the pure Go SQLite driver prepares a statement again on every call, and that cost 41% of the writer's CPU. Now the writer prepares each statement once and keeps it. Anders Murphy measured 98,163 transactions a second with the same design. Two things explain the difference:
- A move on our board runs about fifteen SQL statements: checking the operation id and the membership, two savepoints, reading the card and its list, finding the position, the update, the board version and recording the operation. His transfer runs two updates.
- On his MacBook, SQLite's fsync returns before the drive has written its cache unless
PRAGMA fullfsyncis on, which his settings don't list. On our Linux machine a commit waits 3 to 5 ms for the disk, and that is the limit for one person moving alone.
A board doesn't come near the ceiling: 200 people each moving a card every 250 ms send 800 moves a second.
What runs on the server
Installed size
Ours: one 13.5 MB binary
PLANKA: two images, 673 MB
Memory at rest
Ours: 28 MB
PLANKA: 200 MB
The same boards on disk
Ours: 143 kB
PLANKA: 10.3 MB
Processes
Ours: 1
PLANKA: 18
| At rest, after the runs | Ours | PLANKA |
|---|---|---|
| What runs | one 13.5 MB binary under systemd | two containers: PLANKA (379 MB image) and PostgreSQL 16 (294 MB image) |
| Processes | 1 | 18 |
| Memory | 28 MB | 200 MB |
| The same boards on disk | 143 kB SQLite file | 10.3 MB PostgreSQL database |
| Dependencies | 12 Go modules, compiled in | 83 client and 37 server packages, plus their dependencies |
An empty PostgreSQL database already takes 7.3 MB, and PLANKA's data directory as a whole takes 65 MB, most of it write-ahead log segments and template databases. Our server's memory grows with the open streams, as described above.
Making a 200-card board fast on a phone
Our first build of the board took about 120 ms of main-thread time per frame on the slowed CPU, and every key pressed during a frame waited for it, which put INP at 248 ms. Three changes brought a frame to about 55 ms:
- A frame carries only the lists that changed; the others go as empty placeholders that Datastar's morph skips, since both copies carry
data-ignore-morph. - A frame patches the lists inside the board component, never the component element itself. This one change took a frame from about 100 ms to about 55 ms.
- Lists and cards off screen have
content-visibility: auto, so the browser doesn't lay out or paint the lists a phone doesn't show.
With Datastar 1.0.4's default retry setting, a stream that the server closes cleanly, as it does during a deploy, is not reopened, and the page stops updating without any sign. Our board opens its stream with retry: 'always', a watchdog replaces a connection that went quiet, and a banner says when the page may be out of date.
Limitations
- Both apps ran on one machine with the browser, so neither paid for real distance to a data centre. The proxy added the same delay to both.
- We compared the features both apps have. PLANKA has many more, and some of its weight pays for them.
- We measured PLANKA Community 2.2.1 as it ships. The paid PLANKA Pro 2.5.0 (September 2026) lists optimisations for large boards that we didn't test, and a tuned deployment with a CDN and HTTP caching would load faster.
- Moves were measured with the mouse only.
- The load test ran against our board only, with the load tool on the same machine as the server, on separate cores. The machine also runs other services.
When to choose what
If your team needs a self-hosted Kanban board with attachments, task lists, custom fields and notifications today, PLANKA has them and we haven't built them. This study is about how to build interactive software. A board with drag and drop, live collaboration and conflicts between people fits in server-rendered HTML with honest pending states, and on a slow phone it loads in well under a second and stays responsive. It runs as one binary with one file of data. If you are about to build an interactive application and assume it needs a single-page app, measure the server-driven version first.
Run it yourself
The board runs at kanban.zweiundeins.gmbh. Log in as anna@example.com, ben@example.com, chiara@example.com or dev@example.com with the password demo, best in two browsers at once; the boards go back to their seed every night.
The source, the benchmark scripts, the PLANKA setup and all raw data are on GitHub. go tool task dev starts the board with demo data; benchmarks/RESULTS.md describes how to run every measurement in this article.
PLANKA is a trademark of PLANKA Software GmbH. We measured it independently; this article is not reviewed or endorsed by them.