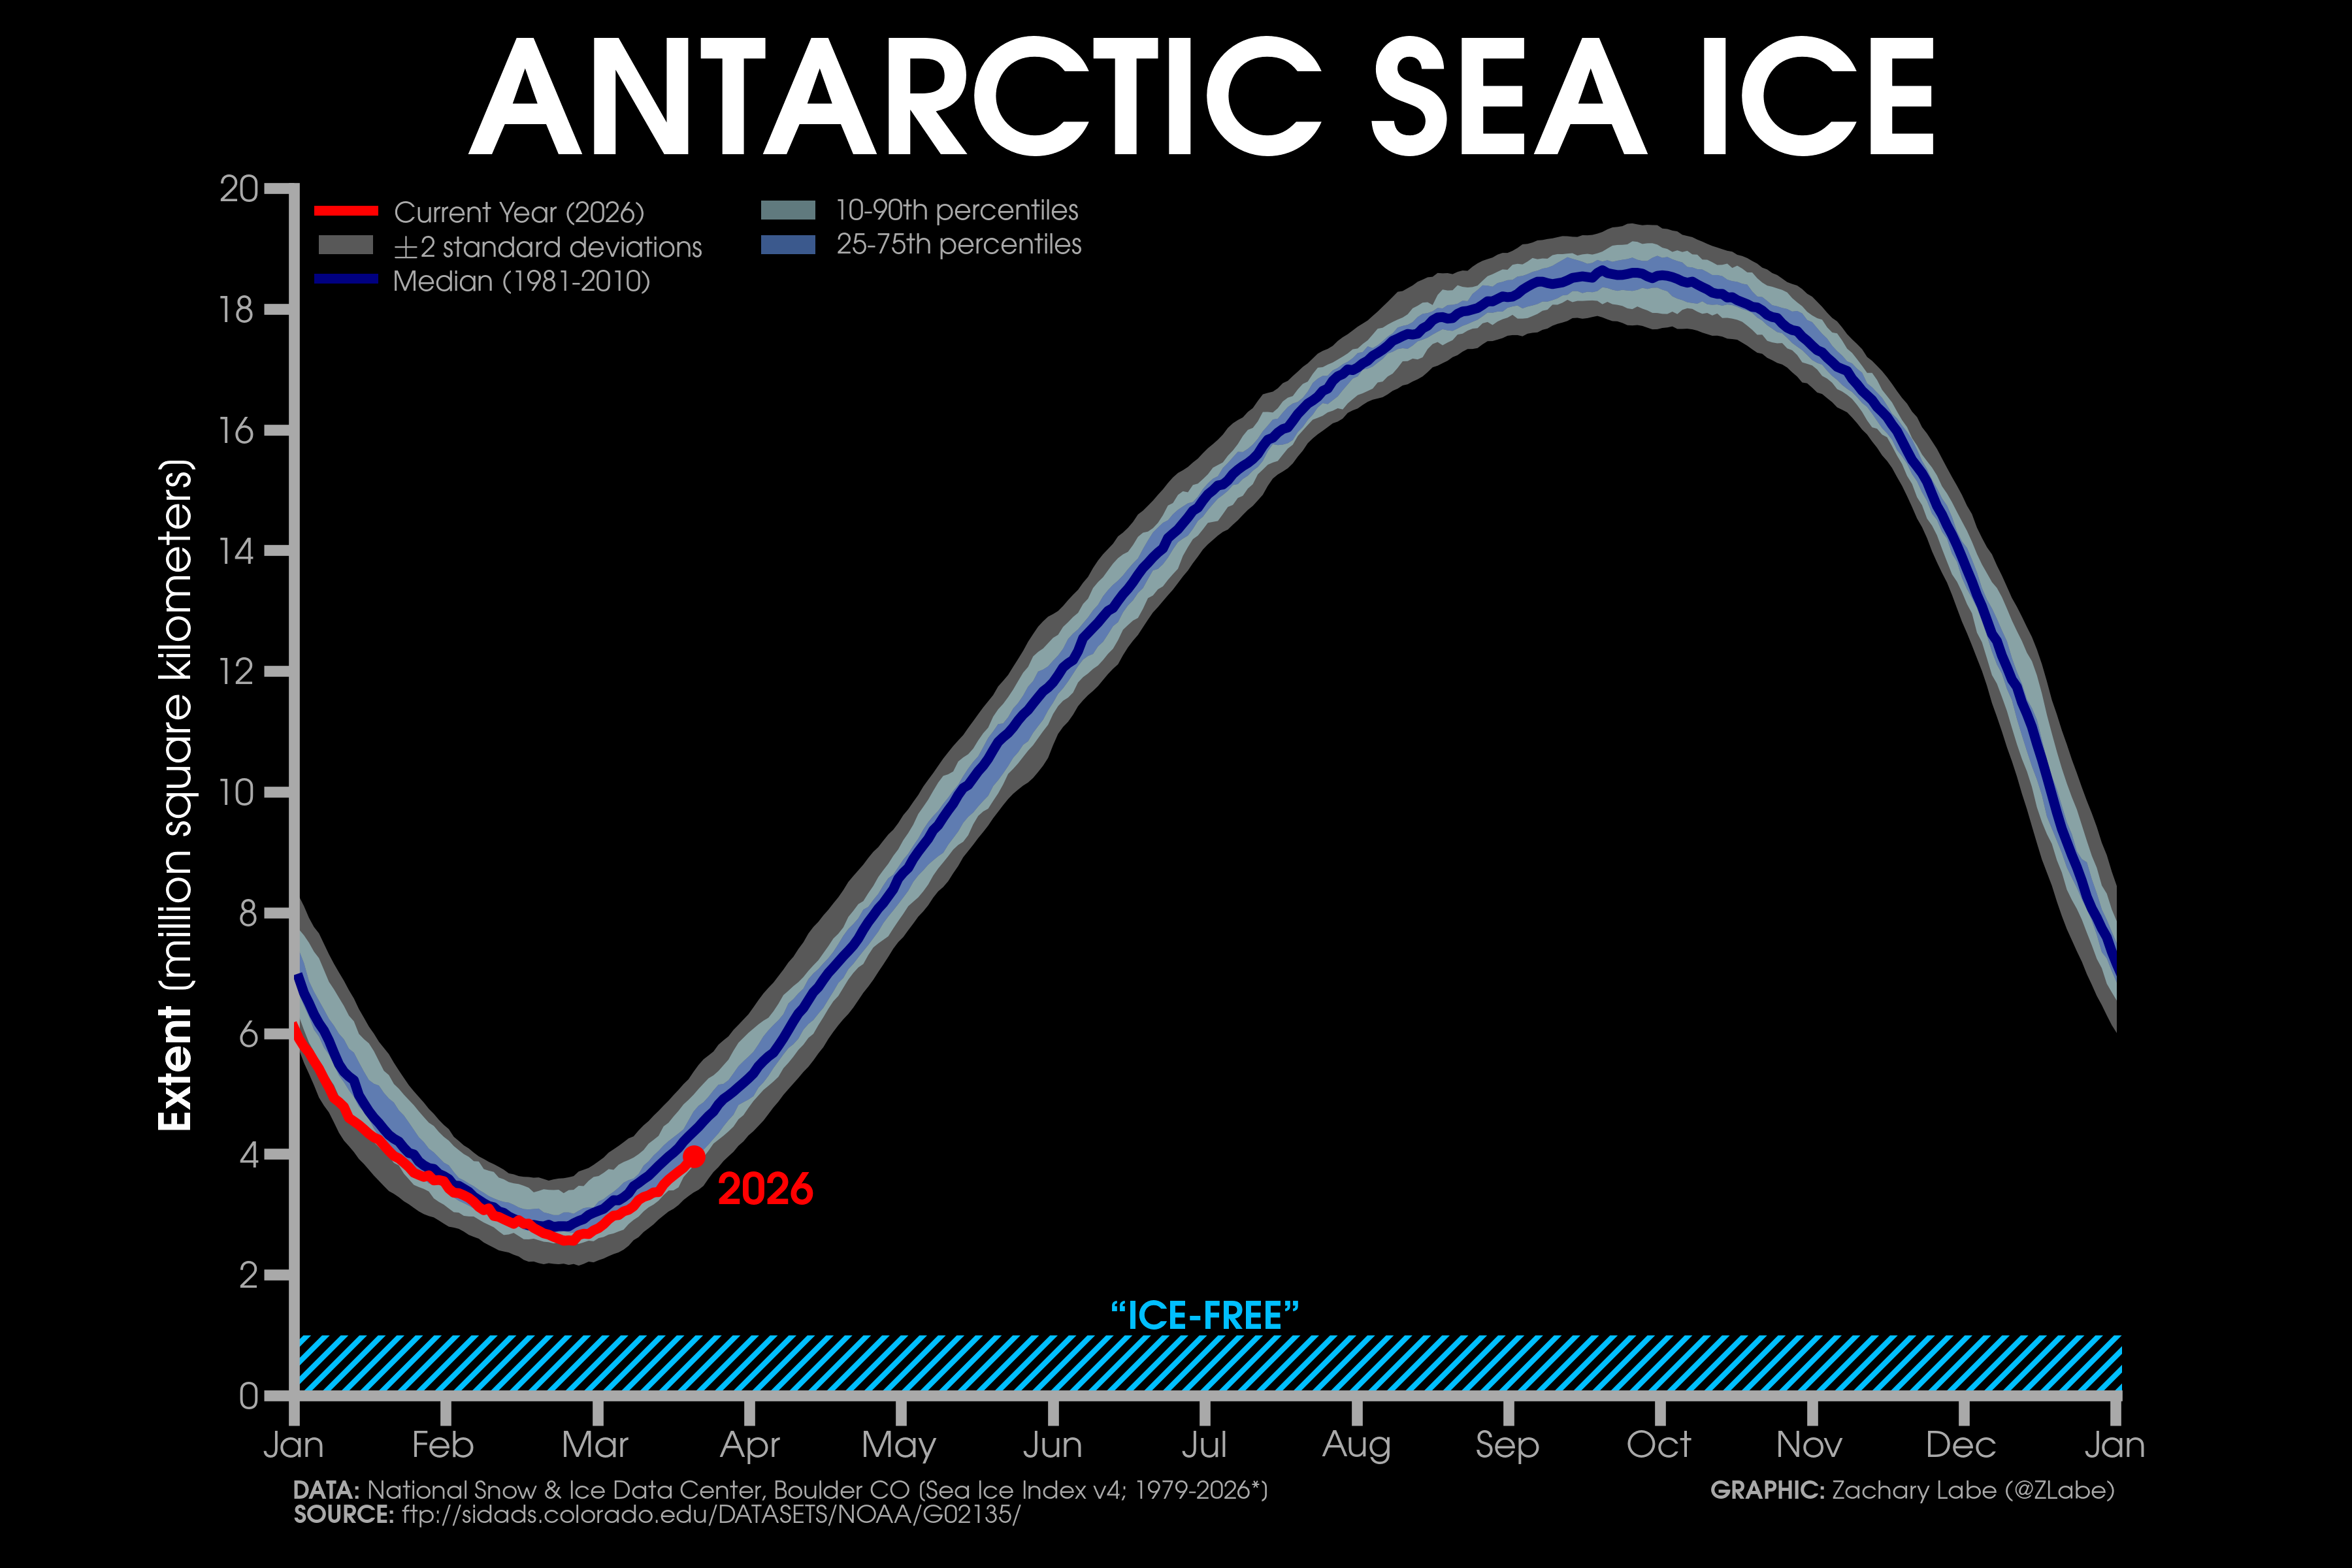
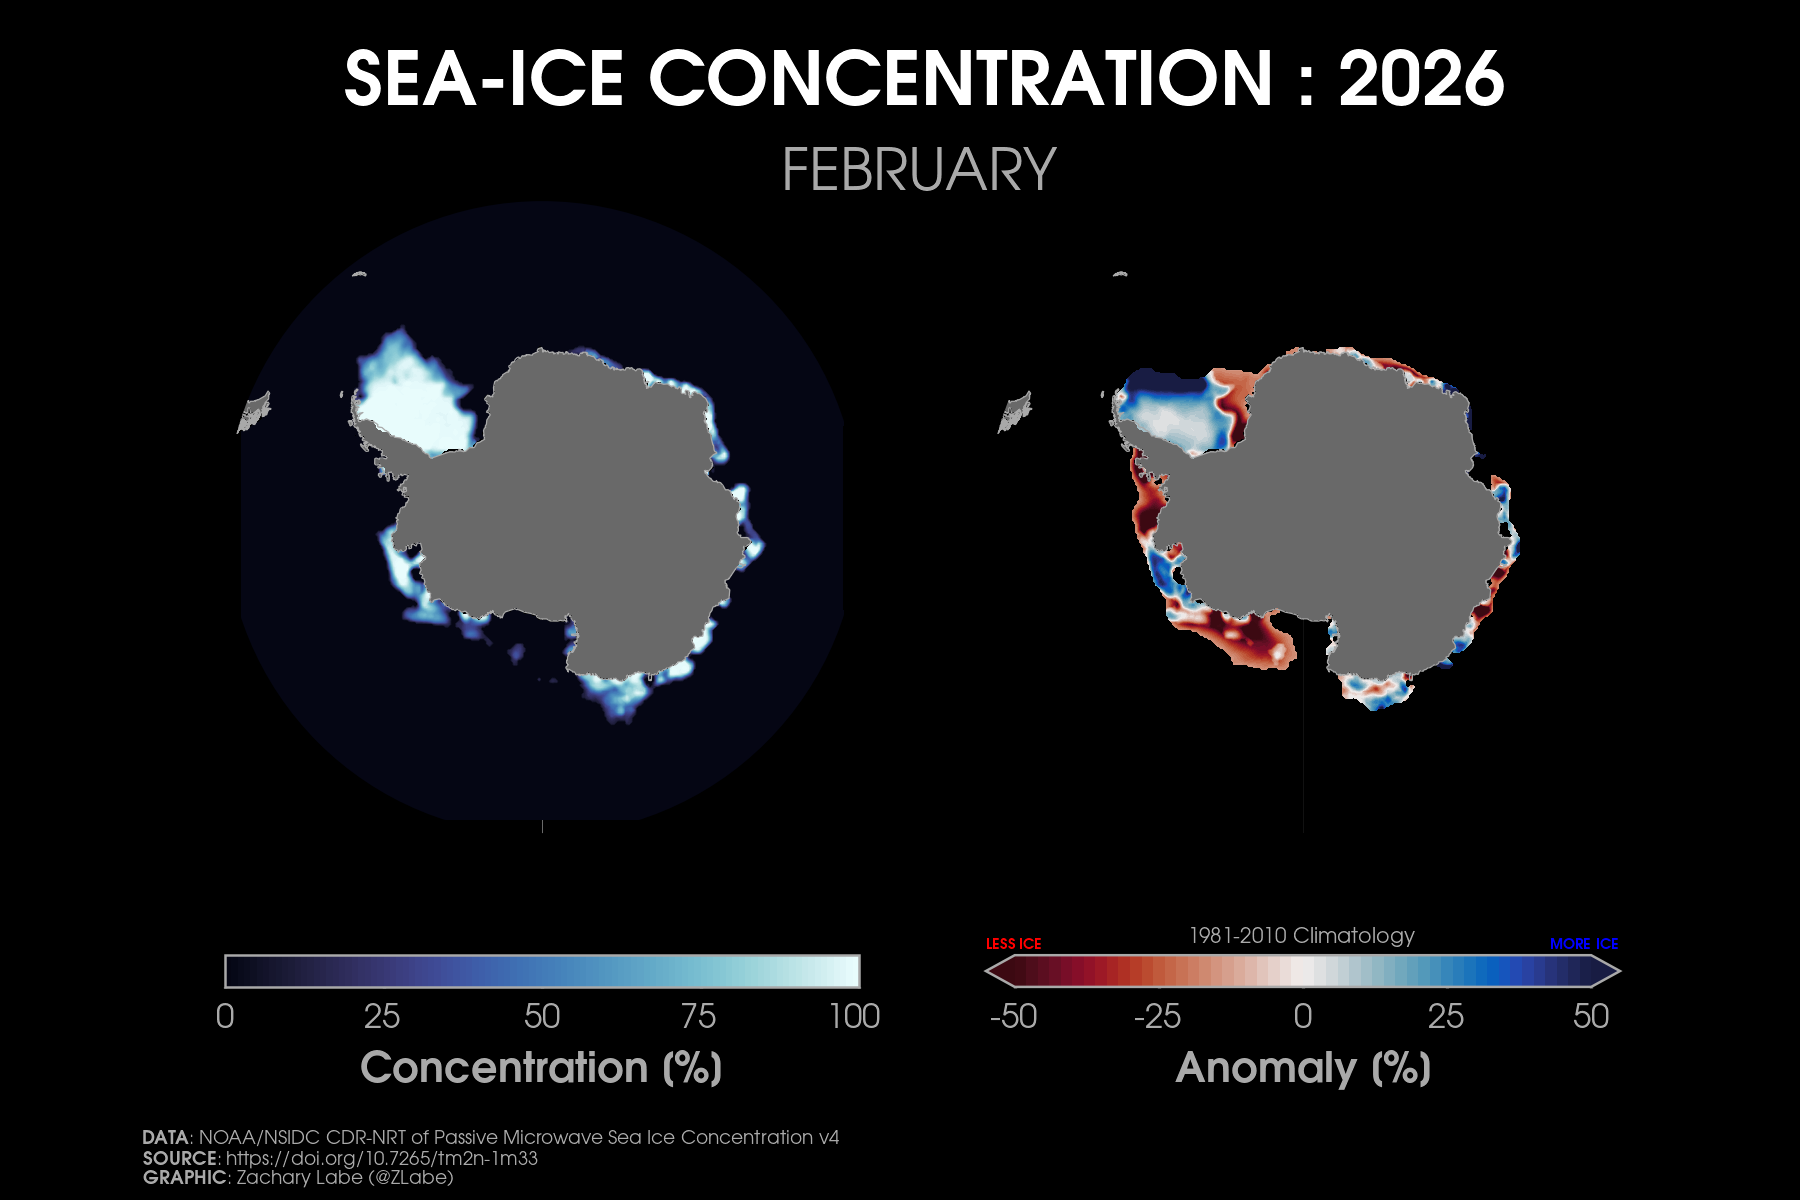
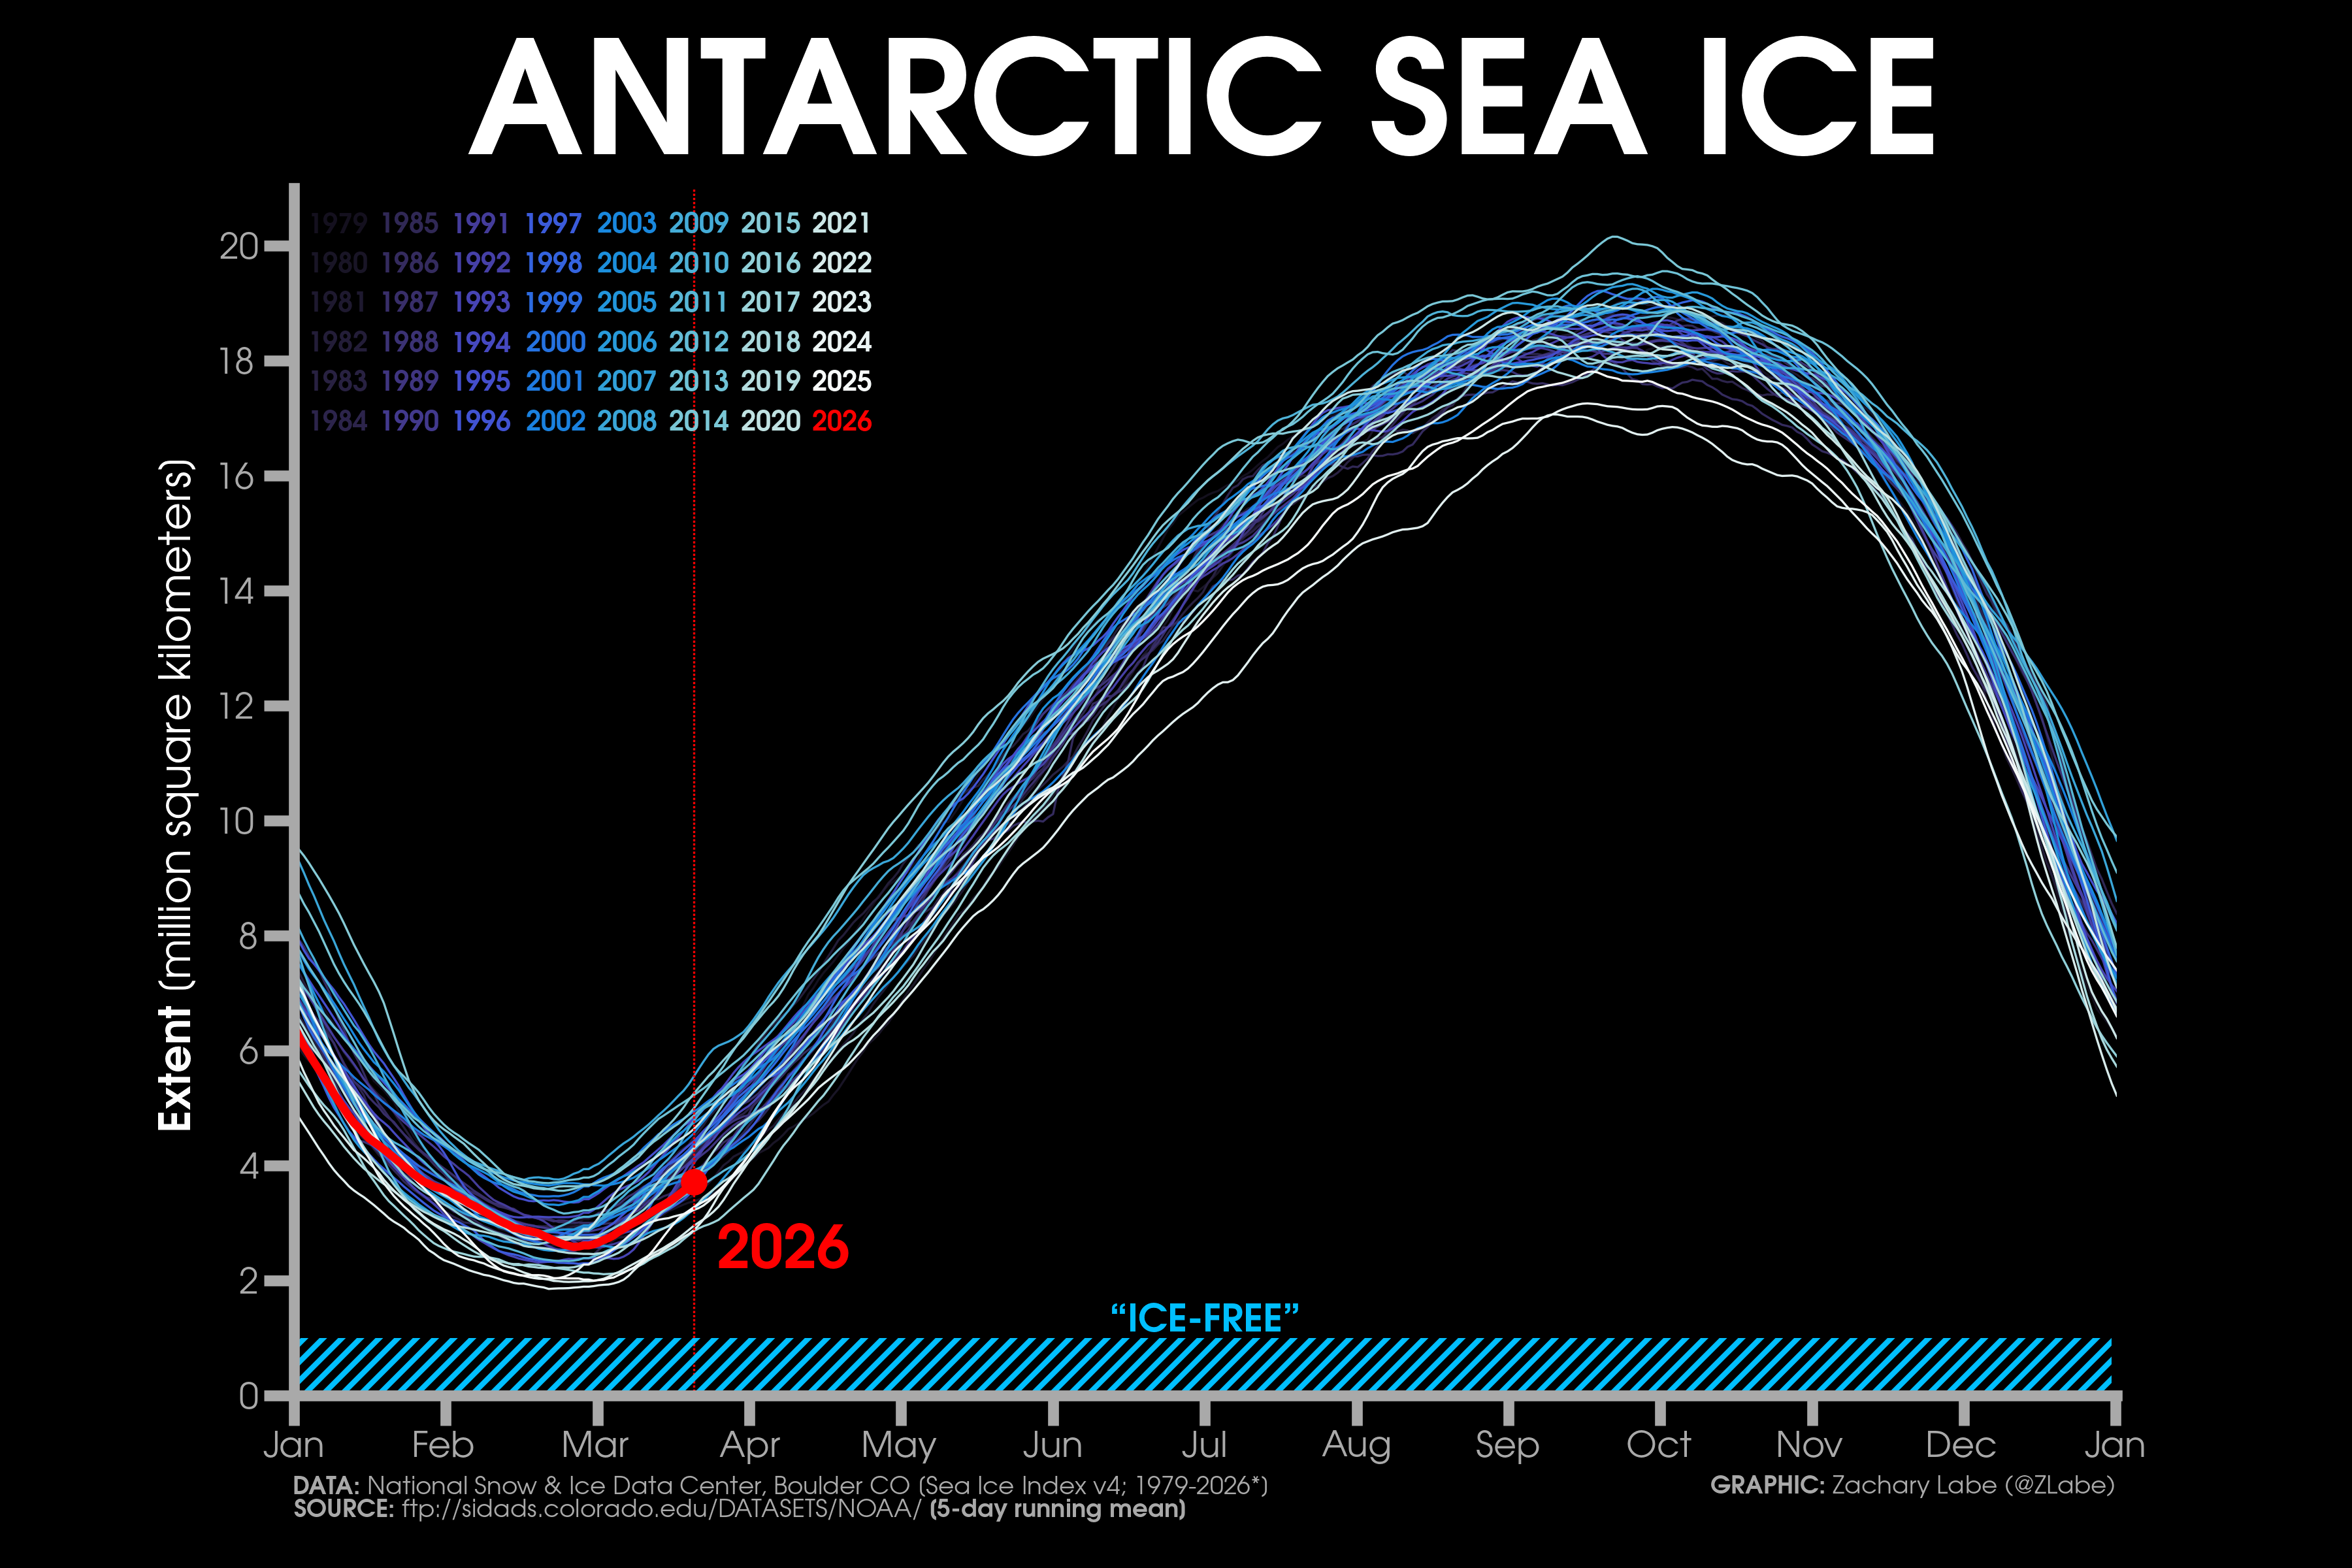
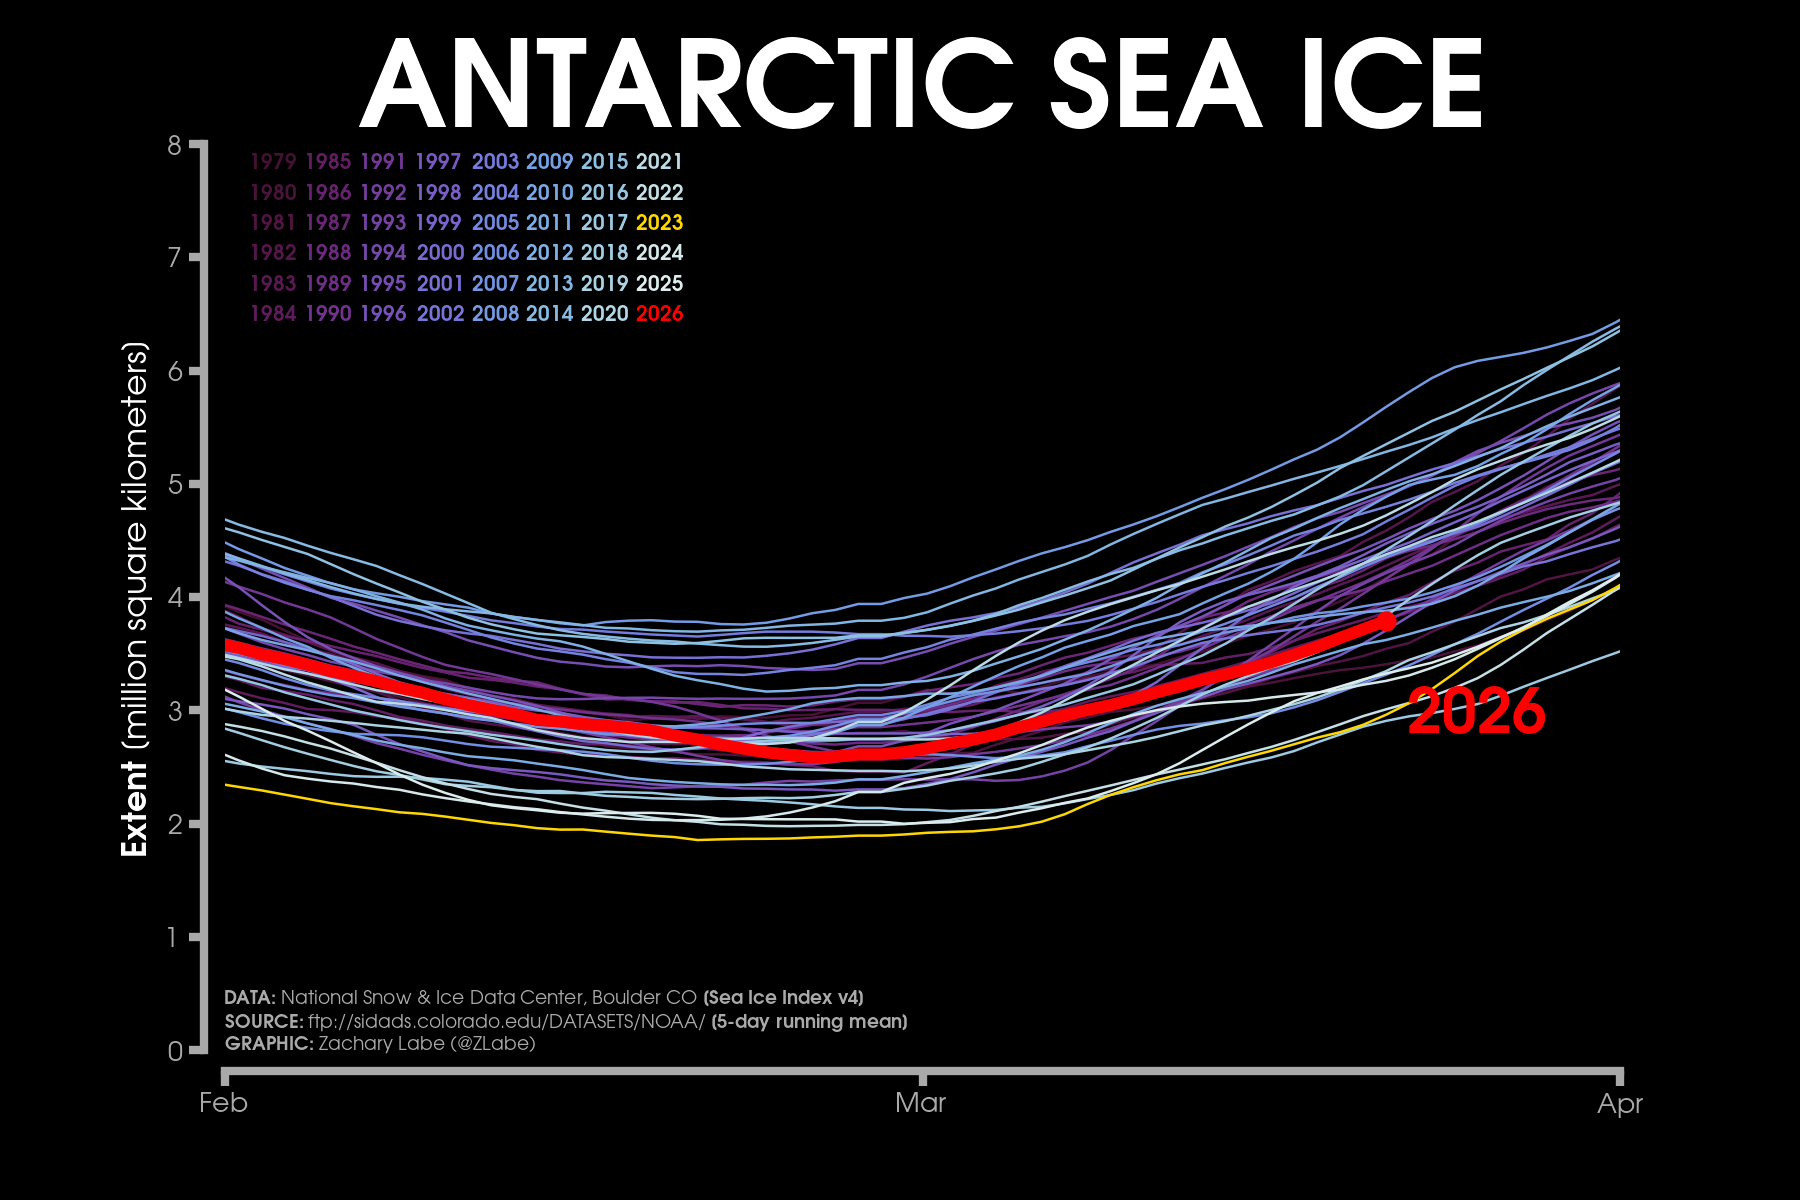
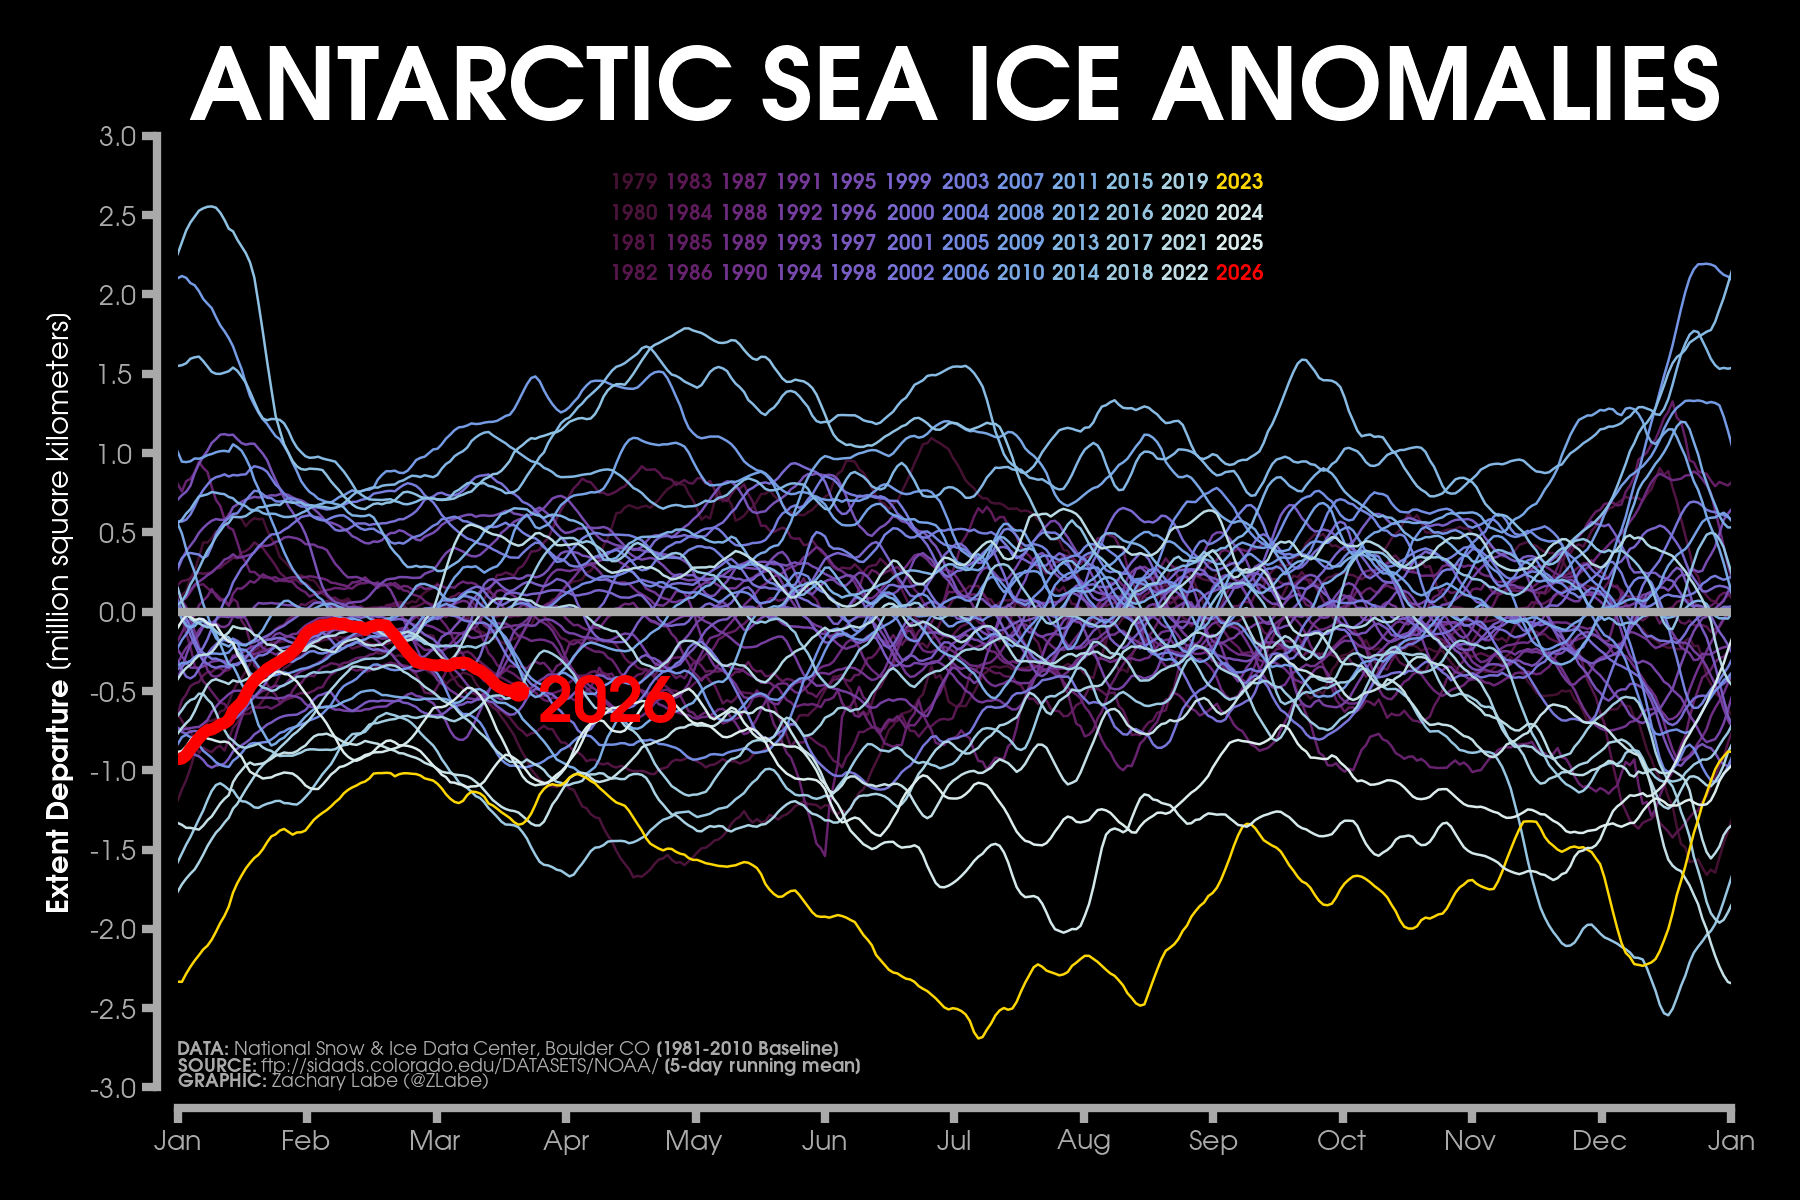
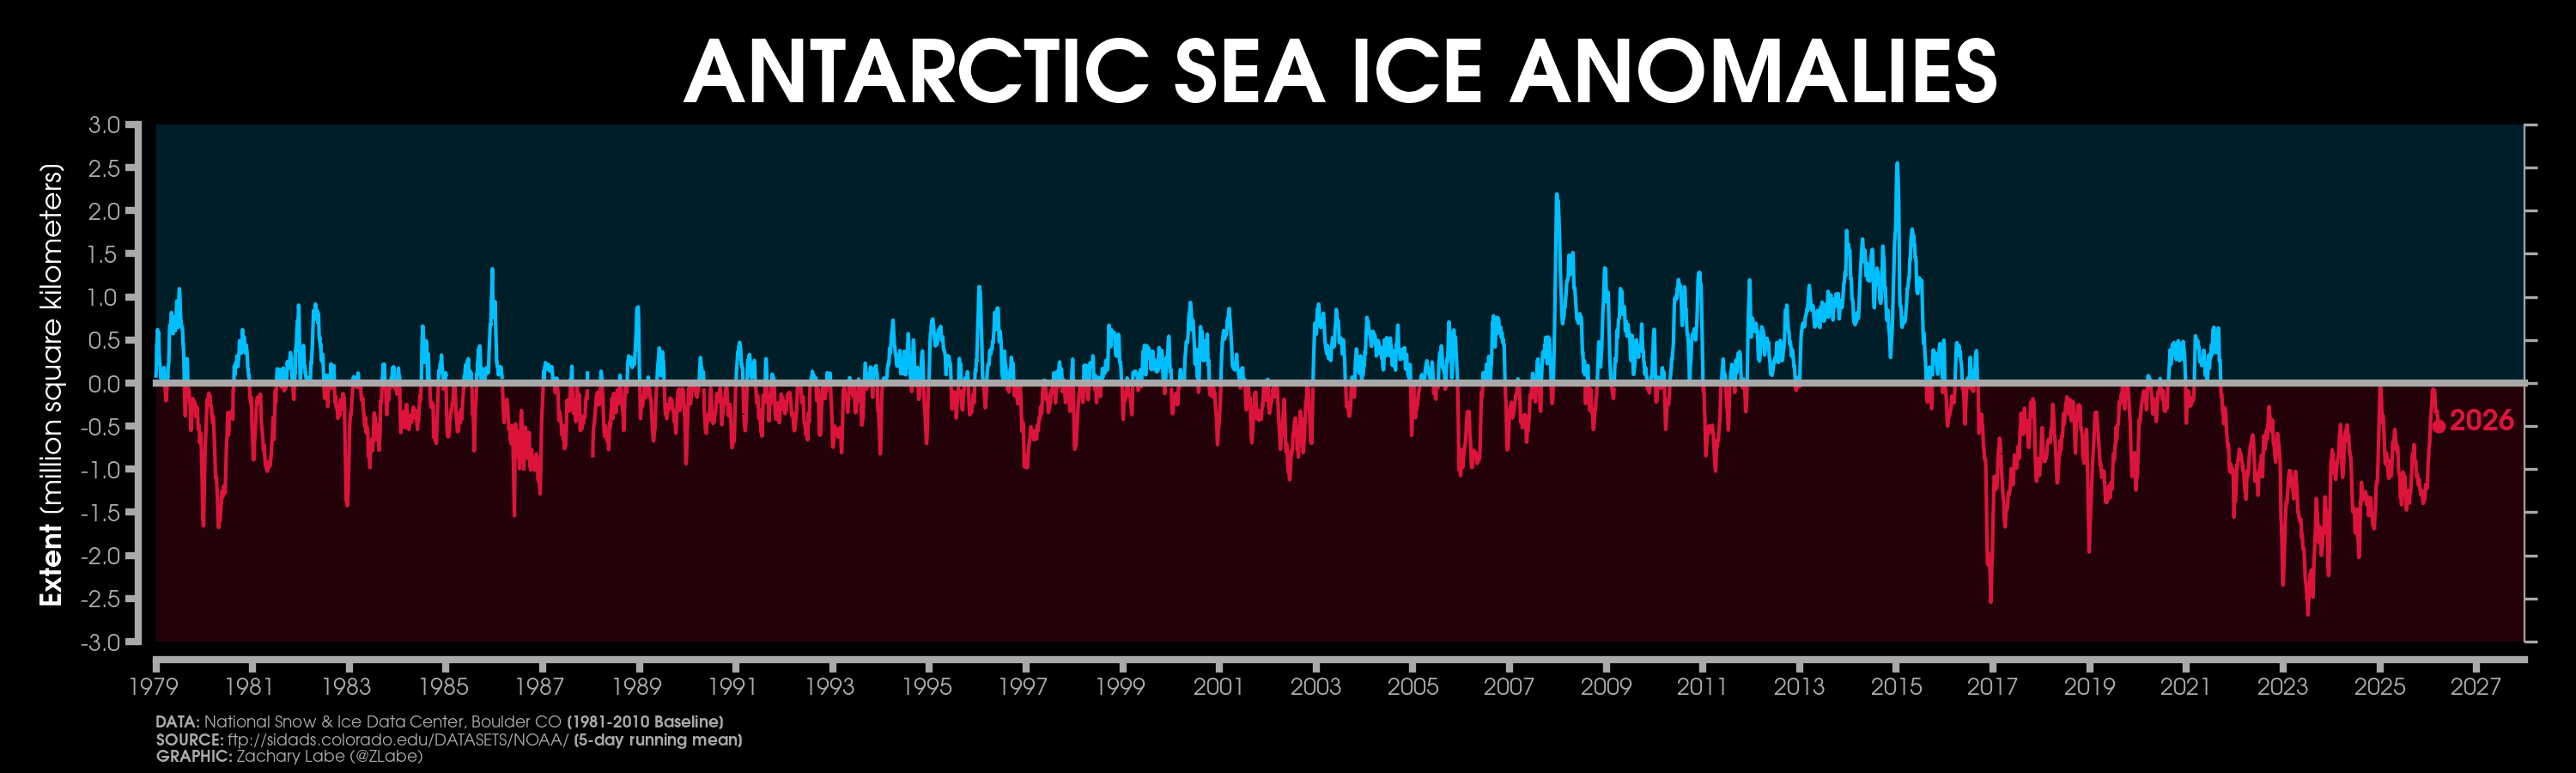
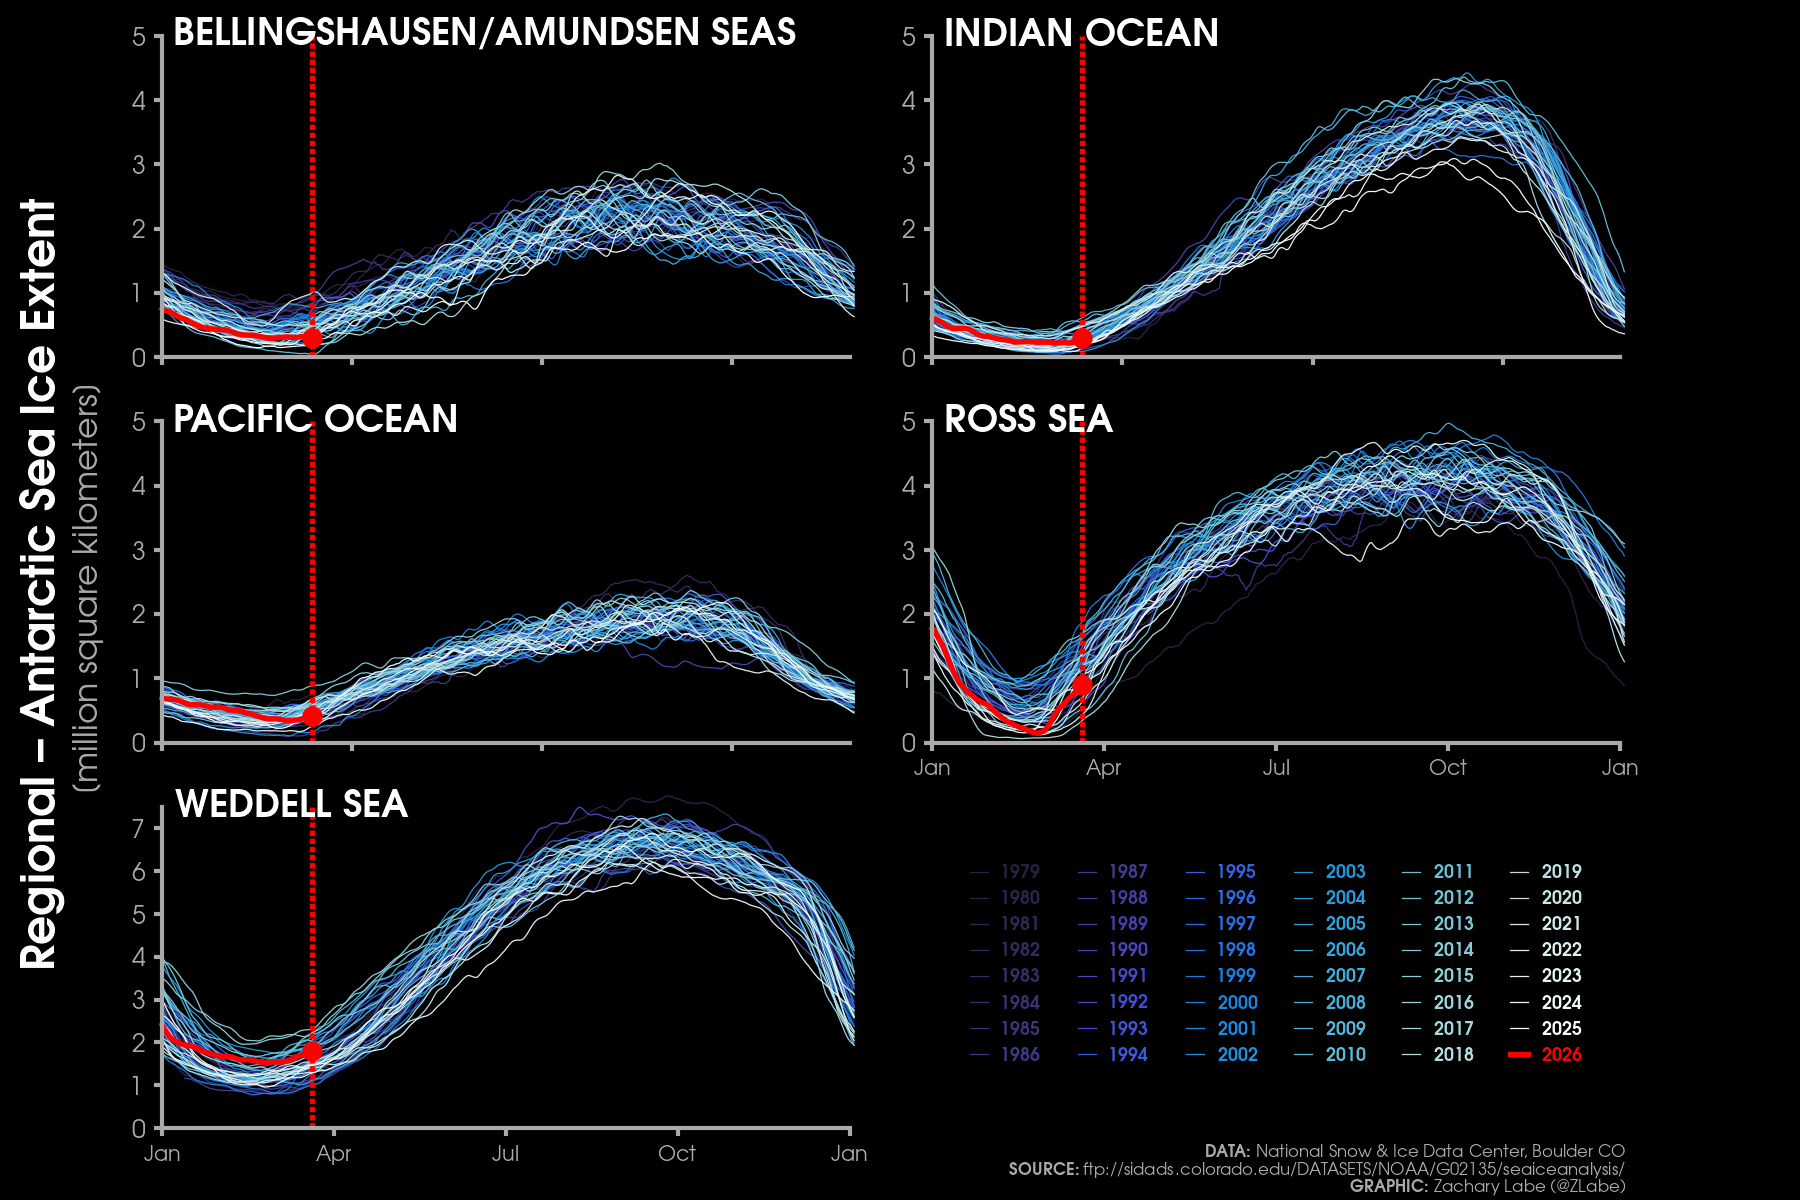
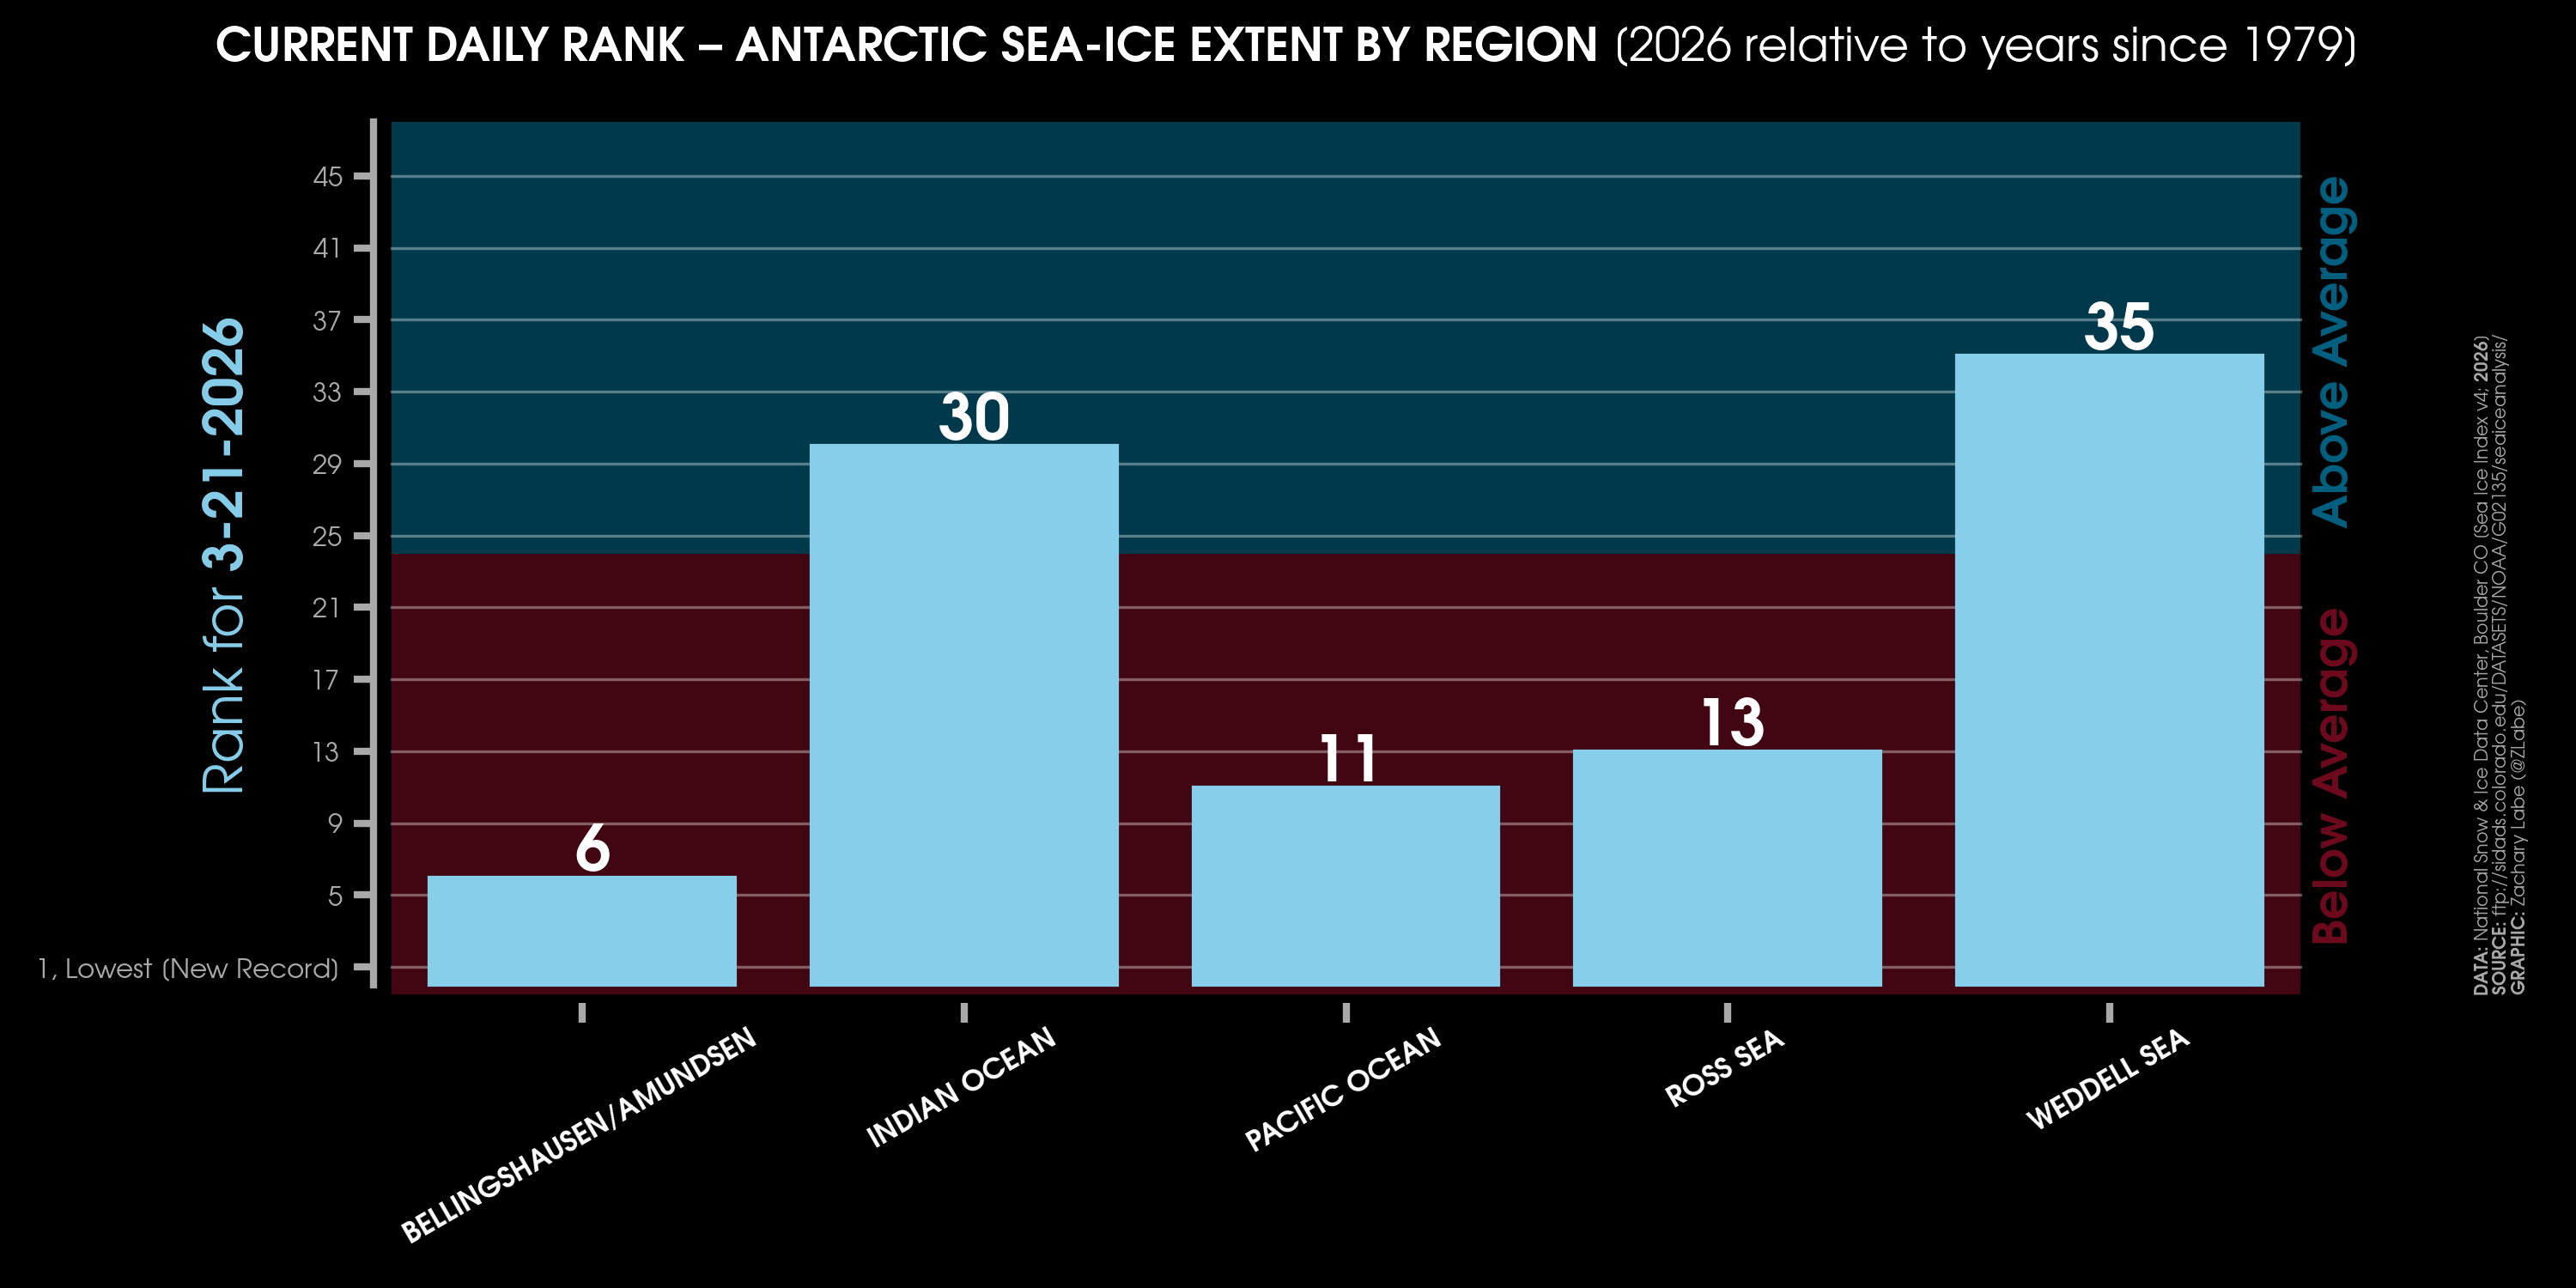
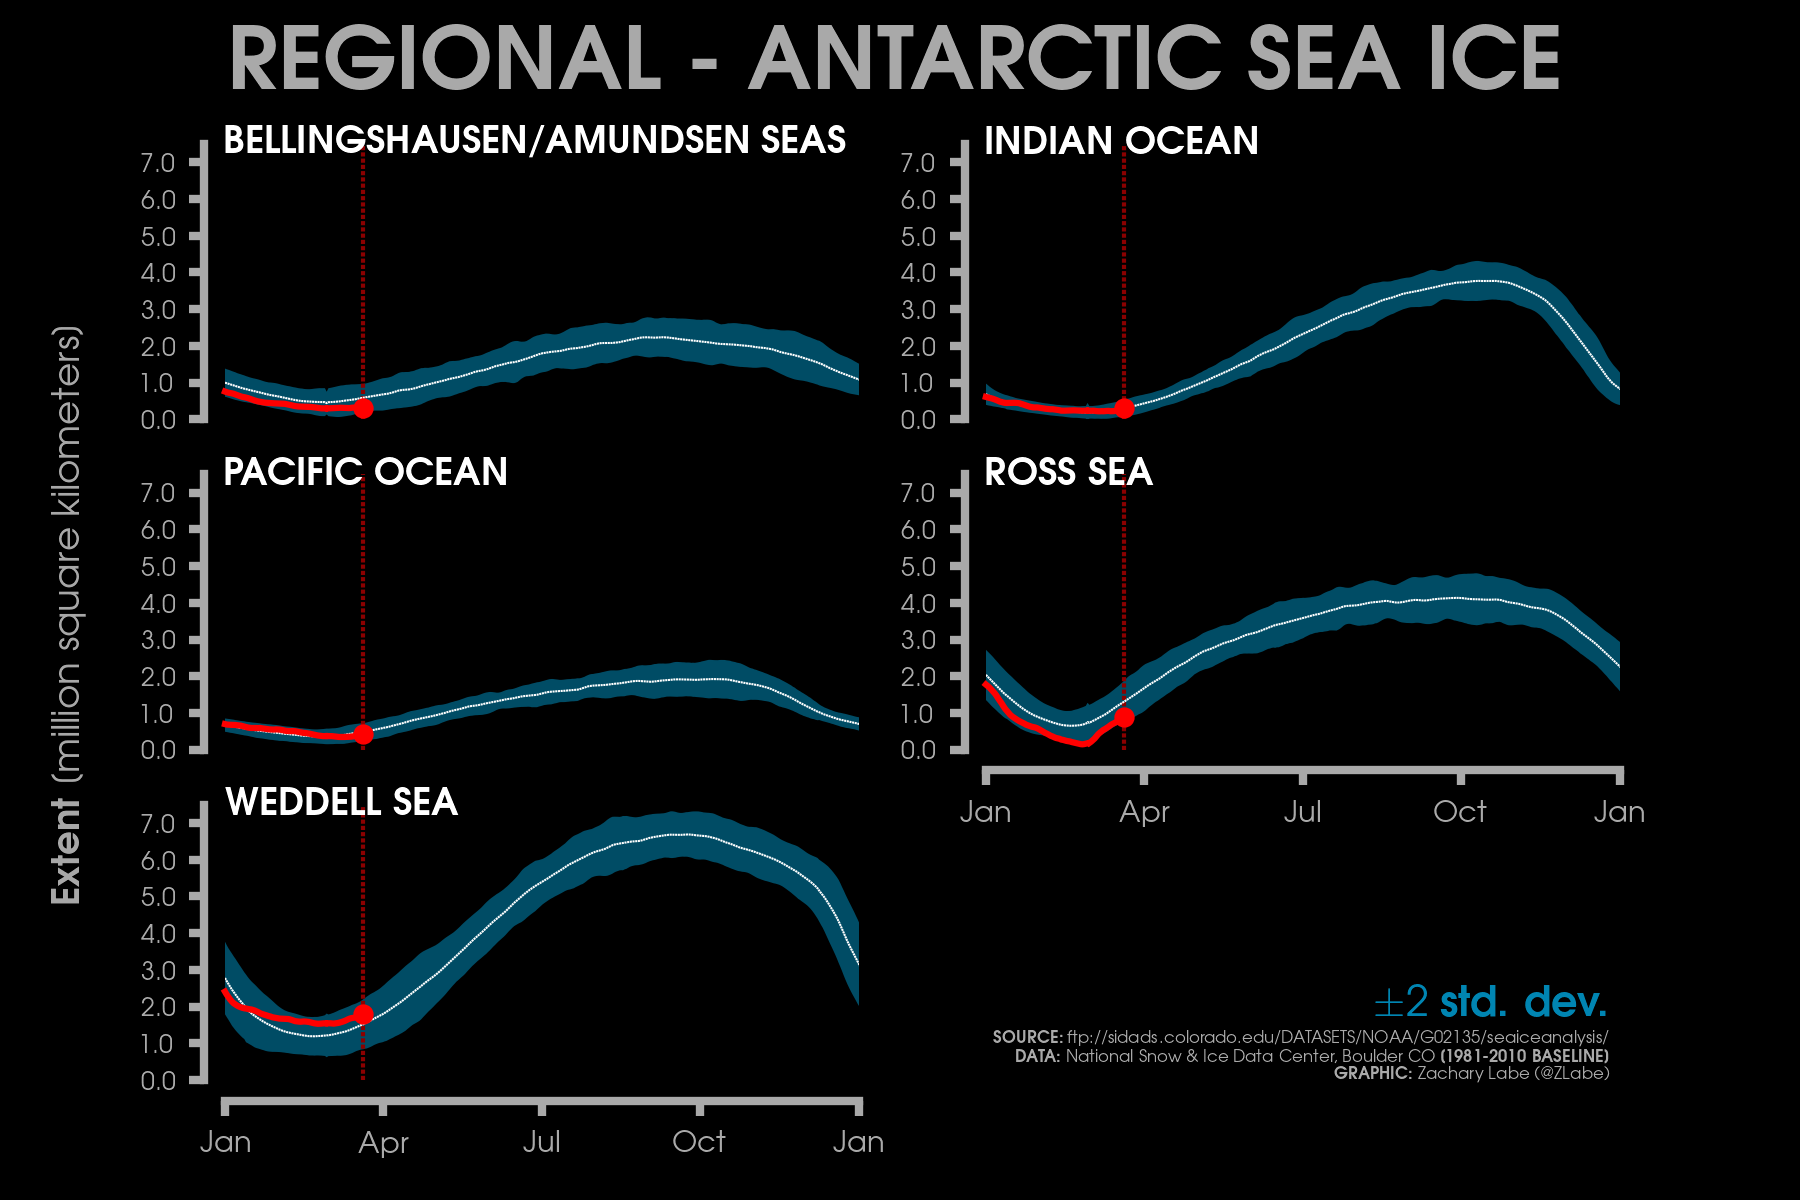
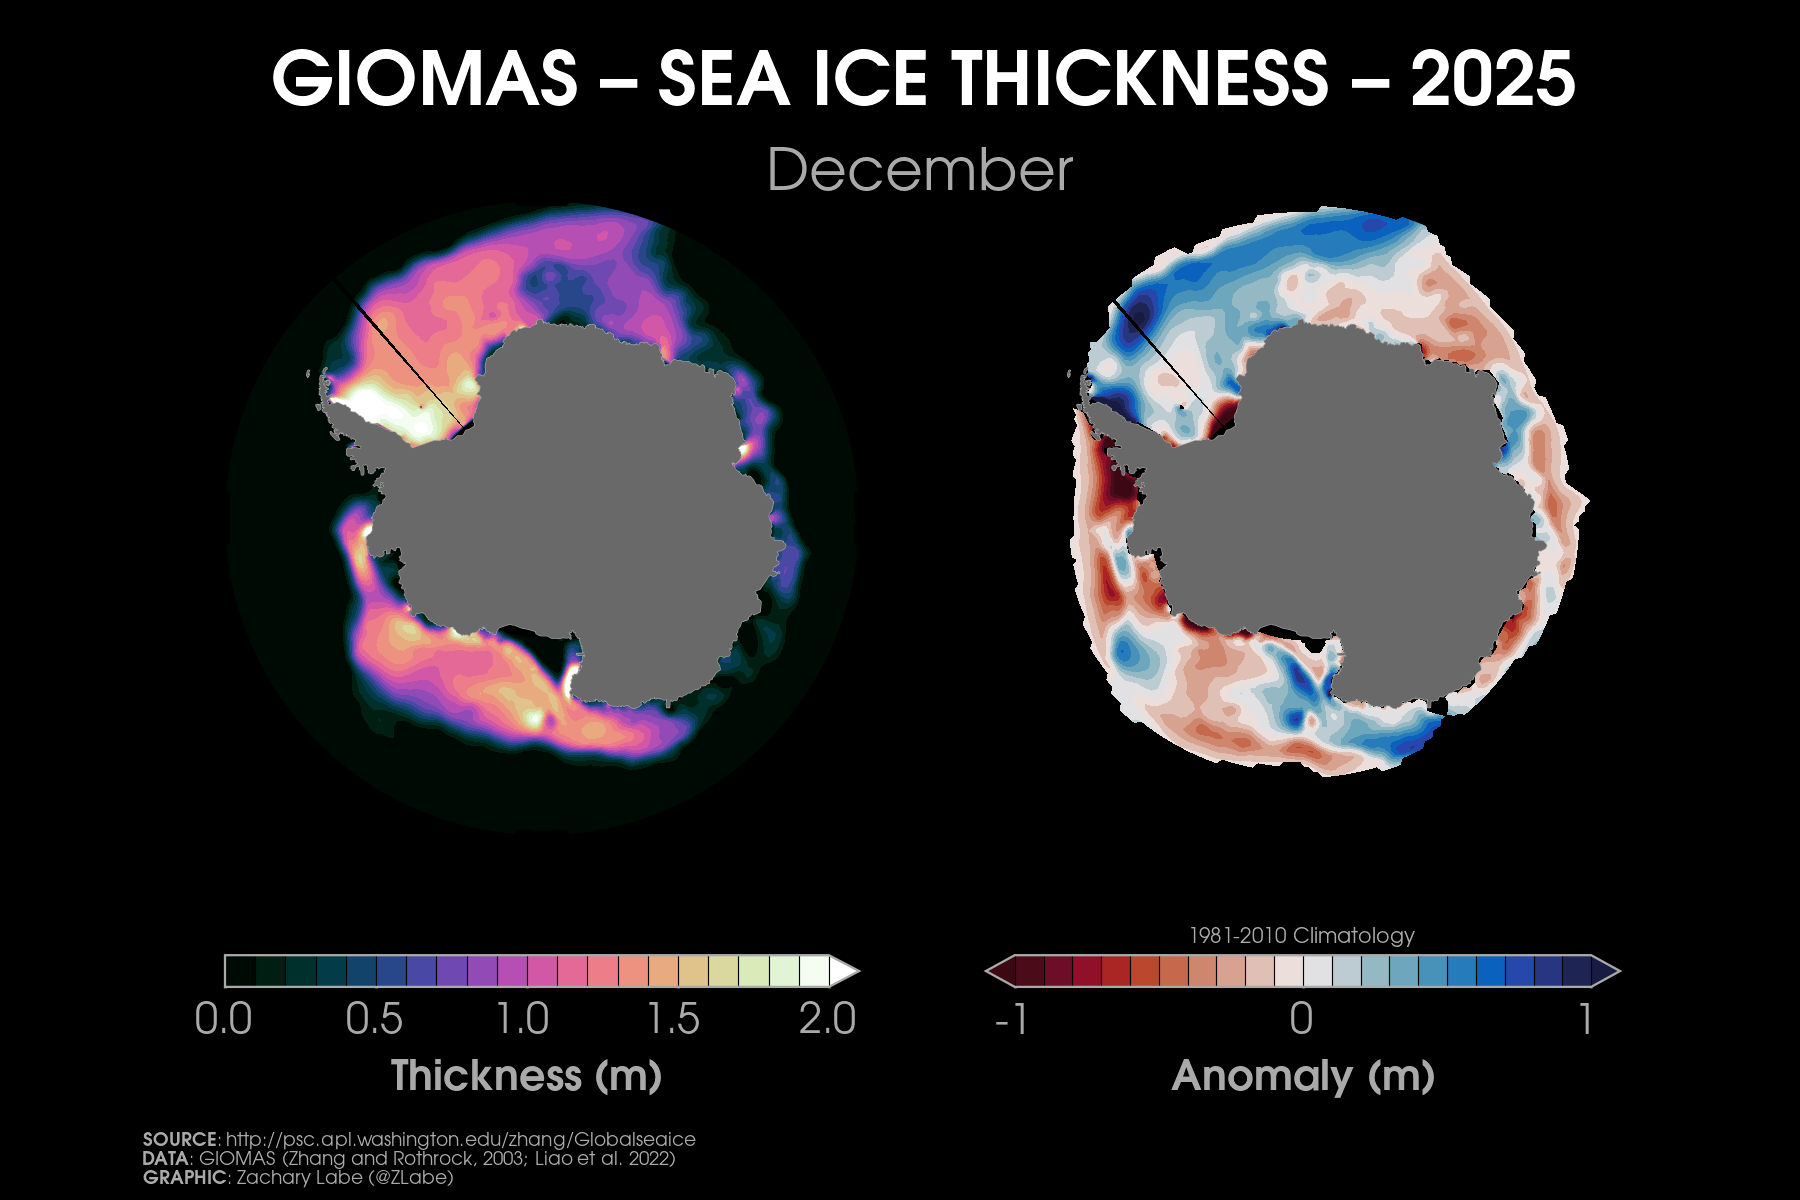
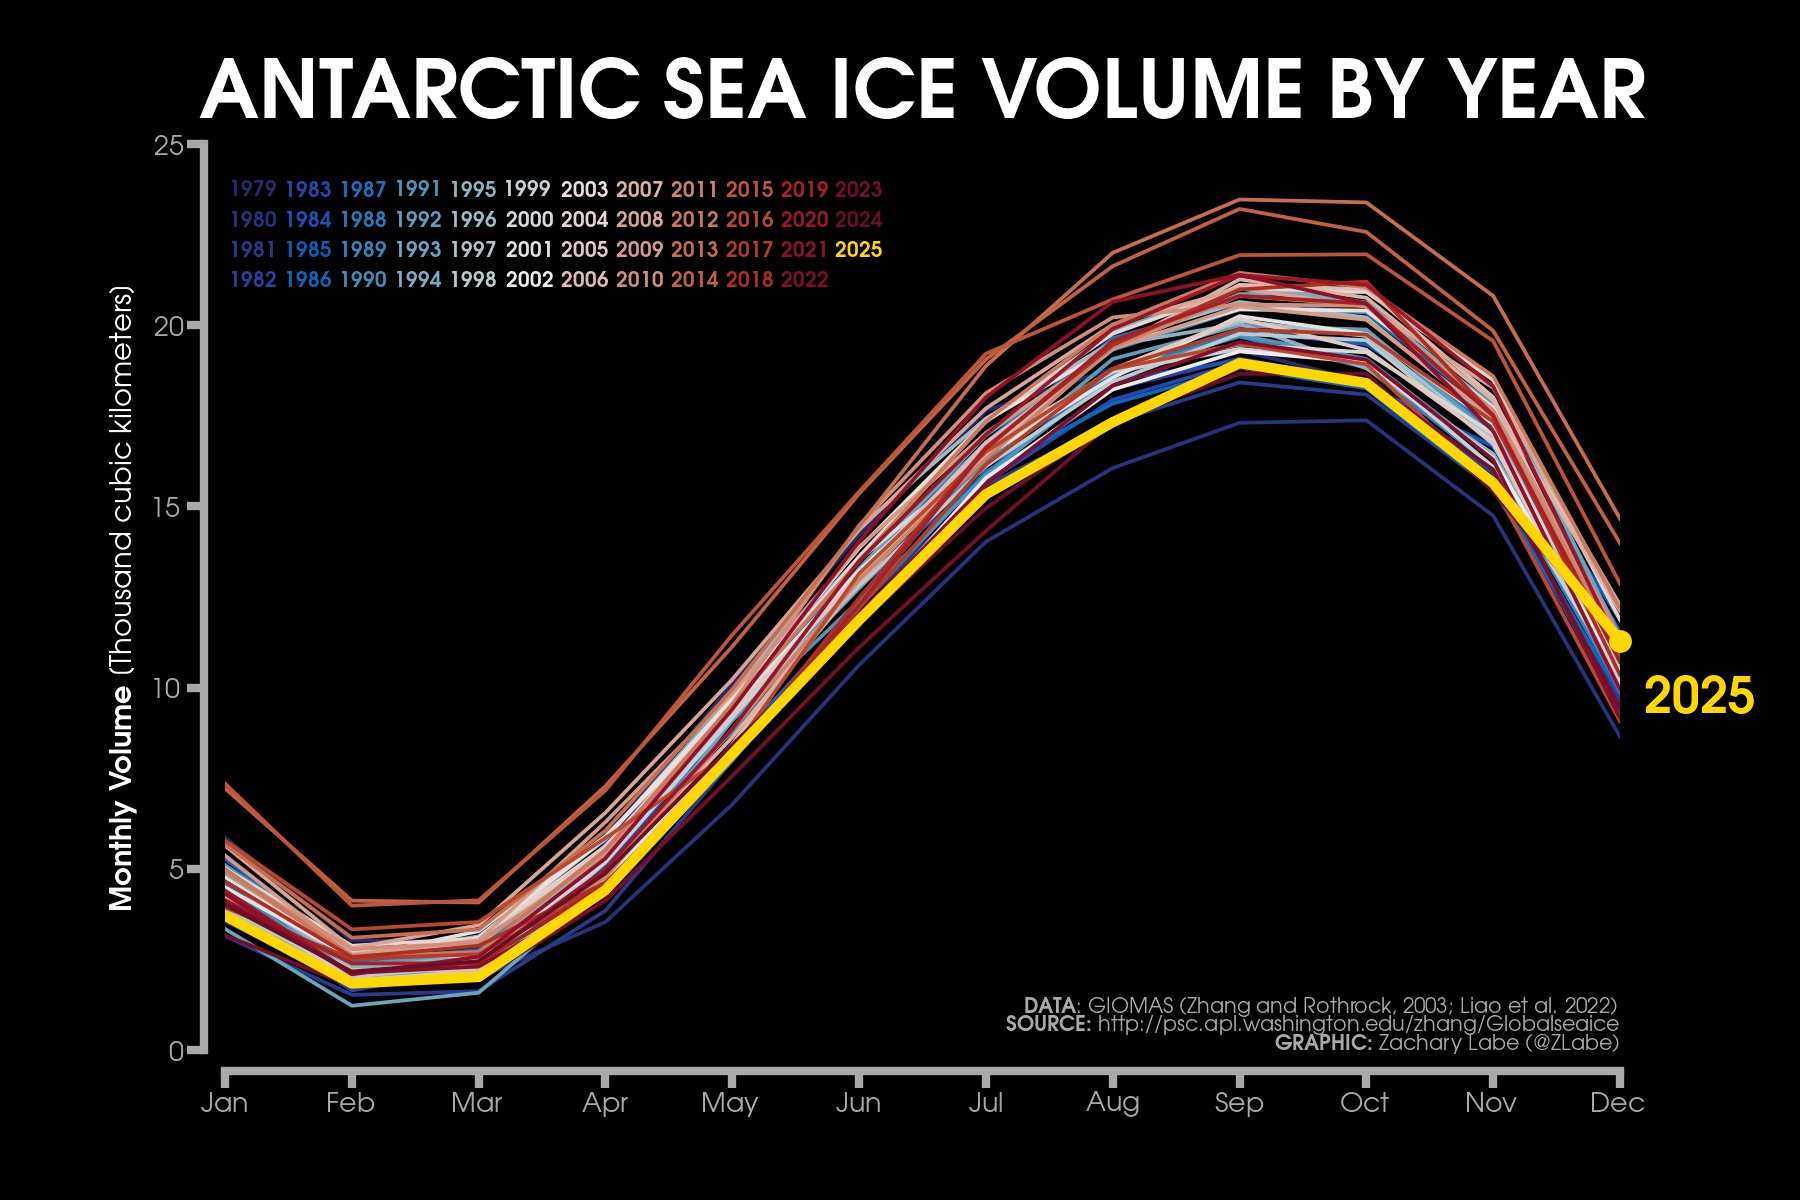
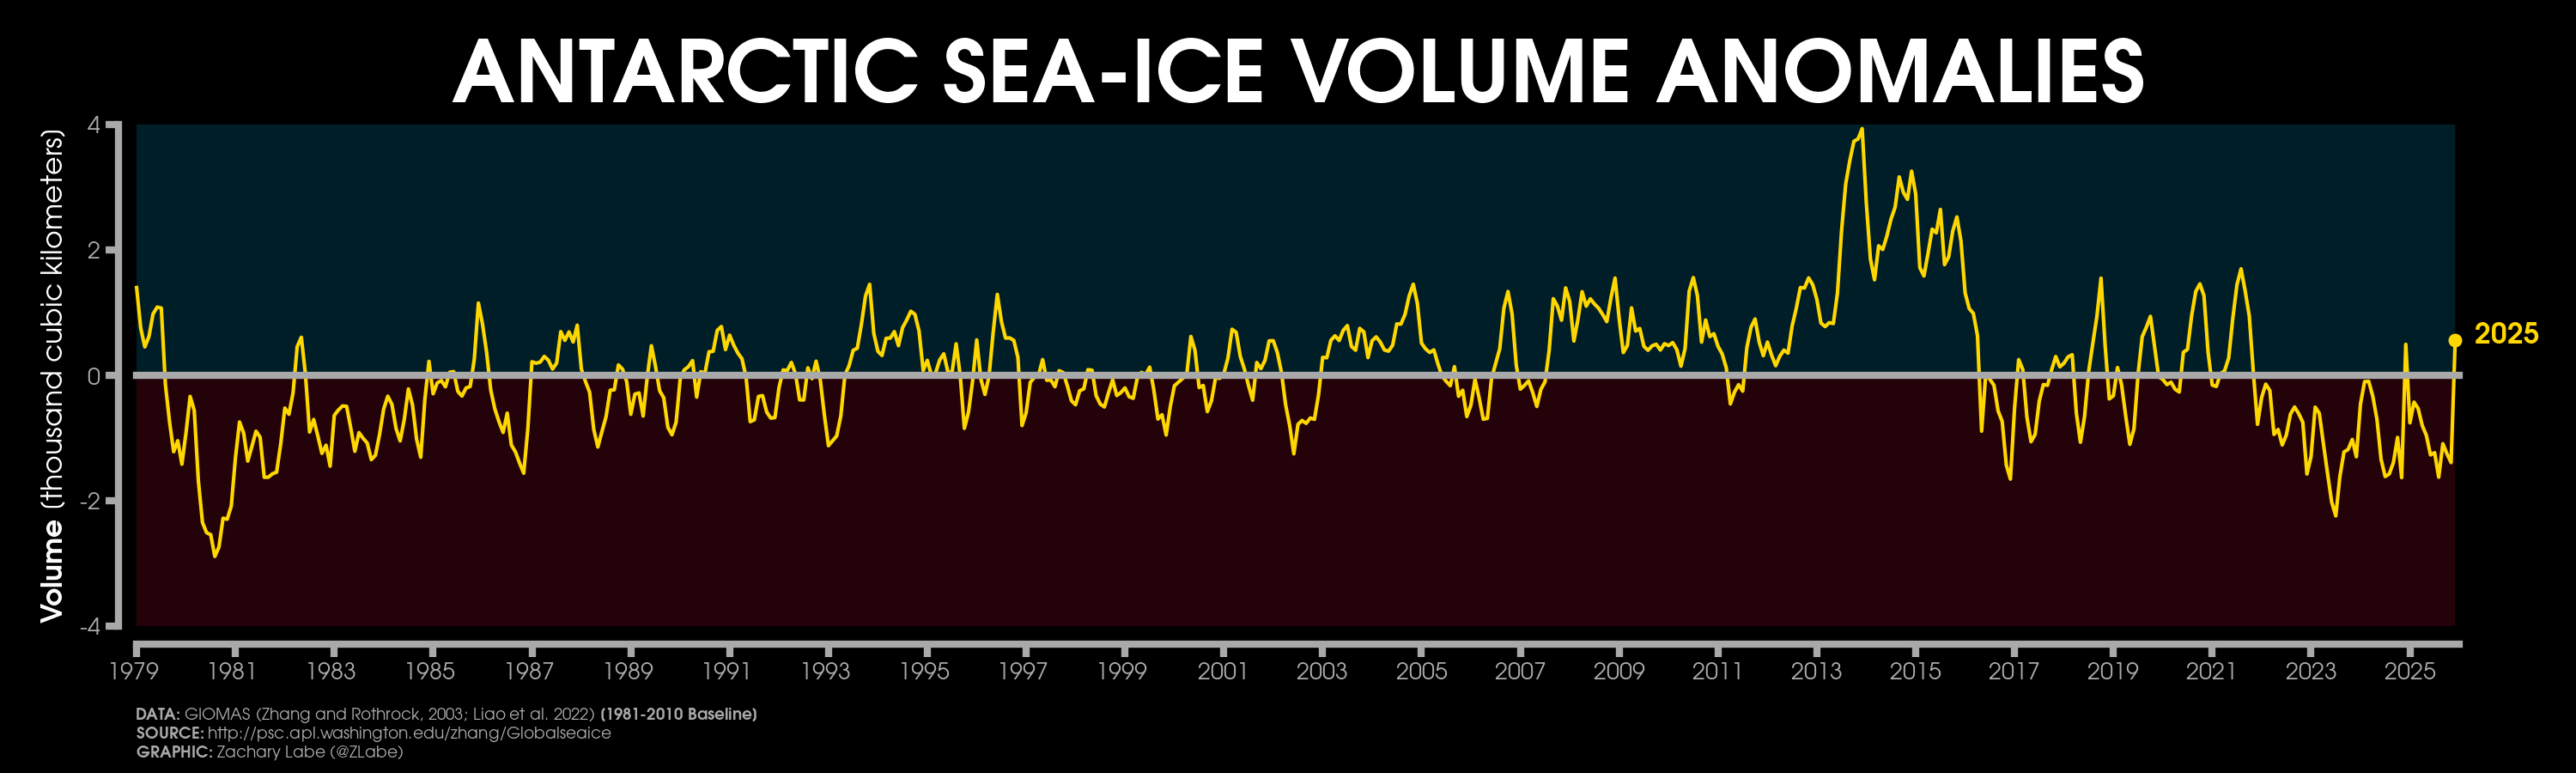
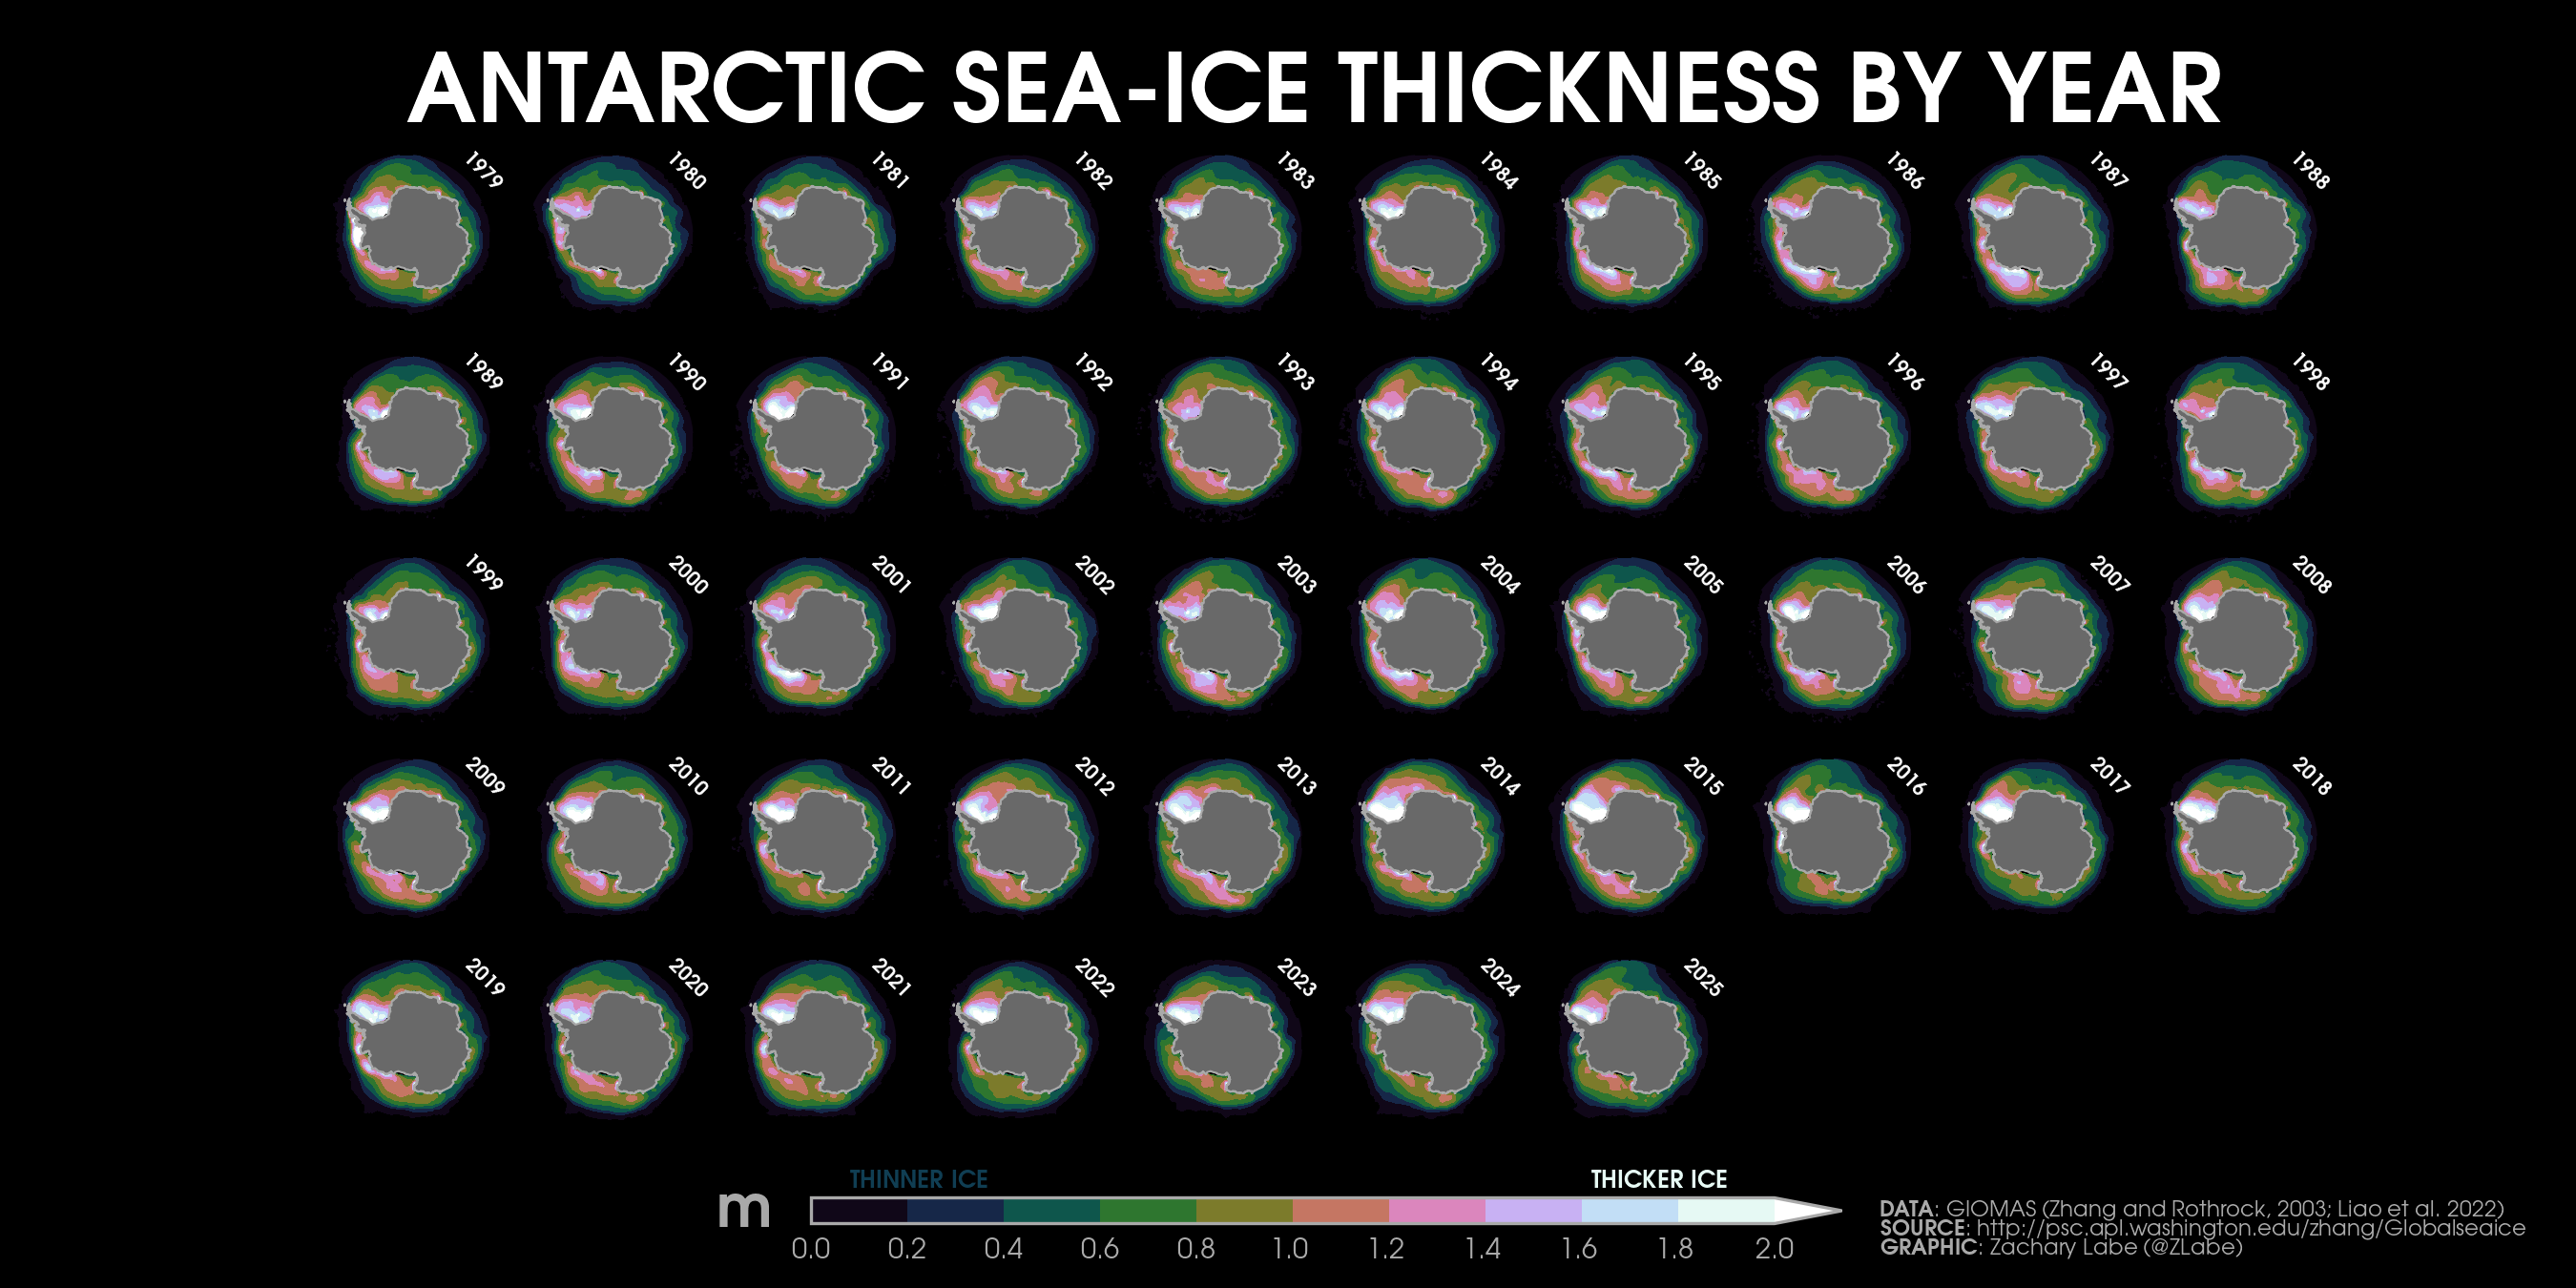
Current Antarctic sea ice extent (NSIDC, DMSP SSM/I-SSMIS F-18 and JAXA AMSR2) in addition to climatology (blue, 1981-2010) and 2 standard deviations from the mean (updated 3/23/2026)Monthly averaged Antarctic sea-ice concentration for February 2026 (left) and its anomalies relative to 1981-2010 (right). Data from NRT NOAA/NSIDC CDR of Passive Microwave Sea Ice Concentration v4 (https://doi.org/10.7265/tm2n-1m33); ice concentration updated with up to a 1-month lag. Graphic created on 3/2/2026.[Special (temporary) graphic to monitor the ongoing record low] Antarctic sea ice extent 3/23/2026).[Special (temporary) graphic to monitor the ongoing record low] Antarctic sea ice extent for each year from 1979 to 2026 (satellite-era; NSIDC, DMSP SSM/I-SSMIS and JAXA AMSR2). 2024 is highlighted with a yellow line. 2026 is shown using a red line (updated 3/23/2026).Antarctic sea ice extent anomalies for each year from 1979 to 2026 (satellite-era; NSIDC, DMSP SSM/I-SSMIS and JAXA AMSR2). Anomalies are calculated using a 5-day running mean from a climatological baseline of 1981-2010. 2023 is shown with a yellow line. 2026 is shown using a red line (updated 3/23/2026).Antarctic sea ice extent anomalies stretching from January 1979 to present day (satellite-era; NSIDC, DMSP SSM/I-SSMIS and JAXA AMSR2). Anomalies are calculated using a 5-day running mean from a climatological baseline of 1981-2010 (updated 3/23/2026).Current regional Antarctic sea ice extents (NSIDC Sea Ice Index v4 : DMSP SSM/I-SSMIS F-18 and JAXA AMSR2) for 2026 (red line) and for each year through the satellite era (blue [1979] to white [2025] lines). A map of the regions can be found at https://nsidc.org/arcticseaicenews/map-of-antarctica/. Graphic updated 3/23/2026.Daily rank for regional Antarctic sea ice extents (NSIDC Sea Ice Index v4 : DMSP SSM/I-SSMIS F-18 and JAXA AMSR2) over the satellite-era (1979-2026). A map of the regions can be found at https://nsidc.org/arcticseaicenews/map-of-antarctica/. A rank of “1” is the lowest on record for a given region. A rank of “48” is the highest sea-ice extent on record for a given region. Graphic is updated for the ranks on 3/23/2026.Current regional Antarctic sea ice extents (NSIDC Sea Ice Index v4; DMSP SSM/I-SSMIS F-18 and JAXA AMSR2) in addition to 2 standard deviations from the 1981-2010 mean (updated 3/23/2026).Current simulated (GIOMAS; Zhang and Rothrock, 2003) sea ice thickness and anomalies (1981-2010 baseline) updated for December 2025. For more information on this ice-ocean reanalysis dataset, see https://tc.copernicus.org/articles/16/1807/2022/.Latest GIOMAS model (Zhang and Rothrock, 2003) simulated sea ice volume (SIV) averaged for the Southern Hemisphere (Antarctic). Volume is averaged for each month from 1979 to 2025. Graphic updated through December 2025.Monthly Antarctic sea ice volume anomalies stretching from January 1979 to December 2025 (GIOMAS; Zhang and Rothrock, 2003). Anomalies are calculated from a climatological baseline of 1981-2010 (updated 1/18/2026).Current simulated (GIOMAS; Zhang and Rothrock, 2003) sea ice thickness averaged over each year from 1979 to 2025. Updated 1/18/2026.Since sea ice thickness observations are sparse, we utilize the GIOMAS model (Zhang and Rothrock, 2003) to visualize sea ice thickness averaged for each year from 1979 to 2025. For more information on this ice-ocean reanalysis dataset, see https://tc.copernicus.org/articles/16/1807/2022/. Updated 1/18/2026.
[1] Eayrs, C. and Z.M. Labe (2025). The future of sea ice. Comprehensive Cryospheric Science and Environmental Change, DOI:10.1016/B978-0-323-85242-5.00050-6 [HTML][BibTeX]
All of the Python code used to generate these figures are available from my GitHub account. Most scripts use data sets that are generated via ftp retrieval.
*These figures may be freely distributed (with credit). Information about the data can be found on my references page and methods page.