The Best Metro Systems Across European Capital Cities
This was originally posted on our Voronoi app. Download the app for free on iOS or Android and discover incredible data-driven charts from a variety of trusted sources.
Metro stations are essential to urban life, but their quality and level of modernization vary across Europe’s capital cities.
High-quality transportation networks play a crucial role in driving business productivity by enhancing mobility and expanding access to a broader labor pool. Moreover, investment in metro systems is connected with higher foreign direct investment. These investments boost a city’s appeal by improving commuting speed and accessibility.
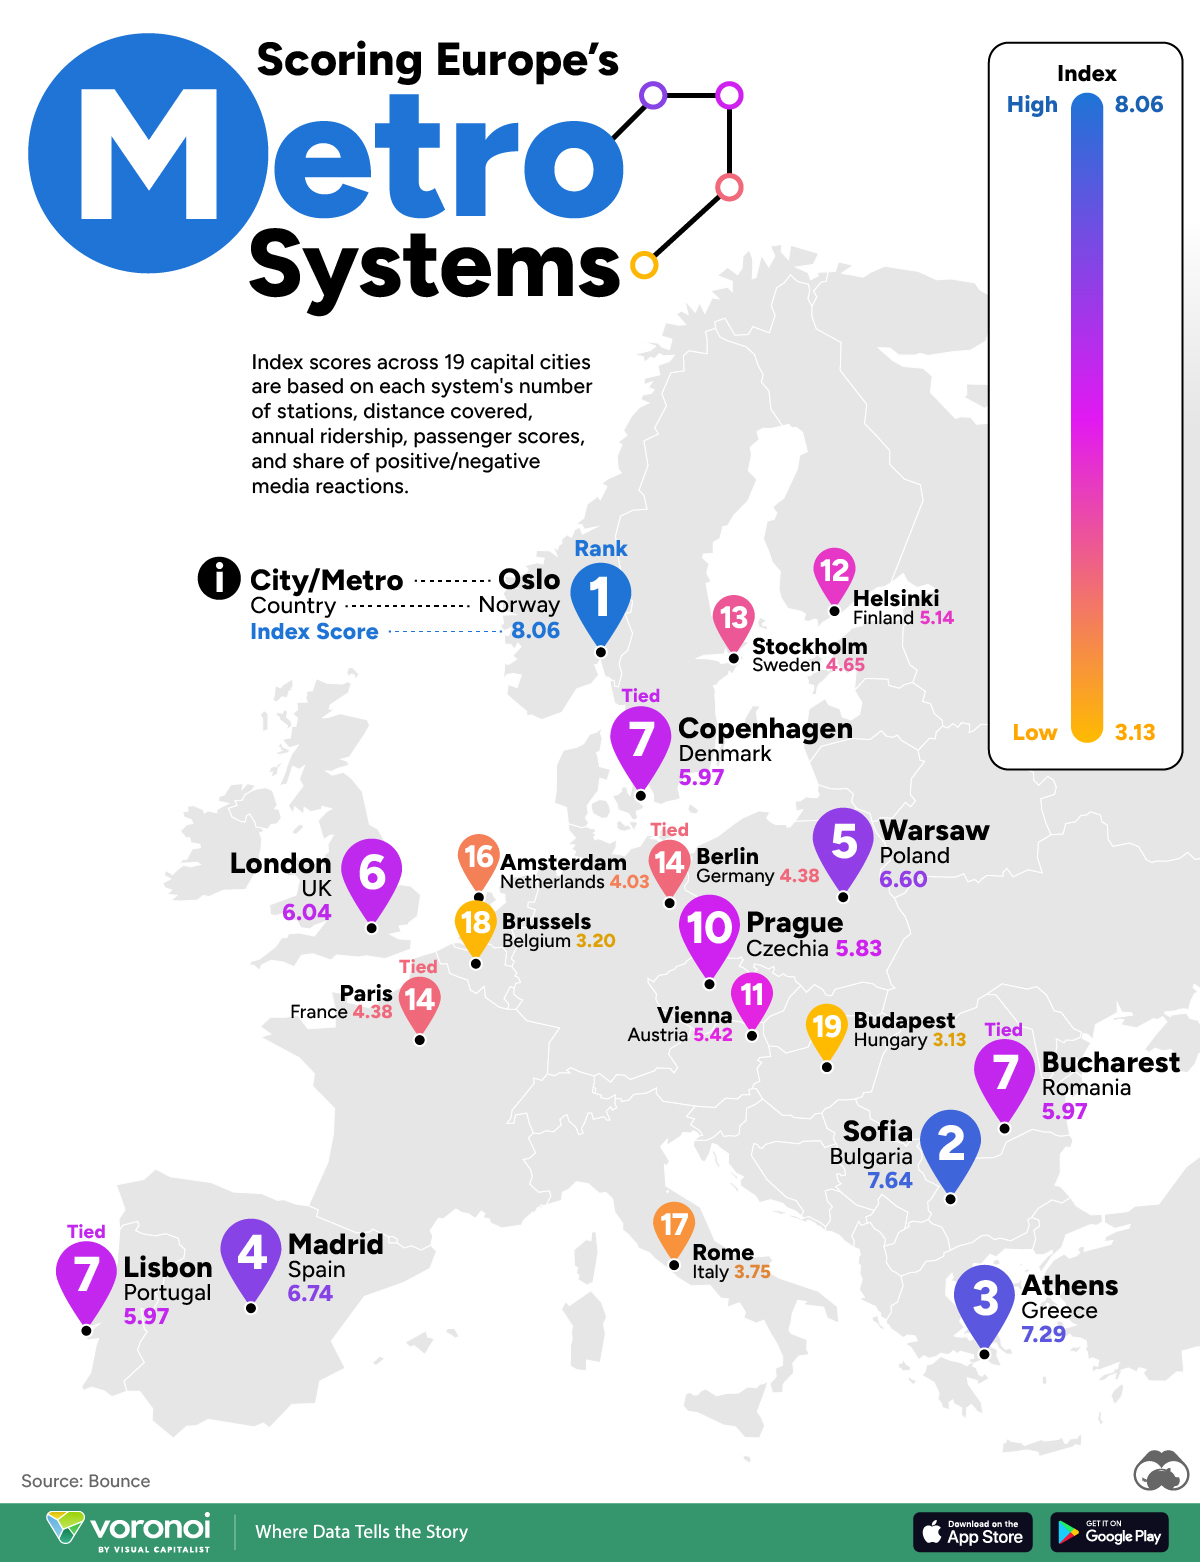
This graphic ranks the metro systems of European capital cities, based on data from Bounce.
Methodology
For the ranking, metro systems across 19 European capital cities were scored according to the following metrics:
- Number of stations
- Annual ridership
- Distance covered
- Google review scores
- The share of positive and negative online reactions to articles about each metro system
Due to travel advisories, Belarus, Ukraine, and Russian capitals were excluded. Overall, metro systems were measured out of a score of 10.
Norway is Home to Top Metro System in European Capitals
Oslo, the capital of Norway, tops the list with 101 metro stations across its transit network.
In 2023, it became the first metro system in the world to operate entirely on electric power. As the largest network in Scandinavia, Oslo’s metro stations earned an average Google review score of 4.13 out of 5 stars, with users often saying they were “very well organized” and “easy to get around”.
| Rank | City | Country | Overall Score |
|---|---|---|---|
| 1 | Oslo | 🇳🇴 Norway | 8.06 |
| 2 | Sofia | 🇧🇬 Bulgaria | 7.64 |
| 3 | Athens | 🇬🇷 Greece | 7.29 |
| 4 | Madrid | 🇪🇸 Spain | 6.74 |
| 5 | Warsaw | 🇵🇱 Poland | 6.6 |
| 6 | London | 🇬🇧 UK | 6.04 |
| 7 | Bucharest | 🇷🇴 Romania | 5.97 |
| 7 | Lisbon | 🇵🇹 Portugal | 5.97 |
| 7 | Copenhagen | 🇩🇰 Denmark | 5.97 |
| 10 | Prague | 🇨🇿 Czechia | 5.83 |
| 11 | Vienna | 🇦🇹 Austria | 5.42 |
| 12 | Helsinki | 🇫🇮 Finland | 5.14 |
| 13 | Stockholm | 🇸🇪 Sweden | 4.65 |
| 14 | Berlin | 🇩🇪 Germany | 4.38 |
| 14 | Paris | 🇫🇷 France | 4.38 |
| 16 | Amsterdam | 🇳🇱 Netherlands | 4.03 |
| 17 | Rome | 🇮🇹 Italy | 3.75 |
| 18 | Brussels | 🇧🇪 Belgium | 3.2 |
| 19 | Budapest | 🇭🇺 Hungary | 3.13 |
Sofia, Bulgaria, claims second place with the newest metro system among European capitals, established in 1998.
In contrast, the London Underground, built in 1863, holds the title of the world’s oldest metro system. Today, the London Underground emits 84% fewer carbon emissions per passenger than a gasoline car, and it’s on track to be fully powered by renewables by 2030. Overall, London’s metro system ranks sixth among European capitals.
Copenhagen’s automated metro runs 24/7, with trains arriving every two minutes during most of the day. Despite placing seventh on the list, it is frequently recognized as the world’s best metro system due to its exceptional reliability.
At the other end of the spectrum, Budapest’s metro system ranks last, with 75% of online reactions to transport-related news articles being negative. Passengers have described some metro stations as “rather unpleasant,” with cleanliness often cited as a major concern.
Learn More on the Voronoi App 
To learn more about this topic from a global perspective, check out this graphic on different transportation methods around the world.
Demographics
Mapped: Adults Living in Their Birth State
Half of U.S. adults still live in their birth state, on average, but some states diverge widely from that benchmark. In Nevada, just 17% of adult residents were born in-state, compared with 74% in Louisiana.

Published
3 hours ago
on
August 23, 2026

Mapped: Adults Living in Their Birth State
Key Takeaways
- Louisiana had the highest share of adult residents born in-state of any U.S. state in 2024, at 74%.
- Nevada had the lowest share at just 17%, reflecting decades of rapid population growth and in-migration.
- Nationwide, 49% of U.S. adults live in the state where they were born.
Where people live as adults can reveal a lot about a state’s population dynamics.
Some states have large shares of locally born residents, while others have much lower shares, often reflecting stronger in-migration from elsewhere in the country or abroad.
Overall, the figure for each state reflects two forces: how many current residents were born locally and how many newcomers the state has attracted.
This visualization maps the share of adults in each U.S. state who lived in the state where they were born in 2024, the latest data available as of August 2026. The data for this visualization comes from the U.S. Census Bureau’s 2024 American Community Survey 1-Year Estimates.
Louisiana Has America’s Highest Share of Locally Born Adults
Despite net negative domestic migration from the state, Louisiana ranks first among all states, with 73.9% of its current adult residents born there as of 2024.
Michigan and Ohio follow closely, at 72% and 71%, respectively. These are the only three states where at least seven in 10 adults were born in the same state where they live today.
The table below ranks all 50 states and the District of Columbia by the share of adults living in the state where they were born:
| Rank | State | Share of Adult Residents Born in the Same State (%) |
|---|---|---|
| 1 | Louisiana | 74 |
| 2 | Michigan | 72 |
| 3 | Ohio | 71 |
| 4 | Mississippi | 67 |
| 5 | Pennsylvania | 66 |
| 6 | Wisconsin | 66 |
| 7 | Iowa | 65 |
| 8 | West Virginia | 64 |
| 9 | Kentucky | 63 |
| 10 | Alabama | 62 |
| 11 | Indiana | 62 |
| 12 | Minnesota | 62 |
| 13 | Illinois | 61 |
| 14 | Missouri | 60 |
| 15 | Nebraska | 57 |
| 16 | South Dakota | 56 |
| 17 | North Dakota | 56 |
| 18 | New York | 56 |
| 19 | Arkansas | 54 |
| 20 | Maine | 54 |
| 21 | Oklahoma | 53 |
| 22 | Kansas | 53 |
| 23 | Massachusetts | 53 |
| 24 | Utah | 52 |
| 25 | Tennessee | 50 |
| 26 | Texas | 50 |
| 27 | California | 48 |
| 28 | Connecticut | 47 |
| 29 | Hawaii | 47 |
| 30 | Rhode Island | 47 |
| 31 | North Carolina | 46 |
| 32 | Georgia | 46 |
| 33 | South Carolina | 45 |
| 34 | New Mexico | 45 |
| 35 | Montana | 45 |
| 36 | New Jersey | 44 |
| 37 | Vermont | 42 |
| 38 | Virginia | 42 |
| 39 | Maryland | 39 |
| 40 | Washington | 39 |
| 41 | Oregon | 38 |
| 42 | Idaho | 35 |
| 43 | Delaware | 35 |
| 44 | New Hampshire | 34 |
| 45 | Wyoming | 34 |
| 46 | Alaska | 33 |
| 47 | Colorado | 32 |
| 48 | Arizona | 30 |
| 49 | Florida | 26 |
| 50 | District of Columbia | 25 |
| 51 | Nevada | 17 |
Many of the highest-ranking states are in the Midwest and South. Michigan, Ohio, Wisconsin, and Iowa rank near the top, as do Louisiana, Mississippi, West Virginia, Kentucky, and Alabama.
Pennsylvania also ranks highly, with 66% of adult residents born in the state.
Western states generally rank much lower.
One of the leading reasons adults remain in their home communities is family: among those who never left, 35% cited staying near family as a main reason.
Half of States Are Below the 50% Mark
Across the U.S., nearly one in two adults lived in their birth state in 2024, amounting to 133.7 million American adults.
Beginning with Texas at 49.7%, 25 states and D.C. had shares below 50%.
The remaining 25 states were at or above that threshold, meaning the country is almost evenly split between states where a majority of adults were born locally and those where a majority were born elsewhere.
Reasons for moving to another state often include economic factors such as better job opportunities and more affordable living arrangements, along with lifestyle and social factors.
Nevada and Florida Stand Out for In-Migration
Nevada had the lowest share in the country, with just 17% of its adult residents born in-state.
Its unusually low share reflects Nevada’s long history of rapid population growth. Between 1970 and 2025, its population increased by 572%, the largest gain of any state over that period.
However, a low share does not measure current in-migration by itself. It reflects the cumulative composition of a state’s adult population, including decades of migration and population growth.
Florida also ranked near the bottom, at 25.8%. Despite having 18.9 million adult residents, only 4.9 million were born in Florida.
Other low-ranking states include Arizona at 29.5%, Colorado at 31.9%, and Alaska at 32.6%. These states have been shaped by factors including retirement migration, job-driven moves, and more recent periods of large-scale population growth compared with many states in the Midwest and South.
Learn More on the Voronoi App
If you enjoyed this post, check out Mapped: The Population of U.S. States Compared with Countries on Voronoi.
Misc
Ranked: The Best and Worst Countries for Women
From Denmark to Afghanistan, see how countries rank for women based on measures of security, justice, and inclusion.

Published
5 hours ago
on
August 23, 2026
Ranked: The Best and Worst Countries for Women
Key Takeaways:
- Denmark ranks first in the Women, Peace and Security Index with a score of 0.94, while Afghanistan ranks last at 0.28.
- All five of the top-ranked countries are Nordic, while Europe accounts for 25 of the 35 highest-scoring countries shown.
- Africa accounts for 23 of the 35 lowest-scoring countries shown.
The Women, Peace and Security Index from the Georgetown Institute for Women, Peace and Security ranks 181 countries based on 13 indicators spanning women’s inclusion, justice, and security. Scores range from zero (worst) to one (best).
The 2025/26 edition finds that global progress in women’s status is stagnating. This visualization shows the 35 countries at each end of the index, highlighting the geographic divide between many of the world’s highest and lowest performers.
The Best Countries for Women
The table below shows the 35 highest scores in the index.
| Rank | Country | Region | WPS Index Score |
|---|---|---|---|
| 1 | 🇩🇰 Denmark | Europe | 0.94 |
| 2 | 🇮🇸 Iceland | Europe | 0.93 |
| 3 | 🇳🇴 Norway | Europe | 0.92 |
| 4 | 🇸🇪 Sweden | Europe | 0.92 |
| 5 | 🇫🇮 Finland | Europe | 0.92 |
| 6 | 🇱🇺 Luxembourg | Europe | 0.92 |
| 7 | 🇧🇪 Belgium | Europe | 0.91 |
| 8 | 🇳🇱 Netherlands | Europe | 0.91 |
| 9 | 🇦🇹 Austria | Europe | 0.90 |
| 10 | 🇳🇿 New Zealand | Asia-Pacific | 0.90 |
| 11 | 🇦🇺 Australia | Asia-Pacific | 0.90 |
| 12 | 🇪🇪 Estonia | Europe | 0.90 |
| 13 | 🇮🇪 Ireland | Europe | 0.89 |
| 14 | 🇸🇮 Slovenia | Europe | 0.89 |
| 15 | 🇱🇹 Lithuania | Europe | 0.89 |
| 16 | 🇨🇦 Canada | North America | 0.89 |
| 17 | 🇱🇻 Latvia | Europe | 0.88 |
| 18 | 🇸🇬 Singapore | Asia-Pacific | 0.88 |
| 19 | 🇨🇭 Switzerland | Europe | 0.88 |
| 20 | 🇦🇪 UAE | Middle East | 0.87 |
| 21 | 🇩🇪 Germany | Europe | 0.87 |
| 22 | 🇯🇵 Japan | Asia-Pacific | 0.87 |
| 23 | 🇫🇷 France | Europe | 0.86 |
| 24 | 🇬🇧 United Kingdom | Europe | 0.86 |
| 25 | 🇪🇸 Spain | Europe | 0.86 |
| 26 | 🇵🇹 Portugal | Europe | 0.86 |
| 27 | 🇵🇱 Poland | Europe | 0.85 |
| 28 | 🇹🇼 Taiwan | Asia-Pacific | 0.85 |
| 29 | 🇷🇸 Serbia | Europe | 0.84 |
| 30 | 🇲🇹 Malta | Europe | 0.84 |
| 31 | 🇺🇸 United States | North America | 0.84 |
| 32 | 🇨🇿 Czechia | Europe | 0.83 |
| 33 | 🇭🇺 Hungary | Europe | 0.83 |
| 34 | 🇨🇷 Costa Rica | North America | 0.82 |
| 35 | 🇺🇾 Uruguay | South America | 0.82 |
Europe dominates the upper end of the index, accounting for 25 of the 35 highest-scoring countries shown. New Zealand and Australia are the highest-ranked countries outside Europe, with both scoring 0.90.
Nordic countries occupy all five of the top positions. Despite their strong overall performance, researchers have also examined a “Nordic paradox” in which high levels of gender equality coexist with comparatively high reported rates of intimate-partner violence.
Canada scores 0.89, while the United States ranks 31st overall at 0.84. These rankings offer another lens on the broader geographic differences in women’s well-being around the world.
The Worst Countries for Women
At the other end of the index, the following table shows the 35 lowest scores reported by the Georgetown Institute.
| Rank (Lowest) | Country | Region | WPS Index Score |
|---|---|---|---|
| 1 | 🇦🇫 Afghanistan | Asia-Pacific | 0.28 |
| 2 | 🇾🇪 Yemen | Middle East | 0.32 |
| 3 | 🇨🇫 Central African Republic | Africa | 0.36 |
| 4 | 🇸🇾 Syria | Middle East | 0.36 |
| 5 | 🇸🇩 Sudan | Africa | 0.40 |
| 6 | 🇭🇹 Haiti | North America | 0.40 |
| 7 | 🇨🇩 DRC | Africa | 0.41 |
| 8 | 🇧🇮 Burundi | Africa | 0.41 |
| 9 | 🇸🇸 South Sudan | Africa | 0.41 |
| 10 | 🇲🇲 Myanmar | Asia-Pacific | 0.44 |
| 11 | 🇨🇲 Cameroon | Africa | 0.45 |
| 12 | 🇸🇴 Somalia | Africa | 0.46 |
| 13 | 🇵🇰 Pakistan | Asia-Pacific | 0.46 |
| 14 | 🇲🇬 Madagascar | Africa | 0.47 |
| 15 | 🇵🇸 Palestine | Middle East | 0.47 |
| 16 | 🇲🇷 Mauritania | Africa | 0.48 |
| 17 | 🇹🇩 Chad | Africa | 0.48 |
| 18 | 🇲🇱 Mali | Africa | 0.48 |
| 19 | 🇳🇪 Niger | Africa | 0.49 |
| 20 | 🇳🇬 Nigeria | Africa | 0.50 |
| 21 | 🇵🇬 Papua New Guinea | Asia-Pacific | 0.51 |
| 22 | 🇧🇫 Burkina Faso | Africa | 0.51 |
| 23 | 🇬🇼 Guinea-Bissau | Africa | 0.51 |
| 24 | 🇮🇶 Iraq | Middle East | 0.51 |
| 25 | 🇱🇷 Liberia | Africa | 0.51 |
| 26 | 🇪🇹 Ethiopia | Africa | 0.52 |
| 27 | 🇧🇩 Bangladesh | Asia-Pacific | 0.53 |
| 28 | 🇬🇳 Guinea | Africa | 0.53 |
| 29 | 🇬🇲 Gambia | Africa | 0.53 |
| 30 | 🇰🇪 Kenya | Africa | 0.54 |
| 31 | 🇲🇿 Mozambique | Africa | 0.55 |
| 32 | 🇲🇼 Malawi | Africa | 0.55 |
| 33 | 🇨🇴 Colombia | South America | 0.55 |
| 34 | 🇸🇿 Eswatini | Africa | 0.56 |
| 35 | 🇲🇽 Mexico | North America | 0.56 |
Conflict-affected countries are heavily represented near the bottom of the index, including Afghanistan, Yemen, the Central African Republic, Syria, Sudan, and the Democratic Republic of the Congo.
Security is an important part of the index, which measures factors including proximity to armed conflict and political violence targeting women. Afghanistan illustrates how restrictions can extend well beyond physical security: recent reporting found that just 7% of Afghan women were employed, compared with 84% of men.
Africa accounts for roughly two-thirds of the 35 lowest-scoring countries shown. However, the index stresses that national outcomes are multidimensional, combining employment and education with legal discrimination, violence, and other measures. Women’s outcomes can also diverge significantly within countries and over time, with changing demographic trends.
Learn More on the Voronoi App
To explore another dimension of women’s economic participation around the world, see Which Countries Have the Most Women in the Workforce? on the Voronoi app.