Ranked: The Most Popular Subscription News Websites
While paywalls are becoming increasingly more popular among news websites, most consumers still aren’t willing to pay for their online news.
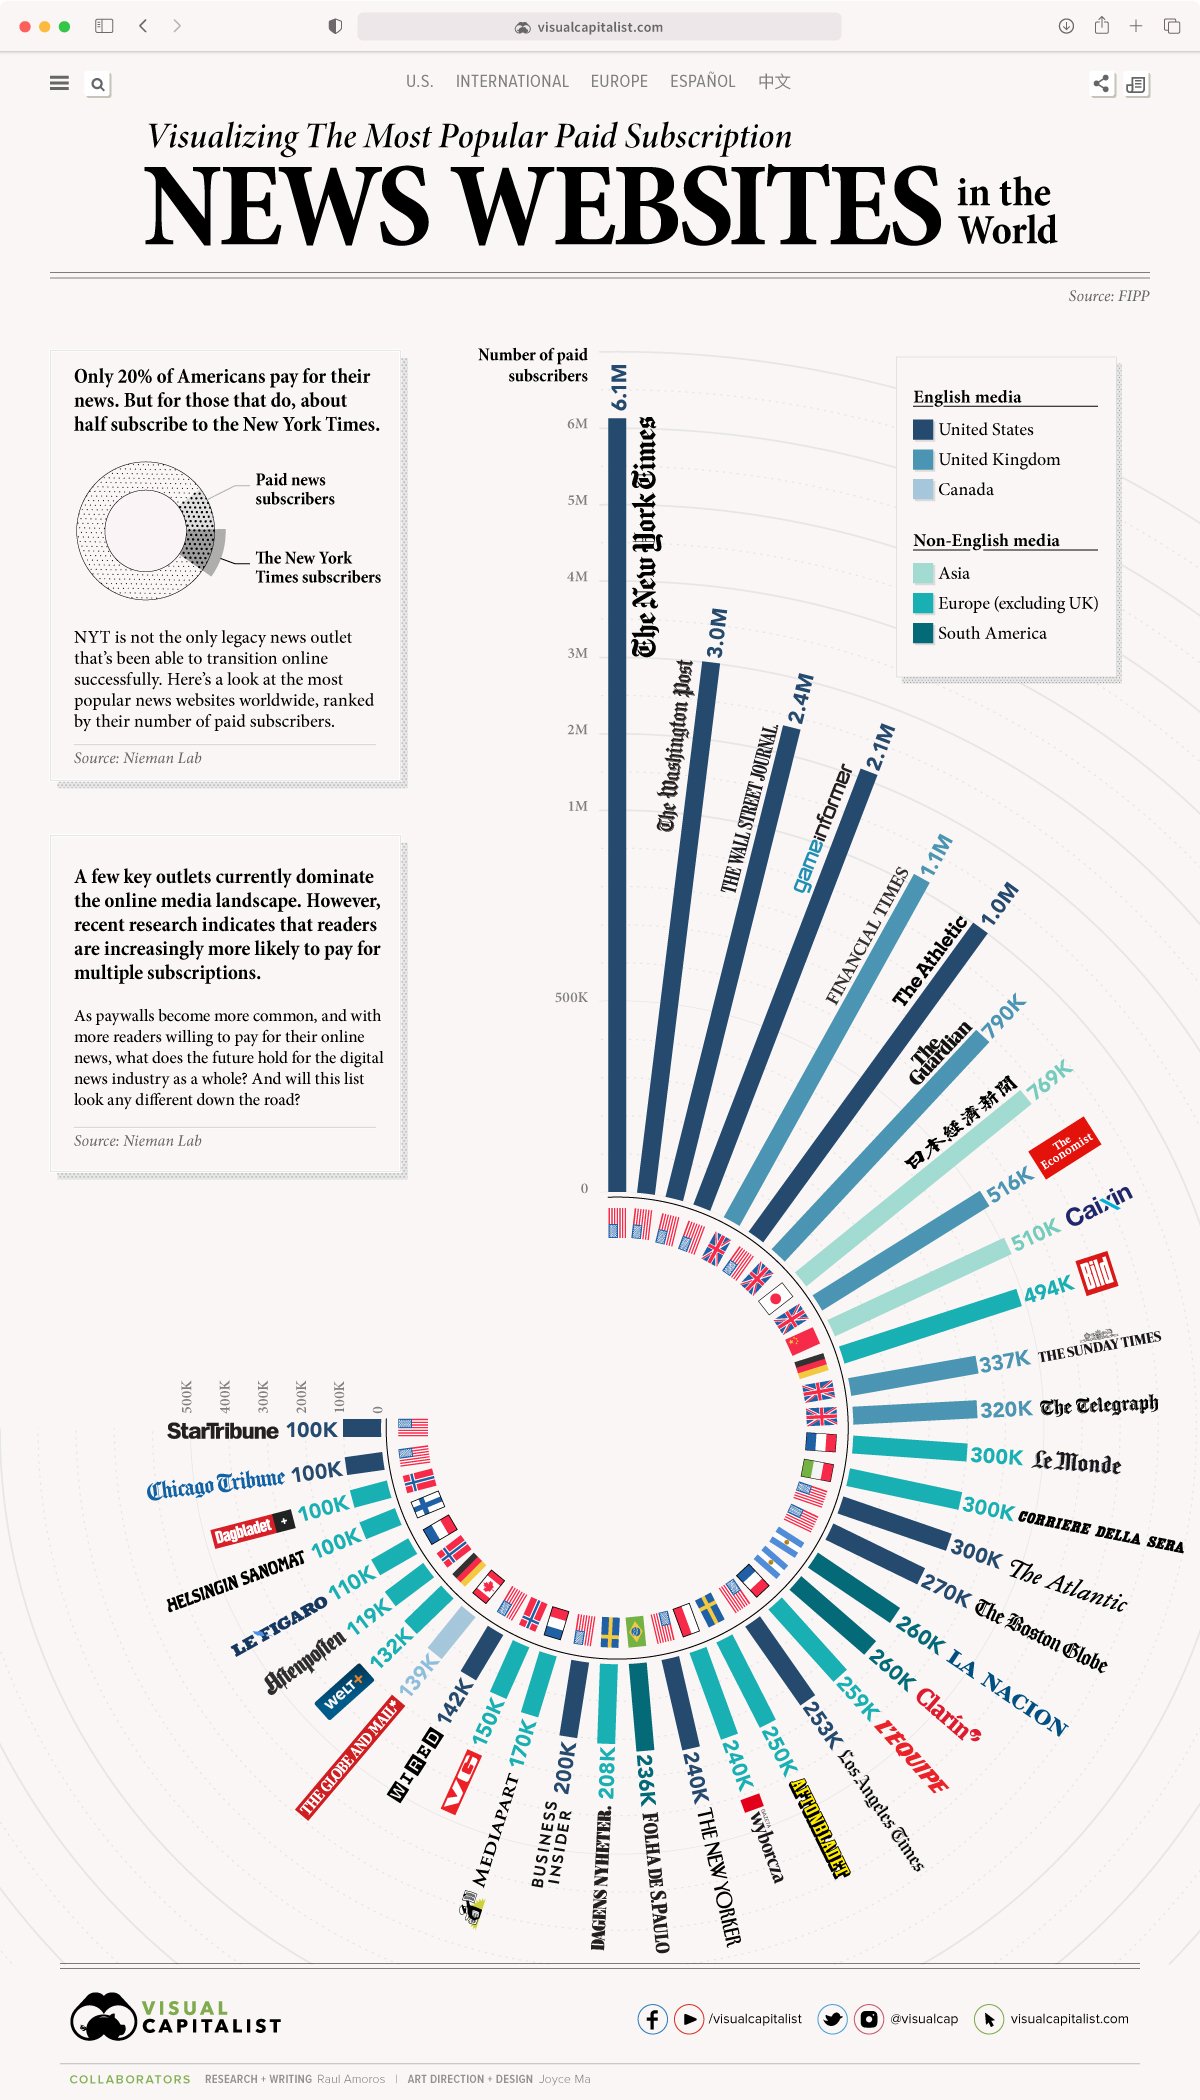
In fact, a recent survey by the Reuters Institute for the Study of Journalism reveals that only 20% of Americans pay for digital news, and of those that do, the majority subscribe to only one brand.
This begs the question—which news outlets are audiences willing to pay for?
Using data from FIPP and CeleraOne, this graphic looks at the most popular news websites across the globe, based on their total number of paid subscriptions.
*Note: This report relies on publicly available data, and should not be considered an exhaustive list.
The Full Breakdown
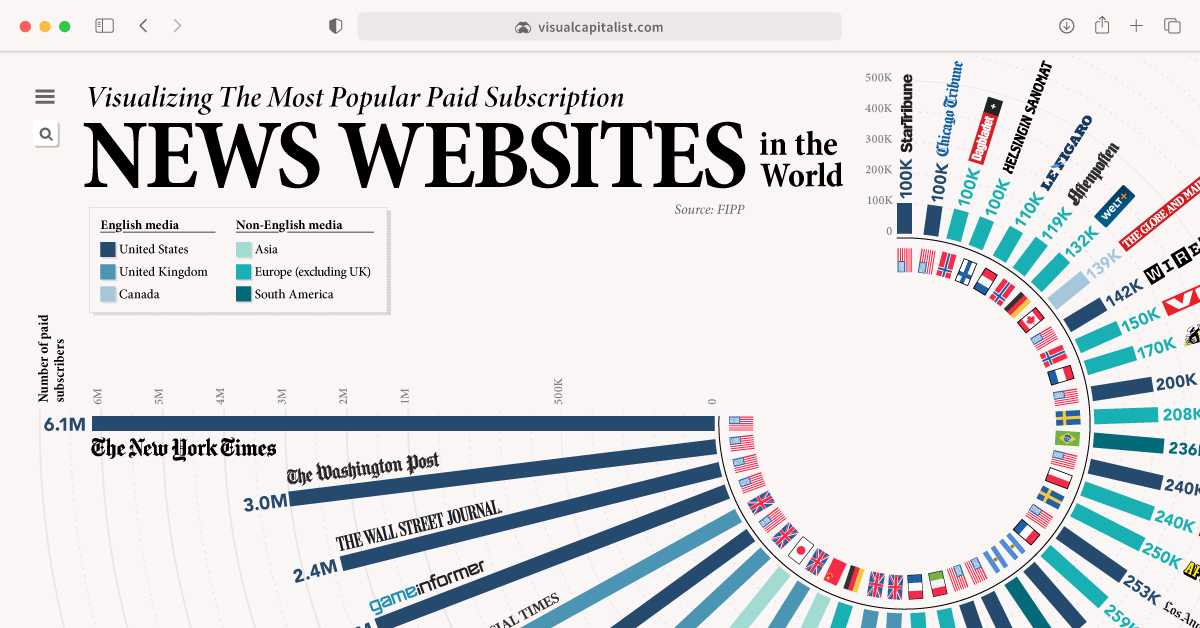
With 7.5 million subscriptions, The New York Times (NYT) takes the top spot on the list. 2020 was an exceptionally strong year for the outlet—by Q3 2020, the NYT had generated the same amount of revenue from digital subscriptions as it had for the entire year of 2019.
| Rank | Publication | Paid Subscriptions |
|---|---|---|
| 1 | 🇺🇸 The New York Times | 6,100,000 |
| 2 | 🇺🇸 The Washington Post | 3,000,000 |
| 3 | 🇺🇸 The Wall Street Journal | 2,400,000 |
| 4 | 🇺🇸 Game Informer | 2,100,000 |
| 5 | 🇬🇧 Financial Times | 1,100,000 |
| 6 | 🇺🇸 The Athletic | 1,000,000 |
| 7 | 🇬🇧 The Guardian | 790,000 |
| 8 | 🇯🇵 Nikkei | 769,000 |
| 9 | 🇬🇧 The Economist | 516,000 |
| 10 | 🇨🇳 Caixin | 510,000 |
| 11 | 🇩🇪 Bild | 494,000 |
| 12 | 🇬🇧 The Sunday Times | 337,000 |
| 13 | 🇬🇧 The Telegraph | 320,000 |
| 14 | 🇺🇸 The Atlantic | 300,000 |
| 15 | 🇮🇹 Corriere Della Sera | 300,000 |
| 16 | 🇫🇷 Le Monde | 300,000 |
| 17 | 🇺🇸 The Boston Globe | 270,000 |
| 18 | 🇦🇷 La Nacion | 260,000 |
| 19 | 🇦🇷 Clarin | 260,000 |
| 20 | 🇫🇷 L'equipe | 259,000 |
| 21 | 🇺🇸 Los Angeles Times | 253,000 |
| 22 | 🇸🇪 Aftonbladet | 250,000 |
| 23 | 🇺🇸 The New Yorker | 240,000 |
| 24 | 🇵🇱 Wyborcza | 240,000 |
| 25 | 🇧🇷 Folha de S.Paulo | 236,000 |
| 26 | 🇸🇪 Dagens Nyheter | 208,000 |
| 27 | 🇺🇸 Business Insider | 200,000 |
| 28 | 🇫🇷 Mediapart | 170,000 |
| 29 | 🇳🇴 VG | 150,000 |
| 30 | 🇺🇸 Wired | 142,000 |
| 31 | 🇨🇦 The Globe and Mail | 139,000 |
| 32 | 🇩🇪 Welt | 132,000 |
| 33 | 🇳🇴 Aftenposten | 119,000 |
| 34 | 🇫🇷 Le Figaro | 110,000 |
| 35 | 🇺🇸 Chicago Tribune | 100,000 |
| 36 | 🇺🇸 Star Tribune | 100,000 |
| 37 | 🇳🇴 Dagbladet | 100,000 |
| 38 | 🇫🇮 Helsingin Sanomat | 100,000 |
The Times is the most popular by a landslide—it has over double the number of subscriptions than the second outlet on the list, The Washington Post. Yet, while WaPo is no match for NYT, it still boasts a strong following, with approximately 3 million paid subscriptions as of Q4 2020.
Japanese outlet Nikkei ranks number one among the non-English news websites. It’s the largest business newspaper in Japan, mainly focusing on markets and finance, but also covering politics, sports, and health.
Legacy Papers: Which Websites Come From Traditional Media?
Most of the websites on this list stem from traditional media. Because of this, they’ve had years to establish themselves as trusted sources, and win over loyal readers.
Interestingly, more than half of the outlets included in this ranking are at least 100 years old.
| Publication | Year Launched | Age (Years) |
|---|---|---|
| 🇬🇧 The Guardian | 1821 | 200 |
| 🇬🇧 The Sunday Times | 1821 | 200 |
| 🇫🇷 Le Figaro | 1826 | 195 |
| 🇸🇪 Aftonbladet | 1830 | 190 |
| 🇬🇧 The Economist | 1843 | 178 |
| 🇺🇸 Chicago Tribune | 1847 | 173 |
| 🇺🇸 NYT | 1852 | 169 |
| 🇬🇧 The Telegraph | 1855 | 166 |
| 🇺🇸 The Atlantic | 1857 | 164 |
| 🇳🇴 Aftenposten | 1860 | 160 |
| 🇸🇪 Dagens Nyheter | 1864 | 157 |
| 🇺🇸 Star Tribune | 1867 | 154 |
| 🇳🇴 Dagbladet | 1869 | 152 |
| 🇦🇷 La Nacion | 1870 | 151 |
| 🇺🇸 The Boston Globe | 1872 | 149 |
| 🇮🇹 Corriere Della Sera | 1876 | 145 |
| 🇺🇸 Washington Post | 1877 | 144 |
| 🇯🇵 Nikkei.com | 1876 | 144 |
| 🇺🇸 LA Times | 1881 | 140 |
| 🇬🇧 Financial Times | 1888 | 133 |
| 🇺🇸 Wall Street Journal | 1889 | 132 |
| 🇫🇮 Helsingin Sanomat | 1889 | 132 |
| 🇧🇷 Folha de S.Paulo | 1921 | 100 |
| 🇺🇸 The New Yorker | 1925 | 96 |
| 🇨🇦 The Globe and Mail | 1936 | 85 |
| 🇫🇷 Le Monde | 1944 | 77 |
| 🇦🇷 Clarin | 1945 | 76 |
| 🇳🇴 VG | 1945 | 76 |
| 🇫🇷 L'equipe | 1946 | 75 |
| 🇩🇪 Welt | 1946 | 75 |
| 🇩🇪 Bild | 1952 | 69 |
| 🇵🇱 Wyborcza | 1989 | 32 |
| 🇺🇸 Game Informer | 1991 | 30 |
| 🇺🇸 Wired | 1993 | 28 |
| 🇺🇸 Business Insider | 2007 | 14 |
| 🇫🇷 Mediapart | 2008 | 13 |
| 🇨🇳 Caixin | 2009 | 12 |
| 🇺🇸 The Athletic | 2016 | 5 |
Yet, undeterred by these well-established outlets, a few scrappy websites made the cut despite a shorter history. Four out of the 38 websites are less than 20 years old.
The Athletic is the newest outlet to make the ranking. Established in 2016, the outlet’s target demographic is die-hard sports fans who miss the days of in-depth, quality sports writing.
The Need For Trusted Sources
Amidst the global pandemic, issues involving misinformation and fake news have helped reaffirm the important role that trusted news sources play in the dissemination of public information.
With this in mind, it’ll be interesting to see what the future holds for digital media consumption. With paywalls becoming increasingly more common, will consumers jump on board and eventually be more willing to pay for their news?
Culture
Ranked: The Most Common Website Languages on the Internet
Dive into this chart, which shows the most common languages used for URLs versus their native speaking populations.
Published
8 hours ago
on
March 14, 2026

The Most Common Website Languages on the Internet
See visuals like this from many other data creators on our Voronoi app. Download it for free on iOS or Android and discover incredible data-driven charts from a variety of trusted sources.
Key Takeaways
- English is the most common language used in URLs, accounting for 45% of websites.
- Chinese has the largest share of native speakers globally, but represents only 5% of URLs.
- Most of the world’s languages fall under “other,” meaning they have very limited representation online.
English has become the de facto language of the internet, with a far greater presence online than any other language.
However, the most common languages on the web don’t necessarily reflect the number of people who speak them natively.
This graphic visualizes the most commonly used languages for URLs compared with their share of native speakers worldwide, based on 2025 data from Ethnologue via both the World Bank and Britannica.
English is the Most Common URL Language
Dive into the data below:
| Language | Share of global URLs | Native speakers share of population |
|---|---|---|
| English | 45% | 4.6% |
| German | 7% | 0.9% |
| Russian | 6% | 1.8% |
| Chinese | 5% | 16.3% |
| Japanese | 5% | 1.5% |
| Spanish | 4% | 5.9% |
| French | 4% | 1.0% |
| Other languages | 21% | 68.1% |
| Unknown | 3% | NA |
German comes in second place, making up 7% of URLs, despite having the smallest share of native speakers among the languages listed in the data. Just 0.9% of people speak it natively. In addition to Germany, the language is spoken in Austria, Switzerland, and some areas of Italy and other neighboring European countries.
Some 6% of URLs are written in Russian, while 1.8% of the population speaks it natively, largely concentrated in former Soviet Union countries.
Interestingly, Chinese is one of the most widely spoken languages in the world, with 16.3% of the global population speaking it natively (primarily Mandarin). However, just 5% of URLs are written in the language.
Spanish is also underrepresented relative to its native-speaking population, accounting for 4% of URLs compared with 5.9% of global native speakers.
Some 21% of URLs fall under “other,” meaning many languages appear on only a small number of websites. Outside of the languages listed above, along with Japanese and French, other mother tongues make up 68.1% of the global population.
Creating a Multilingual Internet
The lack of languages online can isolate or limit those who don’t speak English, German, Russian, or other common languages. This is particularly problematic for Indigenous communities, whose culture is often flattened by technology.
There are efforts to increase representation as a form of digital inclusion. For example, the foundation that runs Wikipedia launched a page translator to help build up a non-English catalogue back in 2015, while UNESCO and the Internet Corporation for Assigned Names and Numbers (ICANN) are working to increase linguistic diversity in hopes of creating a more multilingual internet.
This dataset looks at the language of URLs, which can indicate the origin of a webpage. When looking at languages of the pages themselves, the data shifts slightly to include languages such as Turkish and Persian.
Learn More on the Voronoi App 
To learn more about languages online, check out this graphic which charts the digital divide.
Technology
Ranked: The 15 Countries With the Most Supercomputers
From the U.S. and China to Singapore, dive in to which countries have the most supercomputers.
Published
1 week ago
on
March 4, 2026

Ranked: The Countries With the Most Supercomputers
See visuals like this from many other data creators on our Voronoi app. Download it for free on iOS or Android and discover incredible data-driven charts from a variety of trusted sources.
Key Takeaways
- The U.S. has 171 supercomputers, four times more than the next country, Japan, which has 43.
- China is tied for third alongside Germany, both with 40 supercomputers.
Supercomputers are used for everything from weather forecasting and high-powered simulations to artificial intelligence and defense.
The number of supercomputers a country has gives an indication of their technological and economic positioning, and how they prioritize frontier research.
This graphic ranks the countries with the most supercomputers, and the data comes from TOP500’s November 2025 list.
Which Countries Have the Most Supercomputers?
The U.S., the birthplace of supercomputers, dominates the list at 171. The figure is four times higher the number of supercomputers Japan has, which comes in second place at 43.
The data table below shows the number of supercomputers per country as of November 2025:
| Country | Supercomputers |
|---|---|
| 🇺🇸 United States | 171 |
| 🇯🇵 Japan | 43 |
| 🇩🇪 Germany | 40 |
| 🇨🇳 China | 40 |
| 🇫🇷 France | 23 |
| 🇨🇦 Canada | 19 |
| 🇮🇹 Italy | 18 |
| 🇰🇷 South Korea | 15 |
| 🇹🇼 Taiwan | 10 |
| 🇧🇷 Brazil | 10 |
| 🇳🇴 Norway | 9 |
| 🇬🇧 United Kingdom | 9 |
| 🇸🇪 Sweden | 8 |
| 🇵🇱 Poland | 8 |
| 🇳🇱 Netherlands | 7 |
| 🇸🇦 Saudi Arabia | 7 |
| 🇮🇳 India | 6 |
| 🇸🇬 Singapore | 5 |
| 🇦🇪 United Arab Emirates | 5 |
| 🇷🇺 Russia | 5 |
| 🇦🇺 Australia | 4 |
| 🇫🇮 Finland | 3 |
| 🇨🇭 Switzerland | 3 |
| 🇮🇱 Israel | 3 |
| 🇨🇿 Czechia | 3 |
| 🇪🇸 Spain | 3 |
| 🇸🇮 Slovenia | 2 |
| 🇮🇪 Ireland | 2 |
| 🇦🇹 Austria | 2 |
| 🇰🇿 Kazakhstan | 2 |
| 🇹🇭 Thailand | 2 |
| 🇹🇷 Turkey | 2 |
| 🇮🇸 Iceland | 1 |
| 🇱🇺 Luxembourg | 1 |
| 🇸🇰 Slovakia | 1 |
| 🇩🇰 Denmark | 1 |
| 🇧🇬 Bulgaria | 1 |
| 🇭🇺 Hungary | 1 |
| 🇵🇹 Portugal | 1 |
| 🇧🇪 Belgium | 1 |
| 🇲🇦 Morocco | 1 |
| 🇦🇷 Argentina | 1 |
| 🇻🇳 Vietnam | 1 |
China and Germany trail closely, tied in third and fourth place at 40 supercomputers.
The ranking is significantly top-heavy, as the top three countries have more supercomputers than all the other 43 countries combined. In total, 26 countries have five or fewer supercomputers each, while 11 have just one supercomputer.
It is not necessarily smaller countries that have fewer supercomputers. Singapore, for example, has the same number as Russia and India at five. The Singaporean government recently launched a supercomputing hub as it looks to become Southeast Asia’s AI leader.
Increasing AI-Driven Supercomputer Demand
Demand for supercomputers is increasing alongside AI, which requires massive computational power to be trained and run, which far surpass what regular computers are capable of.
There are different types of supercomputers but generally they can crunch vast and complex datasets at speed, far surpassing humanity’s capabilities. By outputting useful information, supercomputers are used to make decisions across health, climate, and material science, which is why they are tipped to hold the key to some of society’s greatest challenges.
Nordic countries actually share access to their supercomputers in efforts to “enable excellence” and contribute towards the UN’s sustainable Development Goals.
The Finland-based LUMI supercomputer, the ninth most powerful in the world, was set up specifically with this in mind; it is hosted by a consortium of 10 countries, including the Nordics and their neighbor Estonia, to share resources and increase researcher access to some of the world’s most powerful computers.
The EU-funded RAISE center was set to develop novel AI technologies that can run effectively on supercomputers, while the U.S. is ramping up partnerships with AI companies to stack its national labs with powerful compute clusters.
Learn More on the Voronoi App
To learn more about supercomputers, check out this graphic on Voronoi which breaks down the largest computing clusters.