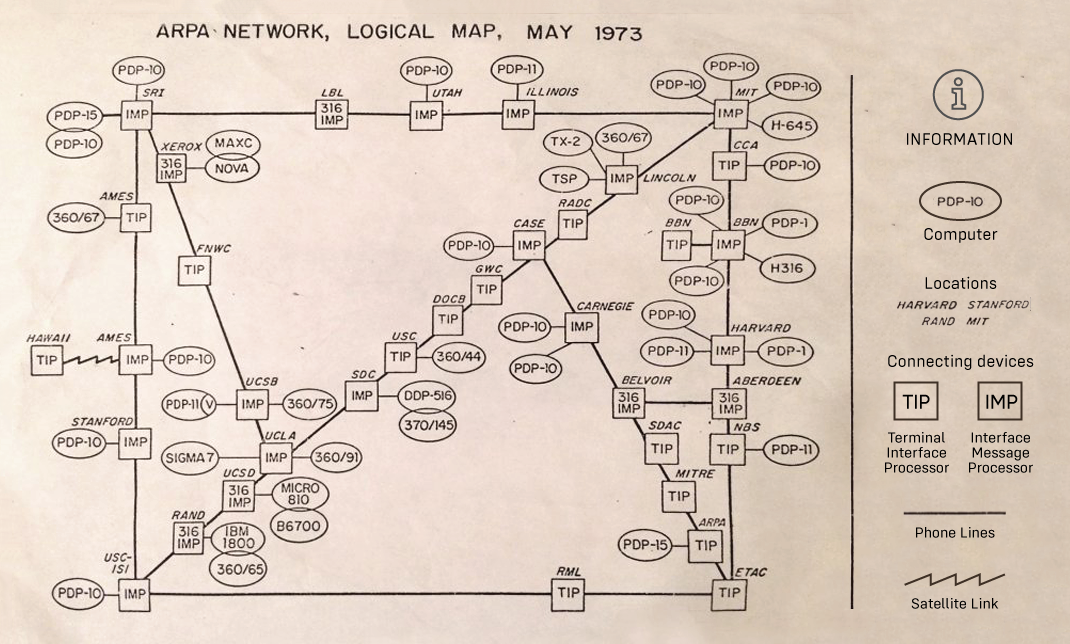
This Map Shows the Extent of the Entire Internet in 1973
Before the modern internet, there was ARPANET.
ARPANET was the first internet-like network, and it was developed to allow multiple computers to share data across vast geographical distances. Interestingly, the researchers that worked on ARPANET are credited with developing many of the communication protocols that the internet still uses today.
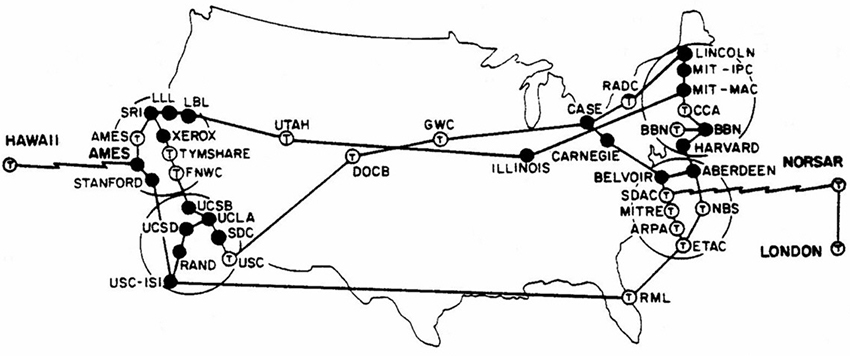
Today’s map comes from David Newbury, who shared a keepsake from his father’s time as a computer science business manager at Carnegie Mellon University in the 1970s. We added a legend to help explain the symbols on the map.
A Brief History of ARPANET
ARPANET was funded in the late 1960s by a branch of the U.S. Military called The Advanced Research Projects Agency (ARPA), with the original purpose being to allow researchers at different universities to use their limited computing resources more efficiently.
Before ARPANET, if a researcher at Harvard wanted to access a database at Stanford, they had to travel there and use it in person. ARPANET was used to test out a new communication technology known as packet-switching, which broke up data into smaller “packets” and allowed various computers on the network to access the data.
With ARPANET researchers could:
- Login to another computer miles away
- Transfer and save files across the network
- Send emails from one person to several others
On the map above, you can see the network only had computers in the United States, but later that same year, a satellite link connected the ARPANET to Norway, creating the beginnings of a global network.
A Network of Networks
In 1983, ARPANET adopted the TCP/IP protocol standards which paved the way for a “network of networks”, and the internet was born. Several years later, ARPANET would be decommissioned and the new internet would begin to flourish.
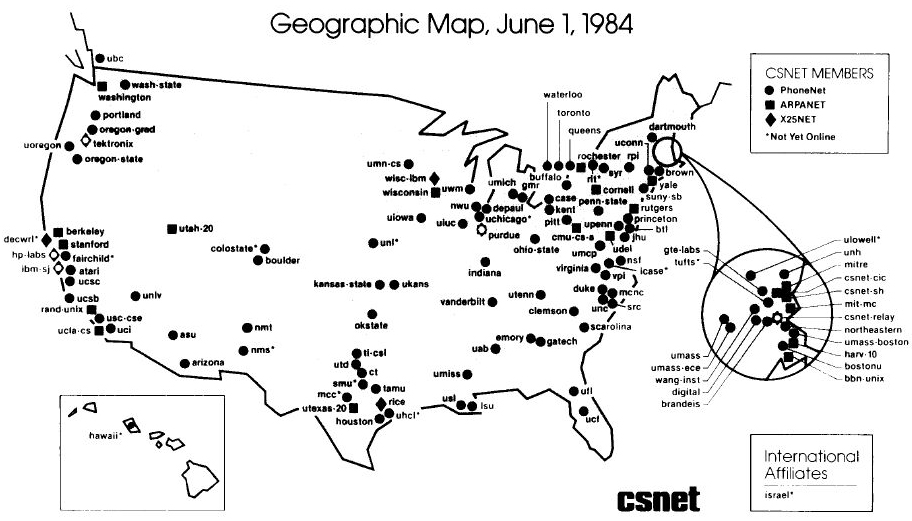
Below you can see what the early internet looked like in 1984:
A Big Jump
These maps take us back to a simpler time when social networks, mobile phones, and unlimited access to the world’s information did not yet exist. Even 12 years after the first message was transmitted on the ARPANET, there were still only 213 computers on the network.
Fast forward a few decades later and the change in scale is mind-boggling – the modern internet has 1.94 billion websites and 4.1 billion internet users globally, resembling a digital universe.
One can only imagine how quaint the ARPANET will look a few more decades from now.
An earlier version of this article said the ARPANET was first connected internationally to the United Kingdom, but in fact, it was with Norway.
Technology
Ranked: The Most Popular AI Tools in 2026
ChatGPT drew 5.3 billion web visits in June 2026, more than the next 14 AI tools combined. See the ranking of the world’s most popular AI tools in 2026.

Published
7 days ago
on
August 18, 2026

Ranked: The Most Popular AI Tools in 2026
Key Takeaways
- ChatGPT drew 5.3 billion web visits in June 2026, more than the next 14 most popular AI tools combined (4.7 billion).
- Google’s Gemini ranks second at 1.1 billion monthly visits, followed by Anthropic’s Claude at 968 million.
- 12 of the 15 most-visited AI tools are American. Canva (Australia), DeepSeek (China), and Magnific (Spain) are the only exceptions.
Less than four years after ChatGPT’s launch, AI tools have become some of the most visited destinations on the internet.
But while new tools launch constantly in a crowded market, web traffic remains highly concentrated among the biggest players.
This graphic ranks the world’s 15 most popular AI tools by monthly web visits in June 2026 using data from AITools.xyz, modeled on SEMrush and Ahrefs traffic data. Figures count website visits only, so mobile-app and API usage are not included.
ChatGPT Pulls More Traffic Than the Next 14 Tools Combined
ChatGPT accounts for roughly 53% of all web traffic among the 15 tools in the ranking, highlighting how far ahead it remains of its closest competitors.
The table below shows the 15 most popular AI tools by monthly web visits in June 2026, along with each tool’s home country:
| Rank | AI Tool | Country | Monthly Web Visits (June 2026) |
|---|---|---|---|
| 1 | ChatGPT | 🇺🇸 United States | 5,320,000,000 |
| 2 | Gemini | 🇺🇸 United States | 1,140,000,000 |
| 3 | Claude | 🇺🇸 United States | 967,910,000 |
| 4 | Canva | 🇦🇺 Australia | 759,760,000 |
| 5 | Google Translate | 🇺🇸 United States | 343,020,000 |
| 6 | DeepSeek | 🇨🇳 China | 318,810,000 |
| 7 | Grok | 🇺🇸 United States | 189,890,000 |
| 8 | JanitorAI | 🇺🇸 United States | 173,170,000 |
| 9 | Character AI | 🇺🇸 United States | 165,460,000 |
| 10 | Perplexity | 🇺🇸 United States | 140,700,000 |
| 11 | Magnific (Freepik) | 🇪🇸 Spain | 116,840,000 |
| 12 | Notion | 🇺🇸 United States | 110,640,000 |
| 13 | Zoom | 🇺🇸 United States | 96,240,000 |
| 14 | Microsoft Copilot | 🇺🇸 United States | 92,720,000 |
| 15 | Suno | 🇺🇸 United States | 81,840,000 |
The ranking is overwhelmingly American, with 12 of the 15 tools based in the United States.
The exceptions are Canva (760 million visits), the Australian design platform that has rebuilt itself around AI features, China’s DeepSeek (319 million), and Magnific (117 million), the AI image upscaler from Spain’s Freepik.
Character chat is another notable source of traffic. JanitorAI (173 million) and Character AI (165 million) draw roughly 339 million monthly visits together, more than Perplexity and Microsoft Copilot combined. That puts character-based AI among the largest consumer use cases outside the leading general-purpose assistants.
Google’s Distribution Machine Still Trails a Startup
Google is the only company with two tools in the ranking, with Gemini drawing 1.1 billion visits and Google Translate another 343 million. Together, they still attract less than a third of ChatGPT’s traffic.
That’s a striking gap for a company that owns the world’s dominant search engine, browser, and mobile operating system. Microsoft faces a similar challenge, with Copilot drawing just 93 million web visits. However, that figure doesn’t include usage built into Windows and Office.
ChatGPT also had an early advantage in building consumer awareness. It broke into the ranks of the world’s most visited websites in early 2024, barely a year after launch. Meanwhile, OpenAI, Google, xAI, and Anthropic regularly trade places in the race for the smartest AI models, but those shifts haven’t translated directly into web traffic.
Learn More on the Voronoi App
If you enjoyed today’s post, check out Global AI Adoption by country on Voronoi.
Technology
Ranked: Where the iPhone Costs the Most in 2026
The same iPhone can cost more than twice as much depending on where you buy it. See the world’s most expensive markets.

Published
3 weeks ago
on
August 1, 2026

Ranked: Where the iPhone Costs the Most in 2026
Key Takeaways
- Türkiye is the world’s most expensive place to buy an iPhone 17 Pro (256GB), with a retail price of $2,592.
- The same model costs more than twice as much in Türkiye as it does in Japan, the cheapest market in the comparison.
- Taxes, import duties, currency movements, and local regulations can add hundreds of dollars to an iPhone’s retail price.
Apple sells the same flagship smartphone worldwide, but its retail price varies significantly by market.
This graphic compares the price of Apple’s iPhone 17 Pro (256GB) across 41 markets in 2026 using data from Deutsche Bank.
The World’s Most Expensive Place to Buy an iPhone
Türkiye tops the ranking at $2,592, more than $1,400 above the U.S. price of $1,181. Brazil ranks second at $2,260, while Egypt follows at $1,872.
At the other end of the ranking, Japan has the lowest price in the comparison at $1,121, slightly below U.S. pricing. The wide gap shows how taxes, import policies, and local market conditions can outweigh the global pricing strategy of one of the world’s leading smartphone brands.
| Rank | Country | iPhone 17 Pro 256GB (USD) | Price relative to the U.S. |
|---|---|---|---|
| 1 | 🇹🇷 Türkiye | $2,592 | 219% |
| 2 | 🇧🇷 Brazil | $2,260 | 191% |
| 3 | 🇪🇬 Egypt | $1,872 | 158% |
| 4 | 🇭🇺 Hungary | $1,826 | 155% |
| 5 | 🇳🇴 Norway | $1,687 | 143% |
| 6 | 🇲🇽 Mexico | $1,657 | 140% |
| 7 | 🇸🇪 Sweden | $1,601 | 135% |
| 8 | 🇵🇱 Poland | $1,588 | 134% |
| 9 | 🇨🇿 Czechia | $1,585 | 134% |
| 10 | 🇫🇮 Finland | $1,578 | 134% |
| 11 | 🇵🇹 Portugal | $1,566 | 133% |
| 12 | 🇬🇷 Greece | $1,566 | 133% |
| 13 | 🇮🇹 Italy | $1,554 | 132% |
| 14 | 🇮🇪 Ireland | $1,554 | 132% |
| 15 | 🇩🇰 Denmark | $1,553 | 131% |
| 16 | 🇫🇷 France | $1,543 | 131% |
| 17 | 🇳🇱 Netherlands | $1,543 | 131% |
| 18 | 🇧🇪 Belgium | $1,543 | 131% |
| 19 | 🇪🇸 Spain | $1,531 | 130% |
| 20 | 🇦🇹 Austria | $1,508 | 128% |
| 21 | 🇩🇪 Germany | $1,508 | 128% |
| 22 | 🇱🇺 Luxembourg | $1,492 | 126% |
| 23 | 🇬🇧 UK | $1,476 | 125% |
| 24 | 🇮🇳 India | $1,427 | 121% |
| 25 | 🇦🇺 Australia | $1,413 | 120% |
| 26 | 🇸🇦 Saudi Arabia | $1,386 | 117% |
| 27 | 🇨🇭 Switzerland | $1,385 | 117% |
| 28 | 🇳🇿 New Zealand | $1,370 | 116% |
| 29 | 🇸🇬 Singapore | $1,364 | 115% |
| 30 | 🇲🇾 Malaysia | $1,352 | 114% |
| 31 | 🇹🇭 Thailand | $1,350 | 114% |
| 32 | 🇨🇳 China | $1,332 | 113% |
| 33 | 🇻🇳 Vietnam | $1,330 | 113% |
| 34 | 🇵🇭 Philippines | $1,326 | 112% |
| 35 | 🇨🇦 Canada | $1,291 | 109% |
| 36 | 🇦🇪 UAE | $1,279 | 108% |
| 37 | 🇹🇼 Taiwan | $1,264 | 107% |
| 38 | 🇭🇰 Hong Kong | $1,200 | 102% |
| 39 | 🇺🇸 United States | $1,181 | 100% |
| 40 | 🇰🇷 South Korea | $1,181 | 100% |
| 41 | 🇯🇵 Japan | $1,121 | 95% |
Europe accounts for much of the ranking’s upper half, partly because advertised prices include value-added tax (VAT). Standard VAT rates range from 27% in Hungary to just over 8% in Switzerland, contributing to substantial differences in final retail prices.
Why Do iPhone Prices Vary So Much?
Apple establishes regional prices, but governments also play a major role in determining what consumers pay.
Import duties, regulatory fees, and device-specific taxes can significantly increase the retail price of electronics. Currency movements also affect local pricing, particularly when domestic currencies weaken against the U.S. dollar.
Türkiye is the clearest outlier. In addition to a 20% VAT, smartphones are subject to special consumption taxes and registration fees that sharply increase their retail prices.
Why Japan Is One of the Cheapest Markets
Japan is one of the few markets where Apple’s flagship iPhone costs less than it does in the United States.
A relatively low 10% consumption tax, a highly competitive smartphone market, and Apple’s long-standing pricing strategy have helped keep prices comparatively low. Even so, Apple has recently raised prices on some products in Japan following years of yen weakness and shifting exchange rates.
Global price rankings can change quickly. As currencies fluctuate and governments adjust taxes and import policies, today’s cheapest market may not hold that position for long.
Learn More on the Voronoi App 
To learn more about this topic, check out this graphic on how Apple makes its money.