The Median Age of the Population in Every Country
View the full-size version of the infographic by clicking here
With a few notable exceptions, the world is rapidly aging.
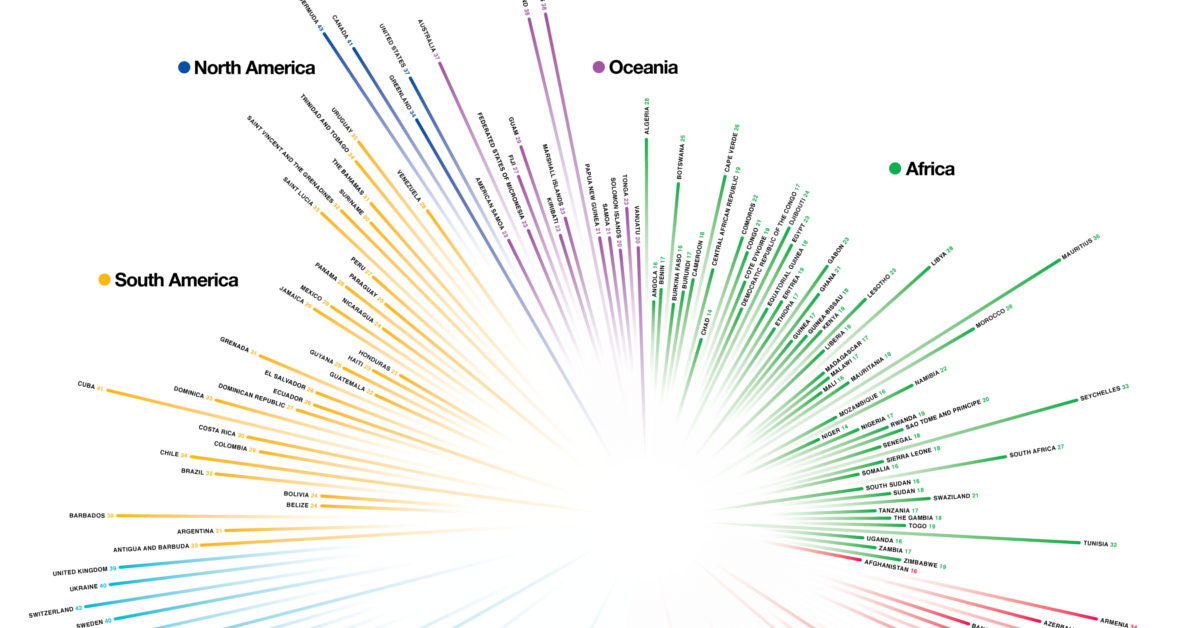
Today’s infographic, which was shared by Bill Gates on Reddit, shows this incredible explosion in age and how different countries contrast with one another on this demographic metric.
While aging populations in Europe, North America, and Asia stand out on this type of visualization, it’s also important to look at the negative space. In both South America and Africa, populations are still quite young, with Africa getting younger and younger.
Note: The infographic is grouped based on U.N. regional classifications, and lumps Central America, the Caribbean, and South America as one demographic region.
The Oldest Countries
Which countries are the outliers in terms of global demographics?
Let’s start by taking a look at the oldest countries in terms of median age.
| Rank | Country | Median Age | Region |
|---|---|---|---|
| #1 | Japan | 47 years | Asia |
| #2 (t) | Germany | 45 years | Europe |
| #2 (t) | Italy | 45 years | Europe |
| #4 (t) | Greece | 44 years | Europe |
| #4 (t) | Bulgaria | 44 years | Europe |
| #4 (t) | Portugal | 44 years | Europe |
Japan takes the cake for the oldest population and it’s joined by a host of European nations.
The following countries tied for the #7 spot, which is just off of the above list: Austria, Croatia, Latvia, Lithuania, Slovenia, Spain, and Bermuda. All of these places had median ages of 43 years, with Bermuda being the only non-European state of this group.
It’s worth noting that some smaller countries appear to be excluded from Gates’ infographic. As we showed on our last chart covering the subject of median age, which uses a different data set, the small city-state of Monaco (which has a population of just 39,000 people) actually has the highest median age in the world at 53.1 years.
The Youngest Countries
Now, let’s take a peek at the world’s youngest countries in terms of median age.
| Rank | Country | Median Age | Region |
|---|---|---|---|
| #1 (t) | Chad | 14 years | Africa |
| #1 (t) | Niger | 14 years | Africa |
| #3 (t) | Afghanistan | 16 years | Middle East |
| #3 (t) | Angola | 16 years | Africa |
| #3 (t) | Burkina Faso | 16 years | Africa |
| #3 (t) | Mali | 16 years | Africa |
| #3 (t) | Somalia | 16 years | Africa |
| #3 (t) | South Sudan | 16 years | Africa |
| #3 (t) | Uganda | 16 years | Africa |
The youngest countries globally are Chad and Niger with a median population age of 14 years. Both are located in Sub-Saharan Africa.
The only non-African country is war-torn Afghanistan, where the median age is 16 years.
A variety of countries tied with a median age of 17 years old, which puts them just off of the above list. Those countries include: Benin, Burundi, Ethiopia, Madagascar, Malawi, Nigeria, Tanzania, Zambia, Yemen, and Timor-Leste.
More Context on Aging
Want to get an even better idea of what the world looks like as it ages?
To get a sense of change over the coming decades, it’s worth taking a look at this animation that shows median age projections with a focus on Western countries all the way until the year 2060.
Maps
Ranked: America’s Best-Value Public Universities in 2026
America’s best-value public universities in 2026 combine low attendance costs with strong graduation rates and graduate earnings.

Published
5 hours ago
on
August 24, 2026

Ranked: America’s Best-Value Public Universities in 2026
Key Takeaways
- The University of Florida ranks first among America’s best-value public universities, combining a 91% graduation rate with median earnings of nearly $72,000 10 years after enrollment.
- California, New York, and Florida account for 14 of the 20 schools on the list.
- New Mexico Institute of Mining and Technology ranks fifth, with median earnings of $76,489, the highest of any school on the list.
This visualization ranks 20 U.S. public colleges and universities that pair below-median attendance costs with relatively strong student outcomes.
The data for this visualization comes from SmartAsset, which evaluated more than 500 public colleges and universities using data published in March 2026.
Cost of attendance was used as an eligibility filter rather than as part of the final composite score. SmartAsset calculated the median cost of attendance among qualifying public bachelor’s degree-granting institutions and only considered schools below that threshold.
Eligible institutions were then ranked using a composite score based on two outcomes: graduation rate and the median earnings of students 10 years after first enrollment.
Cost of attendance includes tuition, books, fees, and living expenses for full-time undergraduates.
Florida Leads the Ranking
The University of Florida ranks first overall, with a cost of attendance of $22,523, a 91% graduation rate, and median earnings of $71,588.
| Rank | School | Cost of Attendance | Median Earnings (mid-career) | Graduation Rate |
|---|---|---|---|---|
| 1 | University of Florida | $22,523 | $71,588 | 91% |
| 2 | Purdue University | $24,591 | $72,424 | 83% |
| 3 | Baruch College | $14,170 | $75,971 | 72% |
| 4 | Cal Poly Pomona | $23,955 | $71,902 | 68% |
| 5 | New Mexico Institute of Mining and Technology | $24,967 | $76,489 | 57% |
| 6 | Iowa State University | $24,018 | $63,386 | 75% |
| 7 | California State University-Long Beach | $22,679 | $64,403 | 69% |
| 8 | Florida International University | $21,462 | $60,249 | 74% |
| 9 | California State University-Fullerton | $18,269 | $62,951 | 70% |
| 10 | University of Central Florida | $23,133 | $58,308 | 77% |
| 11 | University of South Florida | $22,859 | $57,743 | 76% |
| 12 | University of Wisconsin-La Crosse | $19,593 | $60,378 | 71% |
| 13 | Farmingdale State College | $18,966 | $69,781 | 55% |
| 14 | Sonoma State University | $24,648 | $65,986 | 59% |
| 15 | North Dakota State University | $23,716 | $62,203 | 64% |
| 16 | City College of New York | $14,403 | $66,039 | 56% |
| 17 | University of North Carolina at Charlotte | $23,010 | $57,289 | 68% |
| 18 | California State University-East Bay | $22,850 | $71,401 | 47% |
| 19 | SUNY Polytechnic Institute | $23,741 | $64,355 | 57% |
| 20 | CUNY Hunter College | $13,905 | $63,163 | 59% |
Florida International University places eighth, followed by the University of Central Florida at 10th and the University of South Florida at 11th.
Part of Florida’s success in higher education stems from how the state structures and funds its public university system. Florida has long emphasized centralized oversight and relatively low tuition, particularly for in-state students.
New York Schools Pair Low Costs With Strong Earnings
Several New York institutions stand out for pairing low attendance costs with relatively strong earnings.
Baruch College, ranked third overall, has an attendance cost of just $14,170 while posting median earnings of $75,971. City College of New York and Hunter College show a similar pattern, with attendance costs close to $14,000.
California is also well represented, with five universities in the ranking. Cal Poly Pomona leads the state at fourth overall, combining a roughly $24,000 cost of attendance with median earnings of $71,902.
The broader California State University system accounts for several of the state’s entries, including Long Beach and Fullerton. These schools have graduation rates below the leaders at the top of the list, but relatively high earnings help strengthen their composite scores.
The ranking also shows why “best value” does not simply mean “cheapest.”
New Mexico Institute of Mining and Technology, for example, ranks fifth despite a 57% graduation rate. Its median earnings reach $76,489, the highest of any school on the list.
Learn More on the Voronoi App 
Want to explore more education and labor market data? Check out Most Underemployed College Degrees on the Voronoi app.
Misc
The Best and Worst Months to Book a Hotel in U.S. Cities
See the best and worst months to book hotels across U.S. cities, and how much prices can swing throughout the year based on 129M data points.

Published
1 day ago
on
August 23, 2026
The Best and Worst Months to Book a Hotel in U.S. Cities
Key Takeaways
- Hotel rates can vary dramatically by season, with New York showing a 103% swing between its cheapest and most expensive months.
- Phoenix hotels are cheapest in August at $96 per night, compared with $246 in February and March.
- Los Angeles has the smallest seasonal swing among the 20 cities shown, at just 14%.
If you’ve booked a hotel lately, you know that it’s a game of roulette.
One month it seems like you get a screaming deal, but then the next time you book, prices have mysteriously skyrocketed. Is it seasonal or is that by chance?
This visualization helps explain some of that variance by breaking down the best and worst months to book a hotel in U.S. cities.
The data and visualization both come from business travel company Engine, which put together a proprietary dataset on hotel prices by month for 50 U.S. cities using 129 million data points.
Highs and Lows of Hotel Prices by U.S. City
The table below summarizes the cheapest and most expensive months for the 20 cities shown above, along with each city’s median nightly rate and seasonal price swing.
For readers looking beyond these major markets, the complete dataset for all 50 cities appears at the bottom of this post.
| City | Cheapest Month | Median Rate | Most Expensive Month | Swing |
|---|---|---|---|---|
| New York | Jan: $196 | $335 | Dec: $541 | 103% |
| Phoenix | Aug: $96 | $159 | Feb/Mar: $246 | 94% |
| Boston | Jan: $166 | $331 | Oct: $458 | 88% |
| Miami | Sep: $128 | $179 | Feb: $267 | 78% |
| San Diego | Dec: $156 | $195 | Jul: $292 | 70% |
| Chicago | Jan: $127 | $274 | Jun: $319 | 70% |
| New Orleans | Aug: $124 | $165 | Feb: $231 | 65% |
| Denver | Jan/Dec: $121 | $169 | Jun: $221 | 59% |
| Nashville | Jan: $136 | $195 | Oct: $243 | 55% |
| Washington, D.C. | Aug: $179 | $287 | May: $317 | 48% |
| Austin | Aug: $134 | $164 | Oct: $209 | 46% |
| Houston | Dec: $114 | $135 | Mar: $174 | 44% |
| San Francisco | Dec: $129 | $166 | Mar: $197 | 41% |
| Orlando | Aug/Sep: $101 | $129 | Feb: $150 | 38% |
| Minneapolis | Dec: $111 | $137 | Jul: $156 | 33% |
| Las Vegas | Jun: $132 | $154 | Oct: $180 | 31% |
| Atlanta | Dec: $120 | $150 | Jul: $160 | 27% |
| Dallas–Fort Worth | Dec: $112 | $125 | Jun: $139 | 22% |
| San Antonio | Jan: $99 | $117 | Mar/Jul: $124 | 21% |
| Los Angeles | Jan: $157 | $169 | Oct: $181 | 14% |
The swing percentage is calculated as the priciest month minus the least expensive month, divided by the median price.
Cities With the Biggest Price Swings
The three cities with the biggest seasonal price swings in the dataset are New York (103%), Phoenix (94%), and Boston (88%).
The Big Apple has the most interesting contrast here, especially as the most visited city in the country. In December, it costs a high of $541 to book a hotel, but in January, after Christmas and New Year’s celebrations are over, that drops to a low of $196.
Similarly, January is the cheapest time to go to Boston ($166), with its priciest month being October ($458).
Phoenix shows the opposite pattern because of how hot the desert is in summer. Hotel prices plummet to $96 per night in August, but during the winter months of February and March, hotel prices peak at $246.
Cities That Have the Least Variance
But not all U.S. cities have intense seasonal variance. For these U.S. cities, there is no real best or worst month to book a hotel.
Los Angeles, with year-round good weather, is the clearest example in the dataset, with just 14% variance in hotel prices. The cheapest month for a hotel is January ($157), but it only costs $24 more per night to book in the most expensive month, October ($181).
Two cities in Texas, San Antonio and Dallas-Fort Worth, also show little variance by month in hotel prices, at 21% and 22%, respectively.
The Full Data Set for 50 Cities
Below is the full dataset for all 50 cities.
| City | Median | Jan | Feb | Mar | Apr | May | Jun | Jul | Aug | Sep | Oct | Nov | Dec | Swing |
|---|---|---|---|---|---|---|---|---|---|---|---|---|---|---|
| New York | 335 | 196 | 202 | 277 | 335 | 372 | 327 | 268 | 273 | 458 | 429 | 352 | 541 | 103% |
| Palm Springs | 204 | 241 | 288 | 369 | 359 | 204 | 171 | 161 | 158 | 171 | 198 | 228 | 204 | 103% |
| Phoenix | 159 | 177 | 246 | 246 | 173 | 131 | 105 | 98 | 96 | 118 | 159 | 161 | 137 | 94% |
| Norfolk | 129 | 96 | 99 | 116 | 129 | 151 | 178 | 216 | 194 | 130 | 123 | 105 | 101 | 93% |
| Boston | 331 | 166 | 186 | 267 | 331 | 390 | 368 | 332 | 314 | 434 | 458 | 301 | 187 | 88% |
| Omaha | 110 | 98 | 106 | 105 | 110 | 126 | 182 | 120 | 115 | 110 | 111 | 102 | 95 | 79% |
| Miami | 179 | 233 | 267 | 258 | 215 | 179 | 157 | 149 | 135 | 128 | 159 | 176 | 237 | 78% |
| Seattle | 212 | 139 | 150 | 159 | 169 | 213 | 279 | 297 | 272 | 253 | 212 | 165 | 142 | 75% |
| Chicago | 274 | 127 | 139 | 188 | 204 | 305 | 319 | 274 | 280 | 300 | 293 | 208 | 154 | 70% |
| Milwaukee | 130 | 109 | 108 | 117 | 123 | 132 | 163 | 194 | 158 | 136 | 130 | 114 | 103 | 70% |
| San Diego | 195 | 157 | 183 | 189 | 194 | 202 | 231 | 292 | 209 | 195 | 195 | 171 | 156 | 70% |
| New Orleans | 165 | 153 | 231 | 198 | 205 | 165 | 134 | 153 | 124 | 138 | 228 | 195 | 152 | 65% |
| Denver | 169 | 121 | 139 | 138 | 166 | 169 | 221 | 213 | 194 | 199 | 182 | 135 | 121 | 59% |
| Tampa | 167 | 199 | 233 | 224 | 212 | 167 | 152 | 143 | 135 | 135 | 152 | 159 | 168 | 59% |
| Nashville | 195 | 136 | 152 | 178 | 197 | 196 | 215 | 185 | 195 | 220 | 243 | 187 | 146 | 55% |
| Albuquerque | 131 | 111 | 116 | 127 | 131 | 134 | 136 | 131 | 127 | 134 | 179 | 117 | 111 | 52% |
| Charleston | 173 | 123 | 145 | 199 | 205 | 208 | 196 | 195 | 173 | 164 | 167 | 152 | 123 | 49% |
| Washington, D.C. | 287 | 196 | 200 | 303 | 315 | 317 | 287 | 223 | 179 | 290 | 302 | 224 | 182 | 48% |
| Philadelphia | 203 | 166 | 169 | 203 | 222 | 259 | 244 | 199 | 183 | 212 | 246 | 197 | 162 | 48% |
| Austin | 164 | 145 | 168 | 190 | 169 | 159 | 150 | 142 | 134 | 166 | 209 | 164 | 140 | 46% |
| Houston | 135 | 119 | 135 | 174 | 146 | 139 | 141 | 134 | 129 | 131 | 135 | 129 | 114 | 44% |
| San Francisco | 166 | 166 | 166 | 197 | 159 | 168 | 169 | 154 | 152 | 192 | 176 | 147 | 129 | 41% |
| Indianapolis | 125 | 114 | 107 | 122 | 133 | 158 | 140 | 155 | 125 | 117 | 134 | 122 | 112 | 41% |
| Cincinnati | 133 | 106 | 108 | 118 | 139 | 133 | 152 | 156 | 142 | 135 | 125 | 110 | 104 | 39% |
| Orlando | 129 | 132 | 150 | 143 | 133 | 120 | 130 | 117 | 101 | 101 | 114 | 121 | 129 | 38% |
| Pittsburgh | 158 | 131 | 131 | 134 | 169 | 180 | 191 | 156 | 158 | 172 | 183 | 150 | 135 | 38% |
| Cleveland | 158 | 124 | 124 | 139 | 146 | 158 | 173 | 183 | 173 | 178 | 158 | 141 | 128 | 37% |
| Minneapolis | 137 | 114 | 114 | 125 | 130 | 137 | 152 | 156 | 144 | 141 | 143 | 122 | 111 | 33% |
| Salt Lake City | 141 | 125 | 127 | 141 | 151 | 154 | 160 | 143 | 135 | 148 | 136 | 121 | 115 | 32% |
| Las Vegas | 154 | 158 | 143 | 159 | 151 | 161 | 132 | 135 | 135 | 156 | 180 | 154 | 148 | 31% |
| Louisville | 141 | 106 | 134 | 144 | 147 | 144 | 127 | 144 | 124 | 149 | 141 | 118 | 110 | 30% |
| Detroit | 197 | 168 | 170 | 170 | 188 | 214 | 214 | 218 | 197 | 212 | 228 | 171 | 168 | 30% |
| Portland | 125 | 109 | 118 | 116 | 120 | 127 | 143 | 145 | 139 | 128 | 125 | 114 | 109 | 29% |
| Atlanta | 150 | 150 | 147 | 154 | 159 | 149 | 155 | 160 | 142 | 139 | 151 | 127 | 120 | 27% |
| St. Louis | 156 | 129 | 136 | 161 | 162 | 161 | 170 | 167 | 154 | 156 | 144 | 142 | 131 | 26% |
| Jacksonville | 121 | 119 | 126 | 142 | 126 | 127 | 118 | 121 | 113 | 111 | 119 | 118 | 121 | 26% |
| Kansas City | 142 | 117 | 123 | 132 | 146 | 149 | 153 | 146 | 134 | 142 | 146 | 135 | 125 | 25% |
| Oklahoma City | 97 | 90 | 90 | 98 | 102 | 108 | 111 | 99 | 97 | 97 | 93 | 93 | 87 | 25% |
| Savannah | 138 | 118 | 137 | 152 | 149 | 148 | 148 | 136 | 126 | 138 | 144 | 133 | 121 | 25% |
| Baltimore | 142 | 118 | 128 | 127 | 134 | 147 | 152 | 146 | 142 | 144 | 144 | 125 | 118 | 24% |
| Columbus | 127 | 110 | 110 | 119 | 119 | 141 | 128 | 135 | 127 | 127 | 127 | 122 | 110 | 24% |
| Honolulu | 184 | 182 | 193 | 178 | 180 | 180 | 204 | 211 | 198 | 184 | 177 | 169 | 211 | 23% |
| Dallas–Fort Worth | 125 | 122 | 123 | 127 | 129 | 124 | 139 | 128 | 121 | 125 | 130 | 119 | 112 | 22% |
| Sacramento | 148 | 140 | 140 | 147 | 148 | 148 | 159 | 168 | 159 | 148 | 166 | 136 | 137 | 22% |
| Raleigh–Durham | 135 | 119 | 125 | 130 | 135 | 140 | 143 | 133 | 130 | 135 | 148 | 135 | 129 | 21% |
| San Antonio | 117 | 99 | 122 | 124 | 118 | 109 | 122 | 124 | 107 | 107 | 117 | 109 | 106 | 21% |
| Charlotte | 131 | 120 | 126 | 128 | 133 | 145 | 139 | 132 | 129 | 131 | 137 | 131 | 125 | 19% |
| Memphis | 118 | 107 | 112 | 123 | 118 | 124 | 118 | 122 | 117 | 115 | 117 | 119 | 103 | 18% |
| Los Angeles | 169 | 157 | 169 | 175 | 169 | 173 | 174 | 176 | 168 | 166 | 181 | 163 | 162 | 14% |
| El Paso | 126 | 119 | 123 | 128 | 126 | 121 | 130 | 118 | 123 | 127 | 128 | 127 | 117 | 10% |
For further analysis, we recommend checking out Engine’s original post, which includes some interactive data visualizations as well.
Learn More on the Voronoi App
What type of accommodation do Americans opt for when travelling? This visual on Voronoi compares hotels against other types of accommodation like vacation apartments, cruises, and motorhomes.