From Amazon to Zoom: An Internet Minute In 2021
In our everyday lives, not much may happen in a minute. But when gauging the depth of internet activity occurring all at once, it can be extraordinary. Today, around five billion internet users exist across the globe.
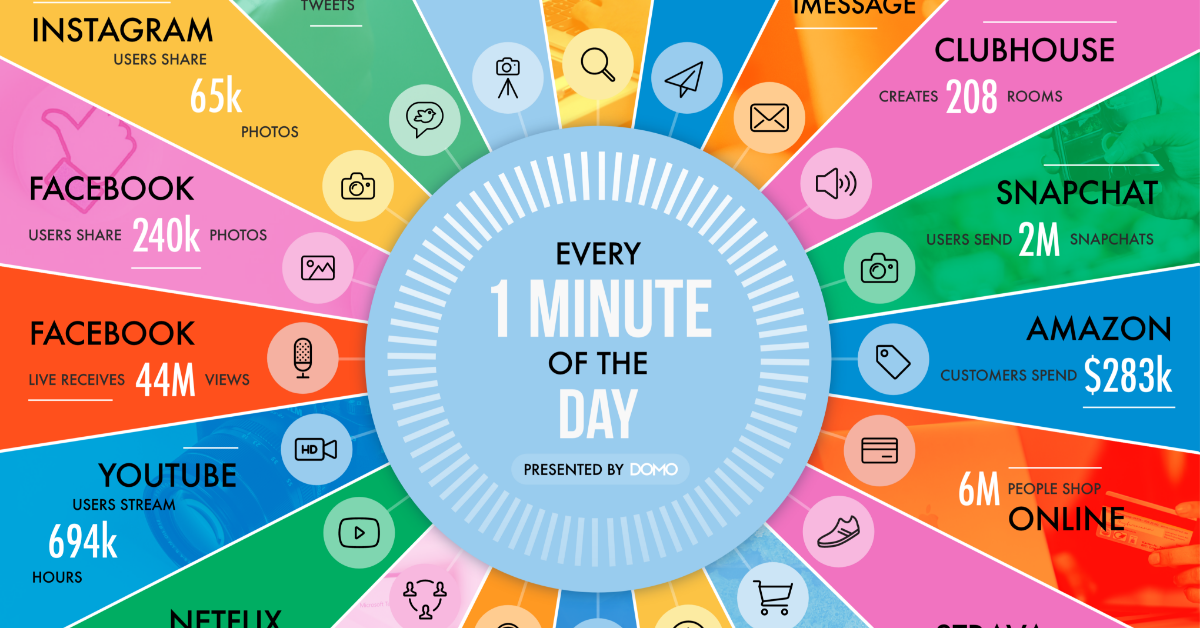
This annual infographic from Domo captures just how much activity is going on in any given minute, and the amount of data being generated by users. To put it mildly, there’s a lot.
The Internet Minute
At the heart of the world’s digital activity are the everyday services and applications that have become staples in our lives. Collectively, these produce unimaginable quantities of user activity and associated data.
Here are just some of the key figures of what happens in a minute:
- Amazon customers spend $283,000
- 12 million people send an iMessage
- 6 million people shop online
- Instacart users spend $67,000
- Slack users send 148,000 messages
- Microsoft Teams connects 100,000 users
- YouTube users stream 694,000 videos
- Facebook Live receives 44 million views
- Instagram users share 65,000 photos
- Tiktok users watch 167 million videos
As these facts show, Big Tech companies have quite the influence over our lives. That influence is becoming difficult to ignore, and draws increasing media and political attention. And some see this attention as a plausible explanation for why Facebook changed their name—to dissociate from their old one in the process.
One tangible measure of this influence is the massive amount of revenue Big Tech companies bring in. To get a better sense of this, we can look at Big Tech’s revenue generating capabilities on a per-minute basis as well:
| Company | Revenue Per Minute |
|---|---|
| Amazon | $955,517 |
| Apple | $848,090 |
| Alphabet (Google) | $433,014 |
| Microsoft | $327,823 |
| $213,628 | |
| Tesla | $81,766 |
| Netflix | $50,566 |
Much of the revenue that these elite trillion-dollar stocks generate can be traced back to all the activity on their various networks and platforms.
In other words, the 5.7 million Google searches that occur every minute is the key to their $433,014 in per minute sales.
The Internet Minute Over The Years
With the amount of data and information in the digital universe effectively doubling every two years, it’s fair to say the internet minute has gone through some changes over the years. Here are just some areas that have experienced impressive growth:
- In 2016, Snapchat users 527k photos per minute, compared to 2 million in 2021
- In 2017, Twitter saw 452k Tweets per minute, compared to 575k in 2021
- In 2018, $862,823 was spent online shopping, while 2 million people were shopping per minute in 2021
- In 2019, 4.5 million videos on YouTube were being viewed every minute, while in 2021 users were streaming 694k hours
- In 2020, Netflix users streamed 404k hours per minute, growing to 452k hours in 2021
Here’s a look at the services that have been featured in the various iterations of this graphic over the years:
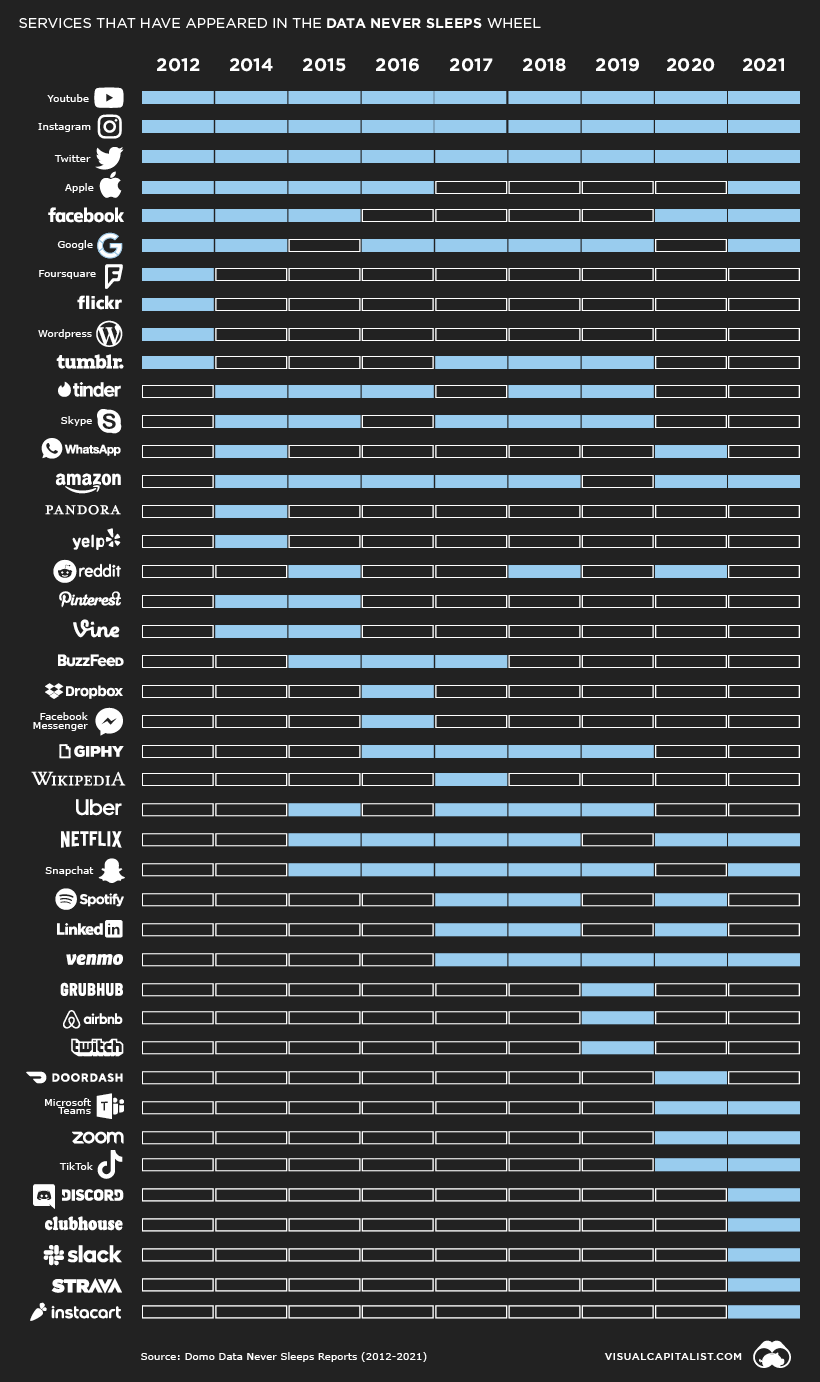
Twitter, Instagram, and Youtube are the only three brands to be featured every single year.
Internet Growth Perspectives
The Internet Minute wheel also helps to put the internet’s rapid rate of adoption into perspective. For instance, in 1993, there were only 14 million internet users across the globe. But today, there are over 14 million just in Chile.
That said, the total addressable market still has some room left. By some measures, the complete number of internet users grew by 500 million in 2021, a roughly 11% jump from 4.5 billion users in 2020. This comes out to an astonishing 950 new users on a per minute basis.
What’s more, in the long term, with the appropriate infrastructure in place, certain areas within emerging markets can experience buoyant growth in the number of connected citizens. Here’s where the next billion internet users may come from, based on the largest disconnected populations.
| Rank | Country / Territory | Unconnected People | % of Population |
|---|---|---|---|
| 1 | India | 685,591,071 | 50% |
| 2 | China | 582,063,733 | 41% |
| 3 | Pakistan | 142,347,735 | 65% |
| 4 | Nigeria | 118,059,925 | 58% |
| 5 | Bangladesh | 97,427,352 | 59% |
| 6 | Indonesia | 96,709,226 | 36% |
| 7 | Ethiopia | 92,385,728 | 81% |
| 8 | Democratic Republic of Congo | 71,823,319 | 81% |
| 9 | Brazil | 61,423,295 | 29% |
| 10 | Egypt | 46,626,170 | 46% |
With this growth trajectory in mind, we can expect future figures to become even more astonishing. But the human mind is known to be bad at interpreting large numbers, so in future editions, the internet minute figures may need to be stripped down to the internet second.
Technology
Ranked: Where the iPhone Costs the Most in 2026
The same iPhone can cost more than twice as much depending on where you buy it. See the world’s most expensive markets.

Published
1 day ago
on
August 1, 2026

Ranked: Where the iPhone Costs the Most in 2026
Key Takeaways
- Türkiye is the world’s most expensive place to buy an iPhone 17 Pro (256GB), with a retail price of $2,592.
- The same model costs more than twice as much in Türkiye as it does in Japan, the cheapest market in the comparison.
- Taxes, import duties, currency movements, and local regulations can add hundreds of dollars to an iPhone’s retail price.
Apple sells the same flagship smartphone worldwide, but its retail price varies significantly by market.
This graphic compares the price of Apple’s iPhone 17 Pro (256GB) across 41 markets in 2026 using data from Deutsche Bank.
The World’s Most Expensive Place to Buy an iPhone
Türkiye tops the ranking at $2,592, more than $1,400 above the U.S. price of $1,181. Brazil ranks second at $2,260, while Egypt follows at $1,872.
At the other end of the ranking, Japan has the lowest price in the comparison at $1,121, slightly below U.S. pricing. The wide gap shows how taxes, import policies, and local market conditions can outweigh the global pricing strategy of one of the world’s leading smartphone brands.
| Rank | Country | iPhone 17 Pro 256GB (USD) | Price relative to the U.S. |
|---|---|---|---|
| 1 | 🇹🇷 Türkiye | $2,592 | 219% |
| 2 | 🇧🇷 Brazil | $2,260 | 191% |
| 3 | 🇪🇬 Egypt | $1,872 | 158% |
| 4 | 🇭🇺 Hungary | $1,826 | 155% |
| 5 | 🇳🇴 Norway | $1,687 | 143% |
| 6 | 🇲🇽 Mexico | $1,657 | 140% |
| 7 | 🇸🇪 Sweden | $1,601 | 135% |
| 8 | 🇵🇱 Poland | $1,588 | 134% |
| 9 | 🇨🇿 Czechia | $1,585 | 134% |
| 10 | 🇫🇮 Finland | $1,578 | 134% |
| 11 | 🇵🇹 Portugal | $1,566 | 133% |
| 12 | 🇬🇷 Greece | $1,566 | 133% |
| 13 | 🇮🇹 Italy | $1,554 | 132% |
| 14 | 🇮🇪 Ireland | $1,554 | 132% |
| 15 | 🇩🇰 Denmark | $1,553 | 131% |
| 16 | 🇫🇷 France | $1,543 | 131% |
| 17 | 🇳🇱 Netherlands | $1,543 | 131% |
| 18 | 🇧🇪 Belgium | $1,543 | 131% |
| 19 | 🇪🇸 Spain | $1,531 | 130% |
| 20 | 🇦🇹 Austria | $1,508 | 128% |
| 21 | 🇩🇪 Germany | $1,508 | 128% |
| 22 | 🇱🇺 Luxembourg | $1,492 | 126% |
| 23 | 🇬🇧 UK | $1,476 | 125% |
| 24 | 🇮🇳 India | $1,427 | 121% |
| 25 | 🇦🇺 Australia | $1,413 | 120% |
| 26 | 🇸🇦 Saudi Arabia | $1,386 | 117% |
| 27 | 🇨🇭 Switzerland | $1,385 | 117% |
| 28 | 🇳🇿 New Zealand | $1,370 | 116% |
| 29 | 🇸🇬 Singapore | $1,364 | 115% |
| 30 | 🇲🇾 Malaysia | $1,352 | 114% |
| 31 | 🇹🇭 Thailand | $1,350 | 114% |
| 32 | 🇨🇳 China | $1,332 | 113% |
| 33 | 🇻🇳 Vietnam | $1,330 | 113% |
| 34 | 🇵🇭 Philippines | $1,326 | 112% |
| 35 | 🇨🇦 Canada | $1,291 | 109% |
| 36 | 🇦🇪 UAE | $1,279 | 108% |
| 37 | 🇹🇼 Taiwan | $1,264 | 107% |
| 38 | 🇭🇰 Hong Kong | $1,200 | 102% |
| 39 | 🇺🇸 United States | $1,181 | 100% |
| 40 | 🇰🇷 South Korea | $1,181 | 100% |
| 41 | 🇯🇵 Japan | $1,121 | 95% |
Europe accounts for much of the ranking’s upper half, partly because advertised prices include value-added tax (VAT). Standard VAT rates range from 27% in Hungary to just over 8% in Switzerland, contributing to substantial differences in final retail prices.
Why Do iPhone Prices Vary So Much?
Apple establishes regional prices, but governments also play a major role in determining what consumers pay.
Import duties, regulatory fees, and device-specific taxes can significantly increase the retail price of electronics. Currency movements also affect local pricing, particularly when domestic currencies weaken against the U.S. dollar.
Türkiye is the clearest outlier. In addition to a 20% VAT, smartphones are subject to special consumption taxes and registration fees that sharply increase their retail prices.
Why Japan Is One of the Cheapest Markets
Japan is one of the few markets where Apple’s flagship iPhone costs less than it does in the United States.
A relatively low 10% consumption tax, a highly competitive smartphone market, and Apple’s long-standing pricing strategy have helped keep prices comparatively low. Even so, Apple has recently raised prices on some products in Japan following years of yen weakness and shifting exchange rates.
Global price rankings can change quickly. As currencies fluctuate and governments adjust taxes and import policies, today’s cheapest market may not hold that position for long.
Learn More on the Voronoi App 
To learn more about this topic, check out this graphic on how Apple makes its money.
Digital Transformation
Mapped: Where Innovation Is Thriving Across America
Discover America’s most innovative states, ranked by patents, venture capital investment, and R&D spending per capita.

Published
5 days ago
on
July 28, 2026

Mapped: Where Innovation Is Thriving Across America
See visuals like this from many other data creators on our Voronoi app. Download it for free on iOS or Android and discover incredible data-driven charts from a variety of trusted sources.
Key Takeaways
- California ranks first by a wide margin, driven by its strength in patents, venture capital, and R&D spending.
- Six Western states place in the top 10, forming an “Innovation Belt” from the Pacific Coast to the Mountain West.
- The ranking combines patents, venture capital investment, and research spending to measure innovation activity across all 50 states.
Innovation shapes where new companies are built, breakthrough technologies emerge, and high-paying jobs are created. Across the U.S., however, that activity is concentrated in a relatively small group of states.
This map ranks all 50 states using a composite score based on patents per capita in 2025, venture capital deal value per capita in 2025, and research and development expenditures per capita in 2023.
The data for this visualization comes from SmartAsset.
California Leads by a Wide Margin
California tops the ranking with a composite score of 95.2, nearly 20 points ahead of second-place Massachusetts.
| Rank | State | Most Innovative (0-100) |
|---|---|---|
| 1 | California | 95.2 |
| 2 | Massachusetts | 75.2 |
| 3 | Delaware | 57.3 |
| 4 | Washington | 51.8 |
| 5 | Oregon | 37.2 |
| 6 | Colorado | 33.6 |
| 7 | Connecticut | 32.6 |
| 8 | Wyoming | 31.9 |
| 9 | Minnesota | 31.1 |
| 10 | Idaho | 29.8 |
| 11 | New Hampshire | 29.4 |
| 12 | Michigan | 28.1 |
| 13 | New York | 27.1 |
| 14 | Vermont | 25.0 |
| 15 | Utah | 24.1 |
| 16 | North Carolina | 23.5 |
| 17 | Maryland | 22.2 |
| 18 | Illinois | 21.8 |
| 19 | Wisconsin | 21.4 |
| 20 | Virginia | 20.6 |
| 21 | New Jersey | 19.8 |
| 22 | New Mexico | 18.6 |
| 23 | Arizona | 18.4 |
| 24 | Rhode Island | 18.2 |
| 25 | Iowa | 17.7 |
| 26 | Texas | 17.7 |
| 27 | Ohio | 17.6 |
| 28 | Pennsylvania | 17.4 |
| 29 | Nevada | 16.5 |
| 30 | North Dakota | 15.4 |
| 31 | Indiana | 14.6 |
| 32 | Montana | 13.6 |
| 33 | Missouri | 12.0 |
| 34 | Kansas | 11.8 |
| 35 | Georgia | 11.4 |
| 36 | Florida | 10.5 |
| 37 | Tennessee | 8.8 |
| 38 | Nebraska | 8.2 |
| 39 | South Carolina | 6.7 |
| 40 | Alabama | 5.4 |
| 41 | Oklahoma | 5.2 |
| 42 | South Dakota | 5.1 |
| 43 | Kentucky | 4.7 |
| 44 | Maine | 4.7 |
| 45 | Arkansas | 3.0 |
| 46 | Hawaii | 2.8 |
| 47 | Louisiana | 1.9 |
| 48 | West Virginia | 0.5 |
| 49 | Alaska | 0.4 |
| 50 | Mississippi | 0.1 |
The state produces 129 patents per 100,000 residents, attracts nearly $5,000 in venture capital investment per person, and spends more than $7,100 per capita on research and development.
California’s advantage extends beyond Silicon Valley and the San Francisco Bay Area. Southern California’s technology, aerospace, and biotech hubs also contribute to the state’s innovation ecosystem.
Together, these regions bring major technology companies, leading research universities, and venture-backed startups into close proximity, reinforcing investment and new business formation.
| Most Innovative | Patents per 100K residents | VC deal value (per capita) | R&D expenditures (per capita) |
|---|---|---|---|
| California | 129 | $4,920 | $7,105 |
| Massachusetts | 106 | $2,324 | $9,688 |
| Delaware | 63 | $3,772 | $5,796 |
| Washington | 80 | $938 | $7,443 |
| Oregon | 75 | $320 | $2,675 |
Massachusetts ranks second, supported by exceptional R&D spending and a dense concentration of universities, biotech firms, and research institutions around Boston and Cambridge.
Delaware rounds out the top three, boosted by unusually high venture capital investment relative to its population.
The West Forms America’s Innovation Belt
Six Western states rank in the top 10: California, Washington, Oregon, Colorado, Wyoming, and Idaho.
Their strong performance reflects expanding startup ecosystems, skilled engineering workforces, and close ties between universities and private industry.
Some neighboring states have also attracted companies seeking lower operating costs while retaining access to talent and venture funding.
Washington’s fourth-place finish is supported by major employers such as Microsoft and Amazon, while Oregon stands out for its patent activity and technology manufacturing base.
Innovation Gaps Remain Across the Country
Mississippi, Alaska, West Virginia, Louisiana, and Hawaii record the lowest composite scores in the ranking.
| Least Innovative | Patents per 100K residents | VC deal value (per capita) | R&D expenditures (per capita) |
|---|---|---|---|
| Hawaii | 8 | $78 | $748 |
| Louisiana | 8 | $18 | $422 |
| West Virginia | 5 | $2 | $413 |
| Alaska | 4 | $12 | $581 |
| Mississippi | 4 | $2 | $435 |
These states tend to lag across all three measures, producing fewer patents while attracting less venture capital and research investment per resident.
As industries such as artificial intelligence, biotechnology, and advanced manufacturing expand, states that strengthen their innovation ecosystems may be better positioned for future economic growth.
Learn More on the Voronoi App
To learn more about this topic, check out this graphic on the jobs most exposed to AI.