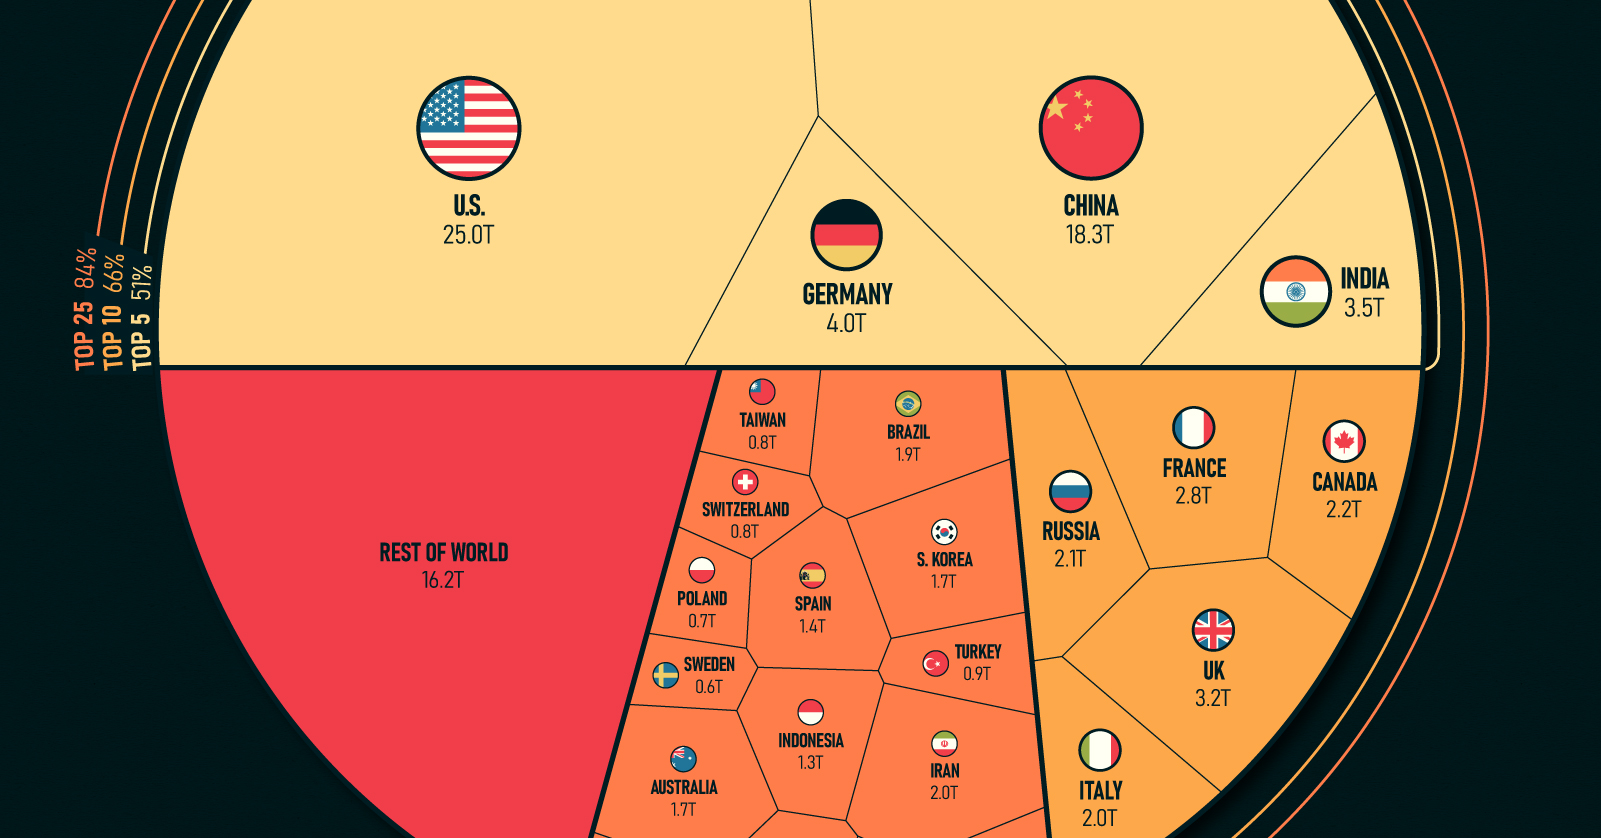
Countries by Share of the Global Economy
As 2022 comes to a close we can recap many historic milestones of the year, like the Earth’s population hitting 8 billion and the global economy surpassing $100 trillion.
In this chart, we visualize the world’s GDP using data from the IMF, showcasing the biggest economies and the share of global economic activity that they make up.
ℹ️ Gross Domestic Product (GDP) is a broad indicator of the economic activity within a country. It measures the total value of economic output—goods and services—produced within a given time frame by both the private and public sectors.
The GDP Heavyweights
The global economy can be thought of as a pie, with the size of each slice representing the share of global GDP contributed by each country. Currently, the largest slices of the pie are held by the United States, China, Japan, Germany, and India, which together account for more than half of global GDP.
Here’s a look at every country’s share of the world’s $101.6 trillion economy:
| Rank | Country | GDP (Billions, USD) |
|---|---|---|
| #1 | 🇺🇸 United States | $25,035.2 |
| #2 | 🇨🇳 China | $18,321.2 |
| #3 | 🇯🇵 Japan | $4,300.6 |
| #4 | 🇩🇪 Germany | $4,031.1 |
| #5 | 🇮🇳 India | $3,468.6 |
| #6 | 🇬🇧 United Kingdom | $3,198.5 |
| #7 | 🇫🇷 France | $2,778.1 |
| #8 | 🇨🇦 Canada | $2,200.4 |
| #9 | 🇷🇺 Russia | $2,133.1 |
| #10 | 🇮🇹 Italy | $1,997.0 |
| #11 | 🇮🇷 Iran | $1,973.7 |
| #12 | 🇧🇷 Brazil | $1,894.7 |
| #13 | 🇰🇷 South Korea | $1,734.2 |
| #14 | 🇦🇺 Australia | $1,724.8 |
| #15 | 🇲🇽 Mexico | $1,424.5 |
| #16 | 🇪🇸 Spain | $1,389.9 |
| #17 | 🇮🇩 Indonesia | $1,289.4 |
| #18 | 🇸🇦 Saudi Arabia | $1,010.6 |
| #19 | 🇳🇱 Netherlands | $990.6 |
| #20 | 🇹🇷 Turkey | $853.5 |
| #21 | 🇹🇼 Taiwan | $828.7 |
| #22 | 🇨🇭 Switzerland | $807.4 |
| #23 | 🇵🇱 Poland | $716.3 |
| #24 | 🇦🇷 Argentina | $630.7 |
| #25 | 🇸🇪 Sweden | $603.9 |
| #26 | 🇧🇪 Belgium | $589.5 |
| #27 | 🇹🇭 Thailand | $534.8 |
| #28 | 🇮🇱 Israel | $527.2 |
| #29 | 🇮🇪 Ireland | $519.8 |
| #30 | 🇳🇴 Norway | $504.7 |
| #31 | 🇳🇬 Nigeria | $504.2 |
| #32 | 🇦🇪 United Arab Emirates | $503.9 |
| #33 | 🇪🇬 Egypt | $469.1 |
| #34 | 🇦🇹 Austria | $468.0 |
| #35 | 🇧🇩 Bangladesh | $460.8 |
| #36 | 🇲🇾 Malaysia | $434.1 |
| #37 | 🇸🇬 Singapore | $423.6 |
| #38 | 🇻🇳 Vietnam | $413.8 |
| #39 | 🇿🇦 South Africa | $411.5 |
| #40 | 🇵🇭 Philippines | $401.7 |
| #41 | 🇩🇰 Denmark | $386.7 |
| #42 | 🇵🇰 Pakistan | $376.5 |
| #43 | 🇭🇰 Hong Kong SAR | $368.4 |
| #44 | 🇨🇴 Colombia | $342.9 |
| #45 | 🇨🇱 Chile | $310.9 |
| #46 | 🇷🇴 Romania | $299.9 |
| #47 | 🇨🇿 Czech Republic | $295.6 |
| #48 | 🇮🇶 Iraq | $282.9 |
| #49 | 🇫🇮 Finland | $281.4 |
| #50 | 🇵🇹 Portugal | $255.9 |
| #51 | 🇳🇿 New Zealand | $242.7 |
| #52 | 🇵🇪 Peru | $239.3 |
| #53 | 🇰🇿 Kazakhstan | $224.3 |
| #54 | 🇬🇷 Greece | $222.0 |
| #55 | 🇶🇦 Qatar | $221.4 |
| #56 | 🇩🇿 Algeria | $187.2 |
| #57 | 🇭🇺 Hungary | $184.7 |
| #58 | 🇰🇼 Kuwait | $183.6 |
| #59 | 🇲🇦 Morocco | $142.9 |
| #60 | 🇦🇴 Angola | $124.8 |
| #61 | 🇵🇷 Puerto Rico | $118.7 |
| #62 | 🇪🇨 Ecuador | $115.5 |
| #63 | 🇰🇪 Kenya | $114.9 |
| #64 | 🇸🇰 Slovakia | $112.4 |
| #65 | 🇩🇴 Dominican Republic | $112.4 |
| #66 | 🇪🇹 Ethiopia | $111.2 |
| #67 | 🇴🇲 Oman | $109.0 |
| #68 | 🇬🇹 Guatemala | $91.3 |
| #69 | 🇧🇬 Bulgaria | $85.0 |
| #70 | 🇱🇺 Luxembourg | $82.2 |
| #71 | 🇻🇪 Venezuela | $82.1 |
| #72 | 🇧🇾 Belarus | $79.7 |
| #73 | 🇺🇿 Uzbekistan | $79.1 |
| #74 | 🇹🇿 Tanzania | $76.6 |
| #75 | 🇬🇭 Ghana | $76.0 |
| #76 | 🇹🇲 Turkmenistan | $74.4 |
| #77 | 🇱🇰 Sri Lanka | $73.7 |
| #78 | 🇺🇾 Uruguay | $71.2 |
| #79 | 🇵🇦 Panama | $71.1 |
| #80 | 🇦🇿 Azerbaijan | $70.1 |
| #81 | 🇭🇷 Croatia | $69.4 |
| #82 | 🇨🇮 Côte d'Ivoire | $68.6 |
| #83 | 🇨🇷 Costa Rica | $68.5 |
| #84 | 🇱🇹 Lithuania | $68.0 |
| #85 | 🇨🇩 Democratic Republic of the Congo | $63.9 |
| #86 | 🇷🇸 Serbia | $62.7 |
| #87 | 🇸🇮 Slovenia | $62.2 |
| #88 | 🇲🇲 Myanmar | $59.5 |
| #89 | 🇺🇬 Uganda | $48.4 |
| #90 | 🇯🇴 Jordan | $48.1 |
| #91 | 🇹🇳 Tunisia | $46.3 |
| #92 | 🇨🇲 Cameroon | $44.2 |
| #93 | 🇧🇭 Bahrain | $43.5 |
| #94 | 🇧🇴 Bolivia | $43.4 |
| #95 | 🇸🇩 Sudan | $42.8 |
| #96 | 🇵🇾 Paraguay | $41.9 |
| #97 | 🇱🇾 Libya | $40.8 |
| #98 | 🇱🇻 Latvia | $40.6 |
| #99 | 🇪🇪 Estonia | $39.1 |
| #100 | 🇳🇵 Nepal | $39.0 |
| #101 | 🇿🇼 Zimbabwe | $38.3 |
| #102 | 🇸🇻 El Salvador | $32.0 |
| #103 | 🇵🇬 Papua New Guinea | $31.4 |
| #104 | 🇭🇳 Honduras | $30.6 |
| #105 | 🇹🇹 Trinidad and Tobago | $29.3 |
| #106 | 🇰🇭 Cambodia | $28.3 |
| #107 | 🇮🇸 Iceland | $27.7 |
| #108 | 🇾🇪 Yemen | $27.6 |
| #109 | 🇸🇳 Senegal | $27.5 |
| #110 | 🇿🇲 Zambia | $27.0 |
| #111 | 🇨🇾 Cyprus | $26.7 |
| #112 | 🇬🇪 Georgia | $25.2 |
| #113 | 🇧🇦 Bosnia and Herzegovina | $23.7 |
| #114 | 🇲🇴 Macao SAR | $23.4 |
| #115 | 🇬🇦 Gabon | $22.2 |
| #116 | 🇭🇹 Haiti | $20.2 |
| #117 | 🇬🇳 Guinea | $19.7 |
| #118 | West Bank and Gaza | $18.8 |
| #119 | 🇧🇳 Brunei | $18.5 |
| #120 | 🇲🇱 Mali | $18.4 |
| #121 | 🇧🇫 Burkina Faso | $18.3 |
| #122 | 🇦🇱 Albania | $18.3 |
| #123 | 🇧🇼 Botswana | $18.0 |
| #124 | 🇲🇿 Mozambique | $17.9 |
| #125 | 🇦🇲 Armenia | $17.7 |
| #126 | 🇧🇯 Benin | $17.5 |
| #127 | 🇲🇹 Malta | $17.2 |
| #128 | 🇬🇶 Equatorial Guinea | $16.9 |
| #129 | 🇱🇦 Laos | $16.3 |
| #130 | 🇯🇲 Jamaica | $16.1 |
| #131 | 🇲🇳 Mongolia | $15.7 |
| #132 | 🇳🇮 Nicaragua | $15.7 |
| #133 | 🇲🇬 Madagascar | $15.1 |
| #134 | 🇬🇾 Guyana | $14.8 |
| #135 | 🇳🇪 Niger | $14.6 |
| #136 | 🇨🇬 Republic of Congo | $14.5 |
| #137 | 🇲🇰 North Macedonia | $14.1 |
| #138 | 🇲🇩 Moldova | $14.0 |
| #139 | 🇹🇩 Chad | $12.9 |
| #140 | 🇧🇸 The Bahamas | $12.7 |
| #141 | 🇳🇦 Namibia | $12.5 |
| #142 | 🇷🇼 Rwanda | $12.1 |
| #143 | 🇲🇼 Malawi | $11.6 |
| #144 | 🇲🇺 Mauritius | $11.5 |
| #145 | 🇲🇷 Mauritania | $10.1 |
| #146 | 🇹🇯 Tajikistan | $10.0 |
| #147 | 🇰🇬 Kyrgyzstan | $9.8 |
| #148 | 🇽🇰 Kosovo | $9.2 |
| #149 | 🇸🇴 Somalia | $8.4 |
| #150 | 🇹🇬 Togo | $8.4 |
| #151 | 🇲🇪 Montenegro | $6.1 |
| #152 | 🇲🇻 Maldives | $5.9 |
| #153 | 🇧🇧 Barbados | $5.8 |
| #154 | 🇫🇯 Fiji | $4.9 |
| #155 | 🇸🇸 South Sudan | $4.8 |
| #156 | 🇸🇿 Eswatini | $4.7 |
| #157 | 🇸🇱 Sierra Leone | $4.1 |
| #158 | 🇱🇷 Liberia | $3.9 |
| #159 | 🇩🇯 Djibouti | $3.7 |
| #160 | 🇧🇮 Burundi | $3.7 |
| #161 | 🇦🇼 Aruba | $3.5 |
| #162 | 🇦🇩 Andorra | $3.3 |
| #163 | 🇸🇷 Suriname | $3.0 |
| #164 | 🇧🇹 Bhutan | $2.7 |
| #165 | 🇧🇿 Belize | $2.7 |
| #166 | 🇱🇸 Lesotho | $2.5 |
| #167 | 🇨🇫 Central African Republic | $2.5 |
| #168 | 🇹🇱 Timor-Leste | $2.4 |
| #169 | 🇪🇷 Eritrea | $2.4 |
| #170 | 🇬🇲 The Gambia | $2.1 |
| #171 | 🇨🇻 Cabo Verde | $2.1 |
| #172 | 🇸🇨 Seychelles | $2.0 |
| #173 | 🇱🇨 St. Lucia | $2.0 |
| #174 | 🇦🇬 Antigua and Barbuda | $1.7 |
| #175 | 🇬🇼 Guinea-Bissau | $1.6 |
| #176 | 🇸🇲 San Marino | $1.6 |
| #177 | 🇸🇧 Solomon Islands | $1.6 |
| #178 | 🇰🇲 Comoros | $1.2 |
| #179 | 🇬🇩 Grenada | $1.2 |
| #180 | 🇰🇳 St. Kitts and Nevis | $1.1 |
| #181 | 🇻🇺 Vanuatu | $1.0 |
| #182 | 🇻🇨 St. Vincent and the Grenadines | $1.0 |
| #183 | 🇼🇸 Samoa | $0.83 |
| #184 | 🇩🇲 Dominica | $0.60 |
| #185 | 🇸🇹 São Tomé and Príncipe | $0.51 |
| #186 | 🇹🇴 Tonga | $0.50 |
| #187 | 🇫🇲 Micronesia | $0.43 |
| #188 | 🇲🇭 Marshall Islands | $0.27 |
| #189 | 🇵🇼 Palau | $0.23 |
| #190 | 🇰🇮 Kiribati | $0.21 |
| #191 | 🇳🇷 Nauru | $0.13 |
| #192 | 🇹🇻 Tuvalu | $0.06 |
| #193 | 🇺🇦 Ukraine | Data not available |
| Total World GDP | $101,559.3 |
Just five countries make up more than half of the world’s entire GDP in 2022: the U.S., China, Japan, India, and Germany. Interestingly, India replaced the UK this year as a top five economy.
Adding on another five countries (the top 10) makes up 66% of the global economy, and the top 25 countries comprise 84% of global GDP.
The World’s Smallest Economies
The rest of the world — the remaining 167 nations — make up 16% of global GDP. Many of the smallest economies are islands located in Oceania.
Here’s a look at the 20 smallest economies in the world:
| Country | GDP (Billions, USD) |
|---|---|
| 🇹🇻 Tuvalu | $0.06 |
| 🇳🇷 Nauru | $0.13 |
| 🇰🇮 Kiribati | $0.21 |
| 🇵🇼 Palau | $0.23 |
| 🇲🇭 Marshall Islands | $0.27 |
| 🇫🇲 Micronesia | $0.43 |
| 🇹🇴 Tonga | $0.50 |
| 🇸🇹 São Tomé and Príncipe | $0.51 |
| 🇩🇲 Dominica | $0.60 |
| 🇼🇸 Samoa | $0.83 |
| 🇻🇨 St. Vincent and the Grenadines | $0.95 |
| 🇻🇺 Vanuatu | $0.98 |
| 🇰🇳 St. Kitts and Nevis | $1.12 |
| 🇬🇩 Grenada | $1.19 |
| 🇰🇲 Comoros | $1.24 |
| 🇸🇧 Solomon Islands | $1.60 |
| 🇸🇲 San Marino | $1.62 |
| 🇬🇼 Guinea-Bissau | $1.62 |
| 🇦🇬 Antigua and Barbuda | $1.69 |
| 🇱🇨 St. Lucia | $1.97 |
Tuvalu has the smallest GDP of any country at just $64 million. Tuvalu is one of a dozen nations with a GDP of less than one billion dollars.
The Global Economy in 2023
Heading into 2023, there is much economic uncertainty. Many experts are anticipating a brief recession, although opinions differ on the definition of “brief”.
Some experts believe that China will buck the trend of economic downturn. If this prediction comes true, the country could own an even larger slice of the global GDP pie in the near future.
See what hundreds of experts are predicting for 2023 with our Global Forecast Series.
Where does this data come from?
Source: IMF (International Monetary Fund)
Data note: Due to conflict and other issues, some countries are not included in this data set (e.g. Ukraine, Syria, Afghanistan). Major sources for GDP data differ widely on the size of Iran’s economy. It’s worth noting that this data from IMF ranks Iran’s GDP much higher than World Bank or the UN.
Business
Amazon Overtakes Walmart as America’s Biggest Company
After a decade of growth, Amazon has officially displaced Walmart as the world’s largest company by revenue.
Published
19 hours ago
on
June 18, 2026

Amazon Overtakes Walmart as America’s Biggest Company
See visuals like this from many other data creators on our Voronoi app. Download it for free on iOS or Android and discover incredible data-driven charts from a variety of trusted sources.
Key Takeaways
- Amazon generated $717 billion in revenue in its latest fiscal year, overtaking Walmart ($713 billion) as America’s largest company.
- Healthcare companies account for 10 of America’s 50 largest firms, generating a combined $2.7 trillion in revenue.
- Apple ($416 billion) and Alphabet ($403 billion) are the country’s largest technology companies by revenue.
For more than a decade, Walmart sat atop the Forbes 500 ranking. Now, that streak is over.
Amazon’s rise to the No. 1 spot reflects a broader shift in the American economy, where e-commerce, cloud computing, and digital services have become increasingly dominant drivers of corporate growth. The company is now just the fourth business to lead the Forbes 500 in the ranking’s 72-year history.
The visualization above ranks the 50 largest U.S. companies by revenue using data from the 2026 Forbes 500 list, via 50 Pros. Alongside Amazon’s ascent, the ranking highlights the enormous scale of healthcare, technology, energy, and financial firms across corporate America.
Amazon Ends Walmart’s 13-Year Run
In 2026, Amazon displaced Walmart as the world’s largest company by revenue, ending Walmart’s 13-year reign at the top.
This shift follows a decade in which Amazon’s revenue surged alongside the growth of e-commerce and online shopping. The company’s strategic investments also expanded over this period, including its $13.7 billion acquisition of grocery retailer Whole Foods in 2017.
This data table lists American companies based on total revenue in their most recent fiscal year.
| Rank | Company | Revenue of latest fiscal year (USD Billions) | Sector |
|---|---|---|---|
| 1 | Amazon | 716.9 | Retail |
| 2 | Walmart | 713.2 | Retail |
| 3 | UnitedHealth | 447.6 | Health Care |
| 4 | Apple | 416.2 | Technology |
| 5 | McKesson | 403.4 | Health Care |
| 6 | Alphabet | 402.8 | Technology |
| 7 | CVS Health | 402.1 | Health Care |
| 8 | Berkshire Hathaway | 371.4 | Financials |
| 9 | Exxon Mobil | 332.2 | Energy |
| 10 | Cencora | 321.3 | Health Care |
| 11 | Microsoft | 281.7 | Technology |
| 12 | Costco | 275.2 | Retail |
| 13 | Cigna | 274.9 | Health Care |
| 14 | Cardinal Health | 222.6 | Health Care |
| 15 | Nvidia | 215.9 | Technology |
| 16 | Meta | 201.0 | Technology |
| 17 | Elevance Health | 199.1 | Health Care |
| 18 | Centene | 194.8 | Health Care |
| 19 | Chevron | 189.0 | Energy |
| 20 | Ford Motor | 187.3 | Autos |
| 21 | General Motors | 185.0 | Autos |
| 22 | JPMorgan Chase | 182.4 | Financials |
| 23 | Home Depot | 164.7 | Retail |
| 24 | Fannie Mae | 152.7 | Financials |
| 25 | Walgreens | 147.7 | Retail |
| 26 | Kroger | 147.6 | Retail |
| 27 | Verizon | 138.2 | Media & Telecom |
| 28 | Marathon Petroleum | 132.7 | Energy |
| 29 | StoneX | 132.4 | Financials |
| 30 | Phillips 66 | 132.4 | Energy |
| 31 | Humana | 129.7 | Health Care |
| 32 | AT&T | 125.6 | Media & Telecom |
| 33 | Comcast | 123.7 | Media & Telecom |
| 34 | State Farm | 123.0 | Financials |
| 35 | Valero Energy | 122.7 | Energy |
| 36 | Freddie Mac | 122.1 | Financials |
| 37 | Dell Technologies | 113.5 | Technology |
| 38 | Bank of America | 113.1 | Financials |
| 39 | Target | 104.8 | Retail |
| 40 | Tesla | 94.8 | Autos |
| 41 | Walt Disney | 94.4 | Media & Telecom |
| 42 | Johnson & Johnson | 94.2 | Health Care |
| 43 | PepsiCo | 93.9 | Consumer Goods |
| 44 | Boeing | 89.5 | Industrials & Logistics |
| 45 | UPS | 88.7 | Industrials & Logistics |
| 46 | RTX | 88.6 | Industrials & Logistics |
| 47 | FedEx | 87.9 | Industrials & Logistics |
| 48 | Progressive | 87.7 | Financials |
| 49 | Lowe's | 86.3 | Retail |
| 50 | Energy Transfer | 85.5 | Energy |
The COVID-19 pandemic also affected the retail race between Amazon and Walmart. Lockdowns and isolation pushed many consumers toward online shopping at a scale not seen before, helping Amazon’s revenue jump by more than a third between 2019 and 2020.
Amazon’s displacement of Walmart makes the 1994-founded online retailer just the fourth company to top the Forbes 500 in the list’s 72-year history. Prior to Walmart, General Motors and ExxonMobil held the title. In 2025, GM’s revenue reached $185 billion, while ExxonMobil led the American oil industry at $332 billion.
Healthcare: Soaring Revenues
Healthcare companies generate over $2.7 trillion in combined revenue across America’s 50 largest companies, led by UnitedHealthcare at $448 billion.
Nearly one out of every five dollars in the U.S. economy is spent in the healthcare sector, which is reflected in the massive revenues of companies like CVS Health ($402 billion), Cigna ($275 billion), and Johnson & Johnson ($94 billion).
Technological advancements and an aging U.S. population have driven growth in the sector, with firms like UnitedHealthcare and Cigna each posting over 10% year-over-year revenue growth.
America’s Core Sectors
The technology sector generated over $1.6 trillion in revenue from just its six top firms, with Apple ($416 billion) and Google parent company Alphabet ($403 billion) leading the way.
Meanwhile, Berkshire Hathaway ($371 billion) posted the highest revenue among financial firms, followed by JPMorgan Chase ($182 billion) and government-sponsored enterprise Fannie Mae ($153 billion).
Notably, the only consumer goods company to break into America’s top 50 firms by revenue is PepsiCo, which generated $94 billion in revenue in the 2025 fiscal year. This puts the food and beverage company ahead of industrial and logistics giants like Boeing ($90 billion) and United Parcel Service ($89 billion).
Learn More on the Voronoi App 
If you enjoyed today’s post, check out Amazon’s Profit Hits New Highs as Cost Cutting Bears Fruit on Voronoi, the new app from Visual Capitalist.
Business
Ranked: SpaceX vs. The Largest Public Space Companies
Fresh off the largest IPO in history, SpaceX is worth $2.46 trillion, which is about 10 times every other public space company combined.
Published
3 days ago
on
June 16, 2026

Ranked: SpaceX vs. The Largest Public Space Companies
See visuals like this from many other data creators on our Voronoi app. Download it for free on iOS or Android and discover incredible data-driven charts from a variety of trusted sources.
Key Takeaways
- SpaceX’s $2.46 trillion market cap is larger than the combined value of the next 20 biggest public space companies, which together are worth about $235 billion.
- Rocket Lab ranks a distant second at $68.6 billion, while no other pure-play space company is worth more than $35 billion.
- SpaceX’s post-IPO surge has turned a once-private industry leader into one of the world’s most valuable companies.
The space industry has never seen a company this dominant.
Following its Nasdaq debut, SpaceX reached a market capitalization of $2.46 trillion. That makes it worth roughly 10.5 times more than the next 20 largest publicly traded pure-play space companies combined.
This graphic compares SpaceX against every public space company worth at least $1 billion, illustrating just how much the industry’s center of gravity has shifted toward a single firm.
The data comes from CompaniesMarketCap and reflects market capitalizations as of June 15, 2026. Diversified aerospace and defense companies such as Boeing and Lockheed Martin are excluded.
SpaceX Dwarfs the Entire Public Space Industry
The gap between SpaceX and the rest of the industry is difficult to overstate.
At $2.46 trillion, SpaceX is worth more than the next 20 largest public pure-play space companies combined by roughly $2.2 trillion. Put differently, investors value SpaceX at more than 10 times the rest of the listed space sector.
The data table below shows the largest public pure-play companies in the space industry with a market capitalization over $1 billion:
| Rank | Company | Market Capitalization (USD Billions) |
|---|---|---|
| 1 | SpaceX | $2,460.0 |
| 2 | Rocket Lab | $68.6 |
| 3 | AST SpaceMobile | $34.1 |
| 4 | EchoStar | $33.1 |
| 5 | China Satellite Communications | $20.5 |
| 6 | Planet Labs | $10.9 |
| 7 | Globalstar | $10.6 |
| 8 | Viasat | $9.6 |
| 9 | SKY Perfect JSAT | $5.7 |
| 10 | Firefly Aerospace | $5.5 |
| 11 | MDA Space | $5.3 |
| 12 | Iridium Communications | $4.8 |
| 13 | Intuitive Machines | $4.1 |
| 14 | York Space Systems | $4.0 |
| 15 | SES | $3.8 |
| 16 | Eutelsat | $3.7 |
| 17 | Redwire | $3.0 |
| 18 | Telesat | $2.5 |
| 19 | Voyager Technologies | $2.4 |
| 20 | Astroscale | $1.3 |
| 21 | BlackSky Technology | $1.2 |
Outside of SpaceX, the industry’s scale drops dramatically. Rocket Lab is the second-largest pure-play space company at $68.6 billion, meaning SpaceX is worth nearly 36 Rocket Labs. AST SpaceMobile and EchoStar follow at roughly $34 billion each, highlighting how concentrated investor value has become in a single company.
The roster spans the full space economy: satellite communications, rocket launch, Earth observation, and lunar and in-orbit services.
It is also overwhelmingly American, with U.S. firms claiming most of the top 20 and the rest split among China, Japan, Canada, and Europe.
The Largest IPO in History and a New Trillionaire
SpaceX’s dominance reflects what no rival can match: a reusable rocket fleet that flies more orbital missions than any other operator, paired with Starlink, the largest satellite-internet constellation in operation. The result is a single company that towers over a sector otherwise filled with specialized, single-digit-billion-dollar players.
SpaceX’s debut wasn’t just big for the space sector: it was the largest IPO ever recorded. The company priced its shares at $135 on June 12, raising roughly $75 billion and eclipsing Saudi Aramco’s $25.6 billion record from 2019. That initial price valued SpaceX at about $1.77 trillion; three days later, the stock was trading near $178, lifting its market cap to $2.46 trillion.
The listing also crystallized a milestone of its own. By revaluing Elon Musk’s roughly 42% SpaceX stake on the open market, it pushed his net worth past $1 trillion and made him the world’s first trillionaire.
SpaceX’s Valuation Bakes In Big Expectations
SpaceX’s price tag assumes enormous future growth. At $2.46 trillion, the company trades at roughly 130 times its 2025 revenue of $18.7 billion, a year in which it posted a $4.9 billion net loss.
The engine behind that optimism is Starlink. The satellite-internet business generated 61% of SpaceX’s 2025 revenue and earned a $4.4 billion operating profit, even as the company overall ran a $2.6 billion operating loss.
For now, investors are betting that Starlink’s growth and SpaceX’s launch dominance will eventually justify a valuation larger than most of the world’s biggest companies.
Learn More on the Voronoi App
To learn more about SpaceX, check out this visualization on its growing number of rocket launches on Voronoi.