Countries by Share of the Global Economy
As 2022 comes to a close we can recap many historic milestones of the year, like the Earth’s population hitting 8 billion and the global economy surpassing $100 trillion.
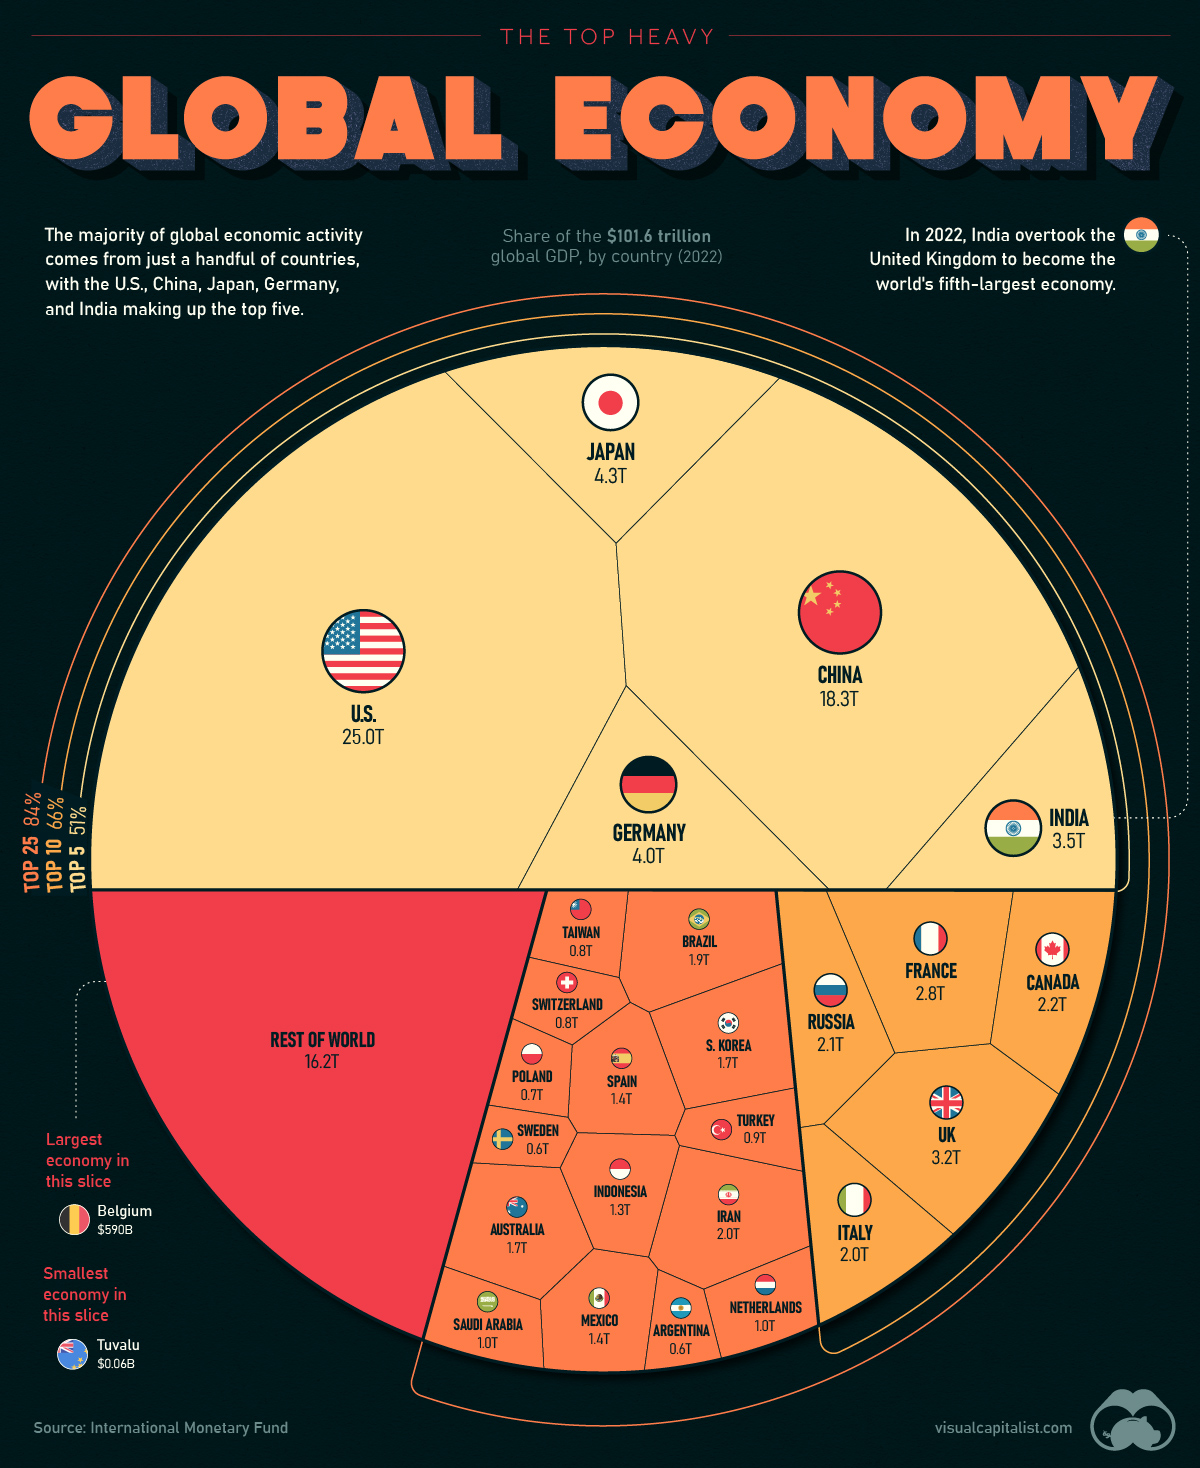
In this chart, we visualize the world’s GDP using data from the IMF, showcasing the biggest economies and the share of global economic activity that they make up.
ℹ️ Gross Domestic Product (GDP) is a broad indicator of the economic activity within a country. It measures the total value of economic output—goods and services—produced within a given time frame by both the private and public sectors.
The GDP Heavyweights
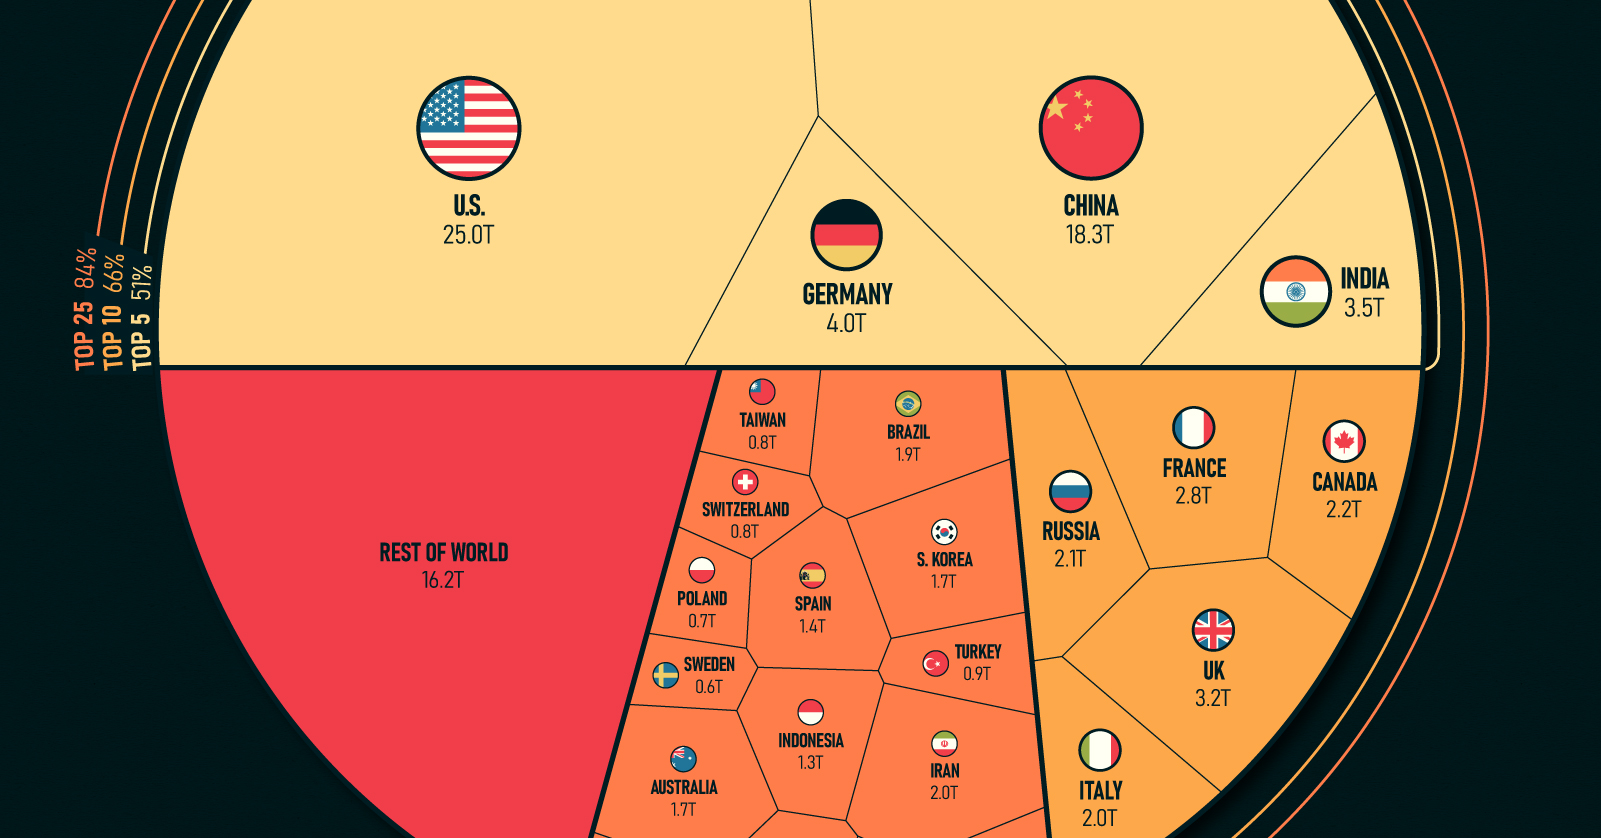
The global economy can be thought of as a pie, with the size of each slice representing the share of global GDP contributed by each country. Currently, the largest slices of the pie are held by the United States, China, Japan, Germany, and India, which together account for more than half of global GDP.
Here’s a look at every country’s share of the world’s $101.6 trillion economy:
| Rank | Country | GDP (Billions, USD) |
|---|---|---|
| #1 | 🇺🇸 United States | $25,035.2 |
| #2 | 🇨🇳 China | $18,321.2 |
| #3 | 🇯🇵 Japan | $4,300.6 |
| #4 | 🇩🇪 Germany | $4,031.1 |
| #5 | 🇮🇳 India | $3,468.6 |
| #6 | 🇬🇧 United Kingdom | $3,198.5 |
| #7 | 🇫🇷 France | $2,778.1 |
| #8 | 🇨🇦 Canada | $2,200.4 |
| #9 | 🇷🇺 Russia | $2,133.1 |
| #10 | 🇮🇹 Italy | $1,997.0 |
| #11 | 🇮🇷 Iran | $1,973.7 |
| #12 | 🇧🇷 Brazil | $1,894.7 |
| #13 | 🇰🇷 South Korea | $1,734.2 |
| #14 | 🇦🇺 Australia | $1,724.8 |
| #15 | 🇲🇽 Mexico | $1,424.5 |
| #16 | 🇪🇸 Spain | $1,389.9 |
| #17 | 🇮🇩 Indonesia | $1,289.4 |
| #18 | 🇸🇦 Saudi Arabia | $1,010.6 |
| #19 | 🇳🇱 Netherlands | $990.6 |
| #20 | 🇹🇷 Turkey | $853.5 |
| #21 | 🇹🇼 Taiwan | $828.7 |
| #22 | 🇨🇭 Switzerland | $807.4 |
| #23 | 🇵🇱 Poland | $716.3 |
| #24 | 🇦🇷 Argentina | $630.7 |
| #25 | 🇸🇪 Sweden | $603.9 |
| #26 | 🇧🇪 Belgium | $589.5 |
| #27 | 🇹🇭 Thailand | $534.8 |
| #28 | 🇮🇱 Israel | $527.2 |
| #29 | 🇮🇪 Ireland | $519.8 |
| #30 | 🇳🇴 Norway | $504.7 |
| #31 | 🇳🇬 Nigeria | $504.2 |
| #32 | 🇦🇪 United Arab Emirates | $503.9 |
| #33 | 🇪🇬 Egypt | $469.1 |
| #34 | 🇦🇹 Austria | $468.0 |
| #35 | 🇧🇩 Bangladesh | $460.8 |
| #36 | 🇲🇾 Malaysia | $434.1 |
| #37 | 🇸🇬 Singapore | $423.6 |
| #38 | 🇻🇳 Vietnam | $413.8 |
| #39 | 🇿🇦 South Africa | $411.5 |
| #40 | 🇵🇭 Philippines | $401.7 |
| #41 | 🇩🇰 Denmark | $386.7 |
| #42 | 🇵🇰 Pakistan | $376.5 |
| #43 | 🇭🇰 Hong Kong SAR | $368.4 |
| #44 | 🇨🇴 Colombia | $342.9 |
| #45 | 🇨🇱 Chile | $310.9 |
| #46 | 🇷🇴 Romania | $299.9 |
| #47 | 🇨🇿 Czech Republic | $295.6 |
| #48 | 🇮🇶 Iraq | $282.9 |
| #49 | 🇫🇮 Finland | $281.4 |
| #50 | 🇵🇹 Portugal | $255.9 |
| #51 | 🇳🇿 New Zealand | $242.7 |
| #52 | 🇵🇪 Peru | $239.3 |
| #53 | 🇰🇿 Kazakhstan | $224.3 |
| #54 | 🇬🇷 Greece | $222.0 |
| #55 | 🇶🇦 Qatar | $221.4 |
| #56 | 🇩🇿 Algeria | $187.2 |
| #57 | 🇭🇺 Hungary | $184.7 |
| #58 | 🇰🇼 Kuwait | $183.6 |
| #59 | 🇲🇦 Morocco | $142.9 |
| #60 | 🇦🇴 Angola | $124.8 |
| #61 | 🇵🇷 Puerto Rico | $118.7 |
| #62 | 🇪🇨 Ecuador | $115.5 |
| #63 | 🇰🇪 Kenya | $114.9 |
| #64 | 🇸🇰 Slovakia | $112.4 |
| #65 | 🇩🇴 Dominican Republic | $112.4 |
| #66 | 🇪🇹 Ethiopia | $111.2 |
| #67 | 🇴🇲 Oman | $109.0 |
| #68 | 🇬🇹 Guatemala | $91.3 |
| #69 | 🇧🇬 Bulgaria | $85.0 |
| #70 | 🇱🇺 Luxembourg | $82.2 |
| #71 | 🇻🇪 Venezuela | $82.1 |
| #72 | 🇧🇾 Belarus | $79.7 |
| #73 | 🇺🇿 Uzbekistan | $79.1 |
| #74 | 🇹🇿 Tanzania | $76.6 |
| #75 | 🇬🇭 Ghana | $76.0 |
| #76 | 🇹🇲 Turkmenistan | $74.4 |
| #77 | 🇱🇰 Sri Lanka | $73.7 |
| #78 | 🇺🇾 Uruguay | $71.2 |
| #79 | 🇵🇦 Panama | $71.1 |
| #80 | 🇦🇿 Azerbaijan | $70.1 |
| #81 | 🇭🇷 Croatia | $69.4 |
| #82 | 🇨🇮 Côte d'Ivoire | $68.6 |
| #83 | 🇨🇷 Costa Rica | $68.5 |
| #84 | 🇱🇹 Lithuania | $68.0 |
| #85 | 🇨🇩 Democratic Republic of the Congo | $63.9 |
| #86 | 🇷🇸 Serbia | $62.7 |
| #87 | 🇸🇮 Slovenia | $62.2 |
| #88 | 🇲🇲 Myanmar | $59.5 |
| #89 | 🇺🇬 Uganda | $48.4 |
| #90 | 🇯🇴 Jordan | $48.1 |
| #91 | 🇹🇳 Tunisia | $46.3 |
| #92 | 🇨🇲 Cameroon | $44.2 |
| #93 | 🇧🇭 Bahrain | $43.5 |
| #94 | 🇧🇴 Bolivia | $43.4 |
| #95 | 🇸🇩 Sudan | $42.8 |
| #96 | 🇵🇾 Paraguay | $41.9 |
| #97 | 🇱🇾 Libya | $40.8 |
| #98 | 🇱🇻 Latvia | $40.6 |
| #99 | 🇪🇪 Estonia | $39.1 |
| #100 | 🇳🇵 Nepal | $39.0 |
| #101 | 🇿🇼 Zimbabwe | $38.3 |
| #102 | 🇸🇻 El Salvador | $32.0 |
| #103 | 🇵🇬 Papua New Guinea | $31.4 |
| #104 | 🇭🇳 Honduras | $30.6 |
| #105 | 🇹🇹 Trinidad and Tobago | $29.3 |
| #106 | 🇰🇭 Cambodia | $28.3 |
| #107 | 🇮🇸 Iceland | $27.7 |
| #108 | 🇾🇪 Yemen | $27.6 |
| #109 | 🇸🇳 Senegal | $27.5 |
| #110 | 🇿🇲 Zambia | $27.0 |
| #111 | 🇨🇾 Cyprus | $26.7 |
| #112 | 🇬🇪 Georgia | $25.2 |
| #113 | 🇧🇦 Bosnia and Herzegovina | $23.7 |
| #114 | 🇲🇴 Macao SAR | $23.4 |
| #115 | 🇬🇦 Gabon | $22.2 |
| #116 | 🇭🇹 Haiti | $20.2 |
| #117 | 🇬🇳 Guinea | $19.7 |
| #118 | West Bank and Gaza | $18.8 |
| #119 | 🇧🇳 Brunei | $18.5 |
| #120 | 🇲🇱 Mali | $18.4 |
| #121 | 🇧🇫 Burkina Faso | $18.3 |
| #122 | 🇦🇱 Albania | $18.3 |
| #123 | 🇧🇼 Botswana | $18.0 |
| #124 | 🇲🇿 Mozambique | $17.9 |
| #125 | 🇦🇲 Armenia | $17.7 |
| #126 | 🇧🇯 Benin | $17.5 |
| #127 | 🇲🇹 Malta | $17.2 |
| #128 | 🇬🇶 Equatorial Guinea | $16.9 |
| #129 | 🇱🇦 Laos | $16.3 |
| #130 | 🇯🇲 Jamaica | $16.1 |
| #131 | 🇲🇳 Mongolia | $15.7 |
| #132 | 🇳🇮 Nicaragua | $15.7 |
| #133 | 🇲🇬 Madagascar | $15.1 |
| #134 | 🇬🇾 Guyana | $14.8 |
| #135 | 🇳🇪 Niger | $14.6 |
| #136 | 🇨🇬 Republic of Congo | $14.5 |
| #137 | 🇲🇰 North Macedonia | $14.1 |
| #138 | 🇲🇩 Moldova | $14.0 |
| #139 | 🇹🇩 Chad | $12.9 |
| #140 | 🇧🇸 The Bahamas | $12.7 |
| #141 | 🇳🇦 Namibia | $12.5 |
| #142 | 🇷🇼 Rwanda | $12.1 |
| #143 | 🇲🇼 Malawi | $11.6 |
| #144 | 🇲🇺 Mauritius | $11.5 |
| #145 | 🇲🇷 Mauritania | $10.1 |
| #146 | 🇹🇯 Tajikistan | $10.0 |
| #147 | 🇰🇬 Kyrgyzstan | $9.8 |
| #148 | 🇽🇰 Kosovo | $9.2 |
| #149 | 🇸🇴 Somalia | $8.4 |
| #150 | 🇹🇬 Togo | $8.4 |
| #151 | 🇲🇪 Montenegro | $6.1 |
| #152 | 🇲🇻 Maldives | $5.9 |
| #153 | 🇧🇧 Barbados | $5.8 |
| #154 | 🇫🇯 Fiji | $4.9 |
| #155 | 🇸🇸 South Sudan | $4.8 |
| #156 | 🇸🇿 Eswatini | $4.7 |
| #157 | 🇸🇱 Sierra Leone | $4.1 |
| #158 | 🇱🇷 Liberia | $3.9 |
| #159 | 🇩🇯 Djibouti | $3.7 |
| #160 | 🇧🇮 Burundi | $3.7 |
| #161 | 🇦🇼 Aruba | $3.5 |
| #162 | 🇦🇩 Andorra | $3.3 |
| #163 | 🇸🇷 Suriname | $3.0 |
| #164 | 🇧🇹 Bhutan | $2.7 |
| #165 | 🇧🇿 Belize | $2.7 |
| #166 | 🇱🇸 Lesotho | $2.5 |
| #167 | 🇨🇫 Central African Republic | $2.5 |
| #168 | 🇹🇱 Timor-Leste | $2.4 |
| #169 | 🇪🇷 Eritrea | $2.4 |
| #170 | 🇬🇲 The Gambia | $2.1 |
| #171 | 🇨🇻 Cabo Verde | $2.1 |
| #172 | 🇸🇨 Seychelles | $2.0 |
| #173 | 🇱🇨 St. Lucia | $2.0 |
| #174 | 🇦🇬 Antigua and Barbuda | $1.7 |
| #175 | 🇬🇼 Guinea-Bissau | $1.6 |
| #176 | 🇸🇲 San Marino | $1.6 |
| #177 | 🇸🇧 Solomon Islands | $1.6 |
| #178 | 🇰🇲 Comoros | $1.2 |
| #179 | 🇬🇩 Grenada | $1.2 |
| #180 | 🇰🇳 St. Kitts and Nevis | $1.1 |
| #181 | 🇻🇺 Vanuatu | $1.0 |
| #182 | 🇻🇨 St. Vincent and the Grenadines | $1.0 |
| #183 | 🇼🇸 Samoa | $0.83 |
| #184 | 🇩🇲 Dominica | $0.60 |
| #185 | 🇸🇹 São Tomé and Príncipe | $0.51 |
| #186 | 🇹🇴 Tonga | $0.50 |
| #187 | 🇫🇲 Micronesia | $0.43 |
| #188 | 🇲🇭 Marshall Islands | $0.27 |
| #189 | 🇵🇼 Palau | $0.23 |
| #190 | 🇰🇮 Kiribati | $0.21 |
| #191 | 🇳🇷 Nauru | $0.13 |
| #192 | 🇹🇻 Tuvalu | $0.06 |
| #193 | 🇺🇦 Ukraine | Data not available |
| Total World GDP | $101,559.3 |
Just five countries make up more than half of the world’s entire GDP in 2022: the U.S., China, Japan, India, and Germany. Interestingly, India replaced the UK this year as a top five economy.
Adding on another five countries (the top 10) makes up 66% of the global economy, and the top 25 countries comprise 84% of global GDP.
The World’s Smallest Economies
The rest of the world — the remaining 167 nations — make up 16% of global GDP. Many of the smallest economies are islands located in Oceania.
Here’s a look at the 20 smallest economies in the world:
| Country | GDP (Billions, USD) |
|---|---|
| 🇹🇻 Tuvalu | $0.06 |
| 🇳🇷 Nauru | $0.13 |
| 🇰🇮 Kiribati | $0.21 |
| 🇵🇼 Palau | $0.23 |
| 🇲🇭 Marshall Islands | $0.27 |
| 🇫🇲 Micronesia | $0.43 |
| 🇹🇴 Tonga | $0.50 |
| 🇸🇹 São Tomé and Príncipe | $0.51 |
| 🇩🇲 Dominica | $0.60 |
| 🇼🇸 Samoa | $0.83 |
| 🇻🇨 St. Vincent and the Grenadines | $0.95 |
| 🇻🇺 Vanuatu | $0.98 |
| 🇰🇳 St. Kitts and Nevis | $1.12 |
| 🇬🇩 Grenada | $1.19 |
| 🇰🇲 Comoros | $1.24 |
| 🇸🇧 Solomon Islands | $1.60 |
| 🇸🇲 San Marino | $1.62 |
| 🇬🇼 Guinea-Bissau | $1.62 |
| 🇦🇬 Antigua and Barbuda | $1.69 |
| 🇱🇨 St. Lucia | $1.97 |
Tuvalu has the smallest GDP of any country at just $64 million. Tuvalu is one of a dozen nations with a GDP of less than one billion dollars.
The Global Economy in 2023
Heading into 2023, there is much economic uncertainty. Many experts are anticipating a brief recession, although opinions differ on the definition of “brief”.
Some experts believe that China will buck the trend of economic downturn. If this prediction comes true, the country could own an even larger slice of the global GDP pie in the near future.
See what hundreds of experts are predicting for 2023 with our Global Forecast Series.
Where does this data come from?
Source: IMF (International Monetary Fund)
Data note: Due to conflict and other issues, some countries are not included in this data set (e.g. Ukraine, Syria, Afghanistan). Major sources for GDP data differ widely on the size of Iran’s economy. It’s worth noting that this data from IMF ranks Iran’s GDP much higher than World Bank or the UN.
Markets
Ranked: The World’s Most Valuable Brands in 2026
The world’s most valuable brands in 2026 ranked, led by Apple, Microsoft, and Google, with Nvidia climbing fast.
Published
3 weeks ago
on
March 6, 2026

Ranked: The World’s Most Valuable Brands in 2026
See visuals like this from many other data creators on our Voronoi app. Download it for free on iOS or Android and discover incredible data-driven charts from a variety of trusted sources.
Key Takeaways
- Apple remains the world’s most valuable brand in 2026 at $608B, followed by Microsoft ($565B) and Google ($433B).
- Nvidia jumps four spots to become the #5 global brand, fueled by the AI boom.
Technology brands dominate the global rankings in 2026, with companies like Apple, Microsoft, and Google collectively representing more than $1.6 trillion in brand value.
The visualization above compares the 50 most valuable brands in the world, with bubble sizes scaled by brand value. The data comes from Brand Finance, which evaluates brands based on marketing investment, brand strength, and overall financial performance.
From consumer platforms and e-commerce giants to AI chip leaders like Nvidia, digital ecosystems now dominate the world’s most valuable brands.
Big Tech Tops the List
Technology and digital platforms dominate the upper ranks.
Apple has ranked as the world’s most valuable brand since 2024, with its brand value reaching $608 billion in 2026.
That means that Apple’s brand alone is worth more than the entire market capitalization of almost every non-tech company in the world, and the GDPs of most countries.
| Rank | Brand | Sector | Brand Value |
|---|---|---|---|
| 1 | 🇺🇸 Apple | Electronics | 608B |
| 2 | 🇺🇸 Microsoft | Internet & Software | 565B |
| 3 | Media | 433B | |
| 4 | 🇺🇸 Amazon | E-Commerce | 370B |
| 5 | 🇺🇸 NVIDIA | Semiconductors | 184B |
| 6 | 🇨🇳 TikTok | Media | 154B |
| 7 | 🇺🇸 Walmart | Retail | 141B |
| 8 | 🇰🇷 Samsung | Diversified | 119B |
| 9 | Media | 107B | |
| 10 | 🇨🇳 State Grid Corporation of China | Utilities | 102B |
| 11 | 🇩🇪 T | Telecoms | 96B |
| 12 | 🇨🇳 ICBC | Banking | 91B |
| 13 | Media | 81B | |
| 14 | 🇨🇳 China Construction Bank | Banking | 77B |
| 15 | 🇺🇸 Home Depot | Retail | 73B |
| 16 | 🇺🇸 Verizon | Telecoms | 73B |
| 17 | 🇨🇳 Bank of China | Banking | 71B |
| 18 | 🇺🇸 Oracle | Internet & Software | 68B |
| 19 | 🇨🇳 Agricultural Bank of China | Banking | 63B |
| 20 | 🇯🇵 Toyota | Automobiles | 63B |
| 21 | 🇩🇪 Allianz Group | Insurance | 61B |
| 22 | 🇨🇳 Moutai | Spirits | 60B |
| 23 | 🇺🇸 American Express | Commercial Services | 57B |
| 24 | 🇺🇸 UnitedHealthcare | Healthcare Services | 55B |
| 25 | 🇺🇸 AT&T | Telecoms | 54B |
| 26 | 🇺🇸 Costco | Retail | 53B |
| 27 | 🇨🇳 Tencent | Media | 52B |
| 28 | 🇬🇧 Shell | Oil & Gas | 52B |
| 29 | 🇺🇸 Disney | Media | 51B |
| 30 | 🇺🇸 Uber | Mobility | 50B |
| 31 | 🇨🇳 China Mobile | Telecoms | 49B |
| 32 | 🇨🇳 Ping An | Insurance | 49B |
| 33 | Media | 48B | |
| 34 | 🇺🇸 Bank of America | Banking | 48B |
| 35 | 🇸🇦 Aramco | Oil & Gas | 47B |
| 36 | 🇩🇪 Mercedes-Benz | Automobiles | 47B |
| 37 | 🇺🇸 Coca-Cola | Soft Drinks | 46B |
| 38 | 🇰🇷 Hyundai Group | Diversified | 46B |
| 39 | 🇺🇸 Chase | Banking | 45B |
| 40 | 🇺🇸 VISA | Commercial Services | 44B |
| 41 | 🇩🇪 BMW | Automobiles | 44B |
| 42 | 🇺🇸 Deloitte | Commercial Services | 43B |
| 43 | 🇺🇸 McDonald's | Restaurants | 43B |
| 44 | 🇺🇸 Accenture | IT Services | 42B |
| 45 | 🇯🇵 NTT Group | Telecoms | 42B |
| 46 | 🇺🇸 Wells Fargo | Banking | 40B |
| 47 | 🇹🇼 TSMC | Semiconductors | 39B |
| 48 | 🇺🇸 Lowe's | Retail | 39B |
| 49 | 🇺🇸 YouTube | Media | 38B |
| 50 | 🇩🇪 SAP | Internet & Software | 38B |
Microsoft ($565 billion), Google ($433 billion), Amazon ($370 billion), and Nvidia ($184 billion) round out the top five, underscoring the continued strength of e-commerce and semiconductors.
Nvidia’s four-place jump since 2025 is particularly notable. As demand for AI chips and data center infrastructure accelerates, the company’s brand has strengthened alongside its financial performance.
Further down the list, companies like Oracle, SAP, TSMC, and Samsung show how critical enterprise software and chipmaking have become to the global economy.
China’s Strong Presence
Chinese brands continue to feature prominently in the top 50. TikTok ranks sixth globally at $154 billion, making it the highest-ranked Chinese brand in 2026.
Major state-backed banks—including ICBC, China Construction Bank, Bank of China, and Agricultural Bank of China—also rank among the world’s most valuable brands.
Media and tech platforms such as Tencent and WeChat further reinforce China’s growing digital influence.
Finance, Retail, and Energy Hold Their Ground
Beyond tech, traditional sectors remain highly competitive. Walmart ($141 billion), Home Depot, Costco, and Lowe’s show the enduring power of large-scale retail.
Banking and financial services brands—including Bank of America, Chase, American Express, and Visa—collectively represent hundreds of billions in brand value. Insurance giants like Allianz and Ping An also rank highly.
The list also includes energy majors such as Shell and Aramco.
Learn More on the Voronoi App 
If you enjoyed today’s post, check out Ranked: The World’s Top Startup Hubs on Voronoi, the new app from Visual Capitalist.
Markets
Ranked: The World’s 50 Most Valuable Companies in 2026
AI has propelled semiconductor companies to the top in 2026. See how Nvidia, TSMC, and other chipmakers rank among the world’s most valuable firms.
Published
3 weeks ago
on
March 2, 2026

The World’s 50 Most Valuable Companies in 2026
See visuals like this from many other data creators on our Voronoi app. Download it for free on iOS or Android and discover incredible data-driven charts from a variety of trusted sources.
Key Takeaways
- Nvidia leads at $4.8 trillion, followed by Apple ($4.0 trillion) and Alphabet ($3.8 trillion).
- Tech firms represent seven of the top 10 companies by market cap.
- Along with Nvidia, three other AI-related semiconductor companies—TSMC, Broadcom, and ASML—rank in the top 20 most valuable firms.
Nvidia, with a $4.8 trillion market valuation, is the world’s most valuable company in 2026.
The company has once again surpassed Apple and Alphabet as record sales lift its valuation, despite AI bubble fears. Meanwhile, TSMC’s $2 trillion market cap now exceeds both Meta Platforms and Tesla, ranking in sixth globally.
Using data from CompaniesMarketCap, this graphic shows the 50 most valuable companies worldwide in 2026.
The Top 50 Companies in 2026
Here are the largest companies by market capitalization as of February 25, 2026:
| Rank | Name | Country | Market Cap |
|---|---|---|---|
| 1 | Nvidia | 🇺🇸 U.S. | $4,769,090,895,872 |
| 2 | Apple | 🇺🇸 U.S. | $4,030,215,225,344 |
| 3 | Alphabet | 🇺🇸 U.S. | $3,786,845,192,192 |
| 4 | Microsoft | 🇺🇸 U.S. | $2,976,667,402,240 |
| 5 | Amazon | 🇺🇸 U.S. | $2,261,686,681,600 |
| 6 | TSMC | 🇹🇼 Taiwan | $2,009,122,209,792 |
| 7 | Saudi Aramco | 🇸🇦 Saudi Arabia | $1,659,869,263,655 |
| 8 | Meta Platforms | 🇺🇸 U.S. | $1,653,772,779,520 |
| 9 | Broadcom | 🇺🇸 U.S. | $1,575,548,878,848 |
| 10 | Tesla | 🇺🇸 U.S. | $1,566,227,562,496 |
| 11 | Berkshire Hathaway | 🇺🇸 U.S. | $1,067,125,637,120 |
| 12 | Walmart | 🇺🇸 U.S. | $1,002,825,187,328 |
| 13 | Eli Lilly | 🇺🇸 U.S. | $971,747,753,984 |
| 14 | Samsung | 🇰🇷 South Korea | $953,387,784,196 |
| 15 | JPMorgan Chase | 🇺🇸 U.S. | $818,792,038,400 |
| 16 | Exxon Mobil | 🇺🇸 U.S. | $629,201,108,992 |
| 17 | Visa | 🇺🇸 U.S. | $603,784,871,936 |
| 18 | Tencent | 🇨🇳 China | $602,976,288,768 |
| 19 | ASML | 🇳🇱 Netherlands | $592,511,303,680 |
| 20 | Johnson & Johnson | 🇺🇸 U.S. | $591,292,792,832 |
| 21 | SK Hynix | 🇰🇷 South Korea | $492,511,926,210 |
| 22 | Micron Technology | 🇺🇸 U.S. | $482,640,887,808 |
| 23 | Mastercard | 🇺🇸 U.S. | $455,227,998,208 |
| 24 | Costco | 🇺🇸 U.S. | $441,631,375,360 |
| 25 | Oracle | 🇺🇸 U.S. | $425,078,030,336 |
| 26 | AbbVie | 🇺🇸 U.S. | $400,878,174,208 |
| 27 | Procter & Gamble | 🇺🇸 U.S. | $382,102,667,264 |
| 28 | Roche | 🇨🇭 Switzerland | $380,012,805,029 |
| 29 | Bank of America | 🇺🇸 U.S. | $377,648,578,560 |
| 30 | Home Depot | 🇺🇸 U.S. | $373,943,992,320 |
| 31 | ICBC | 🇨🇳 China | $369,137,809,154 |
| 32 | Chevron | 🇺🇸 U.S. | $368,560,832,512 |
| 33 | Alibaba | 🇨🇳 China | $363,649,957,888 |
| 34 | General Electric | 🇺🇸 U.S. | $361,938,288,640 |
| 35 | Caterpillar | 🇺🇸 U.S. | $358,505,119,744 |
| 36 | Netflix | 🇺🇸 U.S. | $350,804,246,528 |
| 37 | Coca-Cola | 🇺🇸 U.S. | $346,150,469,632 |
| 38 | AMD | 🇺🇸 U.S. | $343,772,135,424 |
| 39 | Agricultural Bank of China | 🇨🇳 China | $331,706,101,844 |
| 40 | China Construction Bank | 🇨🇳 China | $329,442,725,971 |
| 41 | LVMH | 🇫🇷 France | $324,094,895,625 |
| 42 | HSBC | 🇬🇧 United Kingdom | $323,268,870,144 |
| 43 | Novartis | 🇨🇭 Switzerland | $322,706,767,872 |
| 44 | Palantir | 🇺🇸 U.S. | $320,938,967,040 |
| 45 | AstraZeneca | 🇬🇧 United Kingdom | $319,598,690,304 |
| 46 | Toyota | 🇯🇵 Japan | $315,160,494,080 |
| 47 | Applied Materials | 🇺🇸 U.S. | $313,424,740,352 |
| 48 | Lam Research | 🇺🇸 U.S. | $313,366,904,832 |
| 49 | Cisco | 🇺🇸 U.S. | $312,610,619,392 |
| 50 | Merck | 🇺🇸 U.S. | $305,828,593,664 |
As the largest publicly-traded company in the world, Nvidia recently posted a record $68.1 billion in quarterly earnings, up 94% year-over-year.
With OpenAI, Oracle, and Microsoft among its largest customers, a string of strong earnings reports has pushed its valuation close to a $5 trillion market capitalization. Still, investor skepticism has tempered share price gains amid concerns about overvaluation.
Apple, Alphabet, and Microsoft follow, each valued at roughly $3 trillion or more.
Saudi Aramco, one of only two non-U.S. companies in the top 10, ranks seventh with a $1.7 trillion valuation. Weaker oil prices have weighed on its performance, with shares down about 30% from their 2022 peak.
Meanwhile, chip designer Broadcom ranks ninth at nearly $1.6 trillion. In addition to producing custom AI accelerator chips for OpenAI and Meta, it designed Google’s tensor processing units (TPUs).
Today, Broadcom is increasingly emerging as a competitor to Nvidia, alongside companies such as Google (#3) and AMD (#38) as Big Tech prepares to spend $650 billion on AI infrastructure in 2026 alone.
Learn More on the Voronoi App
To learn more about this topic, check out this graphic on the largest U.S. semiconductor firms by market cap.