Software Development Jobs in the U.S. on the Decline
This was originally posted on our Voronoi app. Download the app for free on iOS or Android and discover incredible data-driven charts from a variety of trusted sources.
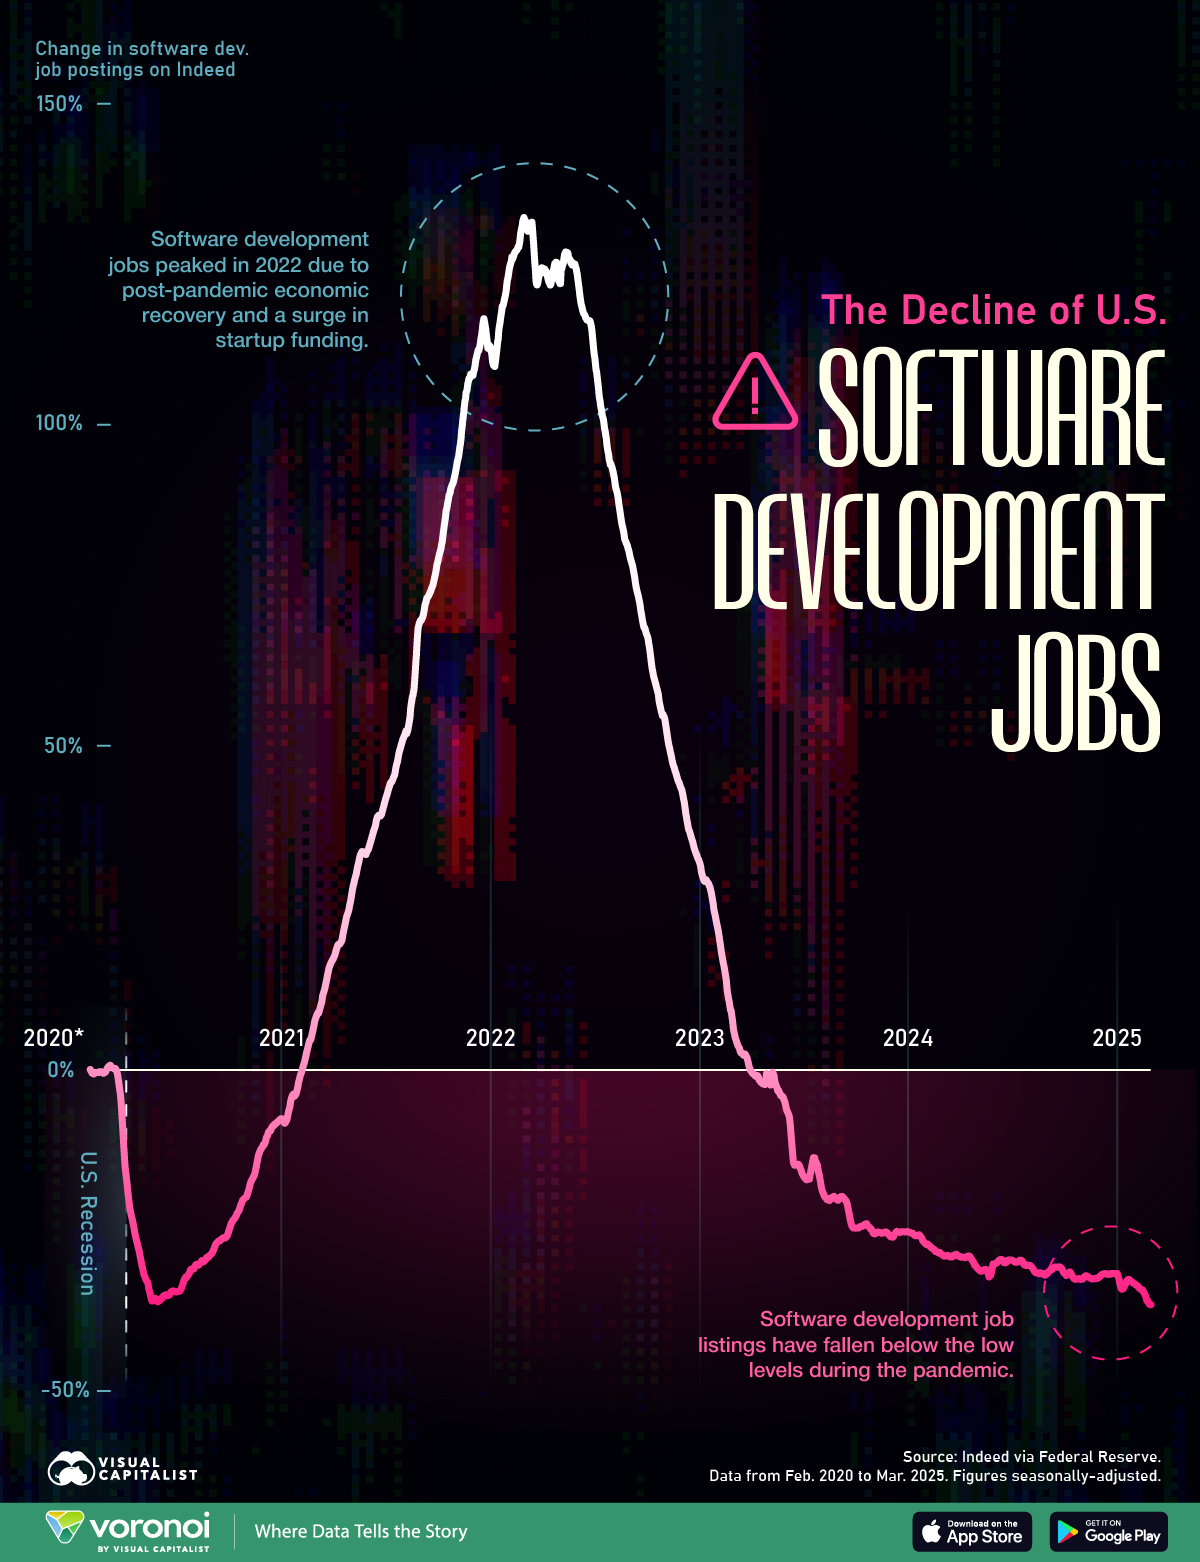
The surge in tech hiring in the U.S. in 2021 and 2022 represented one of the most aggressive talent grabs in industry history, only to be followed by widespread layoffs and hiring freezes as economic headwinds and post-pandemic corrections hit the sector.
This dramatic swing has reshaped the software development job market, leaving both companies and developers to navigate a new landscape of cautious growth and strategic hiring.
This graphic shows the percent change in software development job postings on Indeed U.S. since Feb. 1, 2020 to Feb. 28, 2025.
The data comes from Indeed via the Federal Reserve and is updated as of March 2025. Figures are seasonally-adjusted.
The U.S. Software Developer Hiring Boom Is Over
Below, we show the percent change in software development job postings on Indeed U.S. since Feb. 1, 2020 to Feb. 28, 2025.
| Date | U.S. Software Development Job Listings (% change) |
|---|---|
| 2020-02-01 | 0% |
| 2020-05-01 | -30.25% |
| 2020-08-01 | -30.70% |
| 2020-11-01 | -19.55% |
| 2021-02-01 | -1.33% |
| 2021-05-01 | 26.10% |
| 2021-08-01 | 51.31% |
| 2021-11-01 | 92.90% |
| 2022-02-01 | 123.28% |
| 2022-05-01 | 122.18% |
| 2022-08-01 | 93.37% |
| 2022-11-01 | 54.40% |
| 2023-02-01 | 22.23% |
| 2023-05-01 | -1.51% |
| 2023-08-01 | -17.80% |
| 2023-11-01 | -25.44% |
| 2024-02-01 | -27.13% |
| 2024-05-01 | -30.86% |
| 2024-08-01 | -30.41% |
| 2024-11-01 | -32.45% |
| 2025-02-01 | -33.36% |
| 2025-02-28 | -36.48% |
Breaking into tech as a software developer in 2025 won’t be as easy as it was before—job listings are at their lowest in five years, down more than 33% from 2020 levels.
Software development job postings soared in 2021 and 2022 as tech companies expanded rapidly, fueled by economic recovery and a surge in startup funding.
However, hiring slowed dramatically in 2023 as economic uncertainty, widespread layoffs, and reduced venture capital investment hit the industry.
Some other factors behind the decline in software developer jobs include the widespread adoption of AI-powered software development tools that enhance productivity and a shift in focus by tech companies toward efficiency rather than expansion.
Despite the overall decline in software development job postings, major tech hubs like the San Francisco Bay Area and New York have continued to see net job growth in the tech sector, including developer roles, over the past few years.
Learn More on the Voronoi App 
To learn more trends in the programming world, check out this graphic that ranks the most popular programming languages on GitHub from 2014 to 2024.
Technology
Ranked: The Companies Shipping the Most Humanoid Robots
From Unitree to Tesla, see which companies shipped the most robots in 2025, and why Chinese manufacturers dominate the leaderboard.
Published
2 days ago
on
March 17, 2026

Ranked: The Companies Shipping the Most Humanoid Robots
See visuals like this from many other data creators on our Voronoi app. Download it for free on iOS or Android and discover incredible data-driven charts from a variety of trusted sources.
Key Takeaways
- Chinese companies accounted for nearly 90% of global humanoid robot shipments in 2025.
- Unitree and AgiBot shipped more than 10,000 robots combined, far ahead of every other manufacturer.
- Tesla, Figure AI, and Agility Robotics each shipped about 150 units, showing how early the U.S. market still is.
Global humanoid robot shipments surpassed 14,500 in 2025. By 2030, they could reach mass adoption.
By far, China dominated global sales last year, covering 90% of total sales. While early deployments are largely for research and industrial purposes, their applications could soon break into wider retail uses and household tasks.
Based on data from multiple sources via Rest of World, this graphic ranks the companies shipping the world’s humanoid robots as the industry expands.
The Top Companies by Humanoid Robot Sales in 2025
The table below ranks humanoid robot shipments by company in 2025, highlighting which firms are leading the early commercialization of this emerging technology.
| Company | Units Sold 2025 | Country |
|---|---|---|
| Unitree | 5,500 | 🇨🇳 China |
| AgiBot | 5,168 | 🇨🇳 China |
| UBTECH | 1,000 | 🇨🇳 China |
| Leju Robotics | 500 | 🇨🇳 China |
| Engine AI | 400 | 🇨🇳 China |
| Fourier Intelligence | 300 | 🇨🇳 China |
| Figure AI | 150 | 🇺🇸 U.S. |
| Agility Robotics | 150 | 🇺🇸 U.S. |
| Tesla | 150 | 🇺🇸 U.S. |
| Others | 1,350 | 🌍 N/A |
Unitree ranks first globally, with 5,500 units sold in 2025, up from around 1,500 a year earlier.
Moreover, Unitree’s models stand among the world’s most advanced and affordable. Its cheapest R1 model, for instance, costs just $5,900, while the company also sells robot dogs for $1,600.
Competitor AgiBot followed next seeing 5,168 units sold, with its lowest-cost model standing at $14,500. Overall, 21 new models were introduced in China in 2025, rising from three in 2022.
While Elon Musk projects humanoid robots will outnumber the human population by 2040, Tesla’s rollout has been markedly slower. In 2025, it shipped 150 of its Optimus models, with public sales forecasted to begin in 2027.
Similarly, other leading U.S. companies Figure AI and Agility Robotics each shipped about the same amount. Despite limited deliveries so far, Figure AI soared to a $39 billion valuation, jumping from $2.6 billion in 2024.
China’s Deep Supply Chains
China’s Yangtze River Delta contains the world’s most vertically integrated supply chain for humanoid robotics.
Not only are Unitree and AgiBot based in the region, it is home to several leading suppliers of robotics parts. DeepSeek and Alibiba—which launched an AI model designed for robotics—are also found in the cluster.
Additionally, the region’s role as a EV manufacturing hub serves as a key catalyst to production. Like autos, humanoids require thousands of precision components. In many cases, EV actuators and gears can be repurposed for humanoid robotics manufacturing.
Today, China controls about 26% of the global actuator market, compared with roughly 5% for the United States.
Along with this industrial base, humanoid robots depend heavily on critical minerals and rare earth elements, materials that China dominates, driving roughly 60% of global production. Together, these supply chain advantages give China a structural edge in scaling these emerging technologies.
Learn More on the Voronoi App
To learn more about this topic, check out this graphic on the growth of industrial robots by country.
AI
Where Venture Capital Money Is Going: AI vs. Everything Else
Dive into this bar chart, which shows global venture capital investment into artificial intelligence versus all other sectors. 
Published
3 days ago
on
March 16, 2026

Where Venture Capital Money Is Going: AI vs. Everything Else
See visuals like this from many other data creators on our Voronoi app. Download it for free on iOS or Android and discover incredible data-driven charts from a variety of trusted sources.
Key Takeaways
- AI and machine learning have helped prop up venture capital as funding for other sectors cooled.
- AI accounted for 52% of global VC deal value in Q4 2025.
- Investment accelerated sharply in 2024 as large funding rounds flowed into AI infrastructure and model developers.
Venture capital activity has slowed since its pandemic-era peak, but artificial intelligence remains a major exception.
Investment flowing into AI and machine learning (ML) has surged over the past two years, helping sustain overall venture funding even as deal activity in other sectors weakened.
This graphic visualizes data compiled by BestBrokers, using information from PitchBook, CB Insights, and LIQUiDITY, showing how venture capital has increasingly concentrated around AI.
AI Takes a Larger Slice of the Pie
The quarterly data from 2022 to 2025 shows how the balance between AI and non-AI venture investment has shifted.
| Quarter | AI and ML deals ($B) | Rest of Deals ($B) | % Share (AI) |
|---|---|---|---|
| Q1 2022 | 38.9 | 139.5 | 21.8% |
| Q2 2022 | 40.9 | 105.2 | 28.0% |
| Q3 2022 | 21.2 | 87.8 | 19.4% |
| Q4 2022 | 20.1 | 73.6 | 21.5% |
| Q1 2023 | 34.4 | 72.7 | 32.1% |
| Q2 2023 | 21.3 | 66.8 | 24.2% |
| Q3 2023 | 20.7 | 68.0 | 23.3% |
| Q4 2023 | 24.8 | 59.4 | 29.5% |
| Q1 2024 | 20.8 | 61.0 | 25.4% |
| Q2 2024 | 34.2 | 60.8 | 36.0% |
| Q3 2024 | 35.2 | 51.0 | 40.8% |
| Q4 2024 | 66.7 | 61.7 | 51.9% |
| Q1 2025 | 75.5 | 59.7 | 55.8% |
| Q2 2025 | 56.9 | 56.3 | 50.3% |
| Q3 2025 | 65.4 | 60.2 | 52.1% |
| Q4 2025 | 72.4 | 66.2 | 52.2% |
Venture capital boomed in 2021, but sentiment shifted in 2022 amid geopolitical uncertainty, rising interest rates, and a slowing exit market. Deal value dropped 47% between the first and fourth quarters of 2022, and AI represented only a small share of overall funding at the time.
OpenAI’s ChatGPT launched in November 2022, sparking a wave of interest in generative AI. Funding for AI and ML rose in early 2023 even as other venture deals stagnated.
The real step-change arrived in 2024. AI dealmaking accelerated throughout the year and surged in the fourth quarter, when the sector attracted $66.7 billion in funding—surpassing the $61.7 billion invested across all other sectors combined.
This growth reflects both rising investor optimism and the capital-intensive nature of AI infrastructure, including chips, data centers, and large-scale model development.
By Q4 2025, venture deals totaled $138.6 billion globally, with AI and ML accounting for 52% of the total—the first time the sector made up more than half of deal value in the dataset.
Fears of a Bubble
The surge in AI investment has split investors across public and private markets, with some warning the industry may be in a bubble while others remain highly optimistic about its long-term potential.
Concerns have also been raised about opaque private funding and circular dealmaking among major AI players. Strong earnings from companies such as Nvidia, however, have helped sustain investor enthusiasm.
How disruptive AI ultimately proves to be remains uncertain, and venture capital flows will likely continue shifting as investors respond to technological breakthroughs and broader global events.
Learn More on the Voronoi App
To learn more about how the AI industry is creating a large cap boom, check out this graphic.