TikTok Is Impressively Unequal
Credit to @lilweehag for help with the scraper.
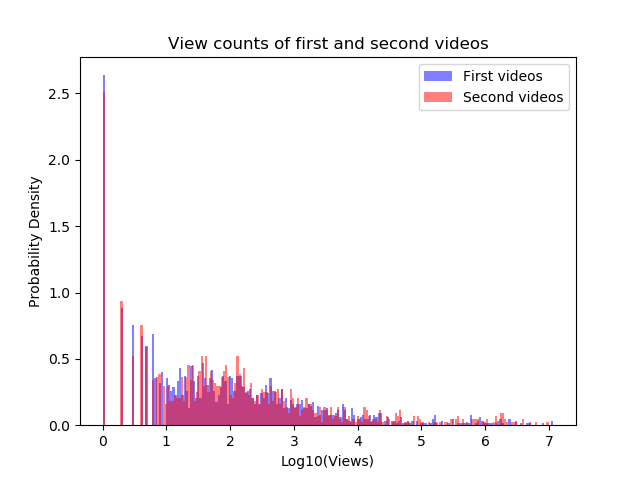
I’ve created a representative sample of ~20,000 TikTok videos. I’ve only found one paper analyzing the view counts of videos, which claims that the most popular videos were Zipf-distributed. That may be true of the most popular videos, but at least in my sample they are not perfectly power law distributed:

Regardless of the exact distribution, it’s easy to see that the distribution is fairly fat tailed, so I was curious what the Gini coefficient and Lorenz curves looks like.
Here’s the Lorenz curve for view counts in 2020:

The black line indicates perfect equality. The green x’s indicate actual data.
As you can see, it is almost perfectly unequal. Indeed, the Gini coefficient is around 0.93. (0 indicates perfect equality, 1 indicates perfect inequality.)
To put that into perspective, here’s the Gini coefficients of some other things:
- Income in the United States: 0.41
- Income in South Africa (the world’s most unequal country): 0.63
- Likes on Tinder: 0.58
- Followers on Instagram: 0.82
I wonder if TikTok is the world’s most unequally distributed social media platform.
Appendix
Gini Coefficients by year and statistic: