2026 global predictions
Despite ongoing conflicts, uncertainty over what Trump era 2.0 will bring next and the imminent climate catastrophe, global optimism is holding firm for 2026. According to the latest data from Ipsos, an average of 71 percent of respondents across 30 countries said they felt optimistic that their 2026 will be better than 2025. This is the same share as last year and 16 percentage points up from 2023, which had the lowest score on record since Ipsos started running the survey.
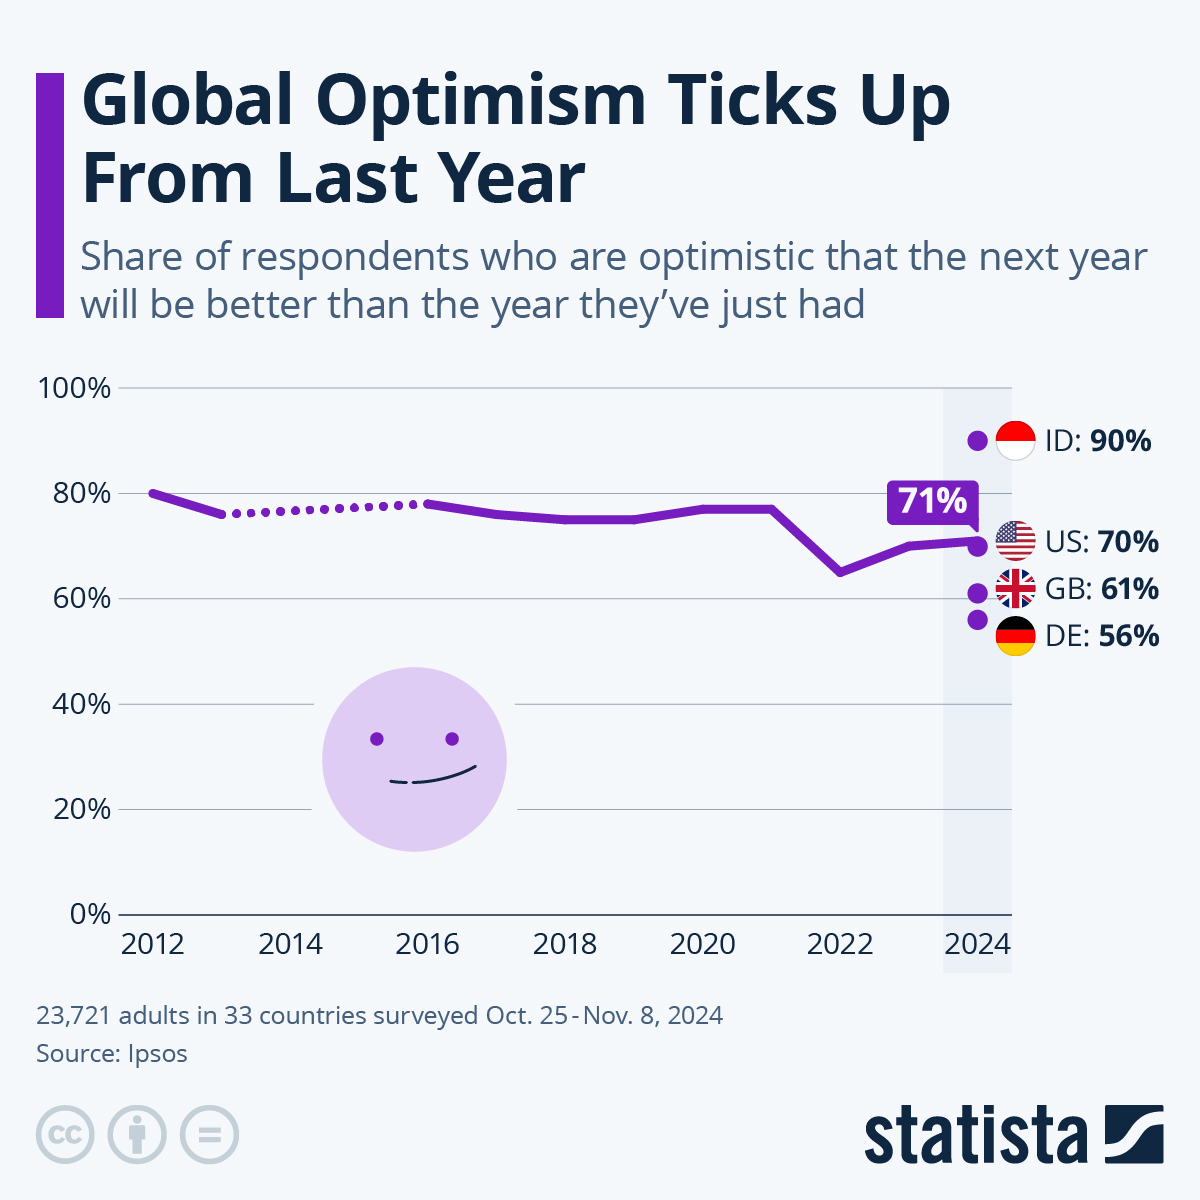
Of course, a global average hides the differences between countries. For instance, when looking at national breakdown, Indonesia has a high share of people feeling positive about their coming year. Out of the 30 countries polled, it comes out on top, with 90 percent of respondents feeling more optimistic about 2026. This is the same as last year.
At the more cynical end of the spectrum stand France and Japan, with only 41 percent and 44 percent of their respondents, respectively, feeling more positive about the coming year. France saw a nine percentage point drop from last 2024, following a year of political turmoil in 2025. Meanwhile, Japan’s low score is actually a six percentage point increase on its 2024 figure. South Korea and India were the two countries to see the largest gains, with a nine percentage point increase year-on-year.
Optimism has faltered slightly in the United Kingdom, down three percentage points from last year to 58 percent, while 66 percent of U.S. respondents said they felt optimistic about the coming year (-4 p.p.).
Description
This chart shows the share of global respondents that are optimistic that next year will be better than the last.
