Featured Blogs

March 31, 2026
Time to Read
Engineering teams are generating more shippable code than ever before — and today, Harness is shipping five new capabilities designed to help teams release confidently. AI coding assistants lowered the barrier to writing software, and the volume of changes moving through delivery pipelines has grown accordingly. But the release process itself hasn't kept pace.
The evidence shows up in the data. In our 2026 State of DevOps Modernization Report, we surveyed 700 engineering teams about what AI-assisted development is actually doing to their delivery. The finding stands out: while 35% of the most active AI coding users are already releasing daily or more, those same teams have the highest rate of deployments needing remediation (22%) and the longest MTTR at 7.6 hours.
This is the velocity paradox: the faster teams can write code, the more pressure accumulates at the release, where the process hasn't changed nearly as much as the tooling that feeds it.
The AI Delivery Gap
What changed is well understood. For years, the bottleneck in software delivery was writing code. Developers couldn't produce changes fast enough to stress the release process. AI coding assistants changed that. Teams are now generating more change across more services, more frequently than before — but the tools for releasing that change are largely the same.
In the past, DevSecOps vendors built entire separate products to coordinate multi-team, multi-service releases. That made sense when CD pipelines were simpler. It doesn't make sense now. At AI speed, a separate tool means another context switch, another approval flow, and another human-in-the-loop at exactly the moment you need the system to move on its own.
The tools that help developers write code faster have created a delivery gap that only widens as adoption grows.
What Harness Is Shipping
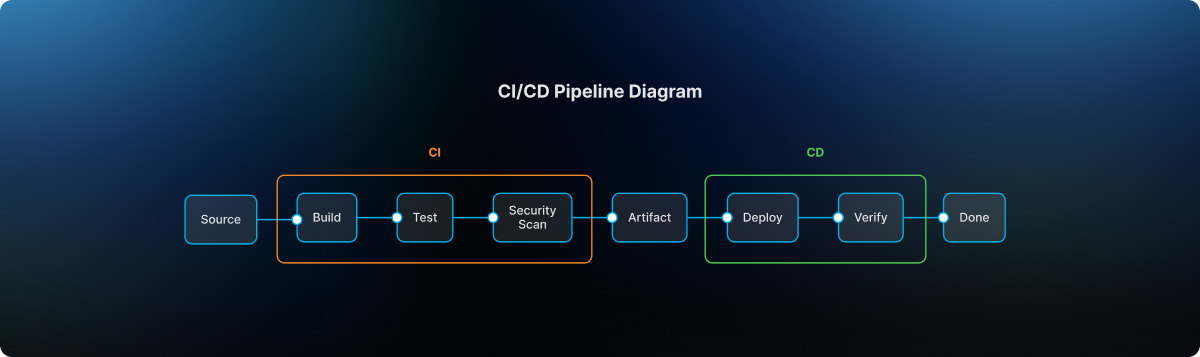
Today Harness is releasing five capabilities, all natively integrated into Continuous Delivery. Together, they cover the full arc of a modern release: coordinating changes across teams and services, verifying health in real time, managing schema changes alongside code, and progressively controlling feature exposure.
Coordinate multi-team releases without the war room
Release Orchestration replaces Slack threads, spreadsheets, and war-room calls that still coordinate most multi-team releases. Services and the teams supporting them move through shared orchestration logic with the same controls, gates, and sequence, so a release behaves like a system rather than a series of handoffs. And everything is seamlessly integrated with Harness Continuous Delivery, rather than in a separate tool.
Know when to stop — automatically
AI-Powered Verification and Rollback connects to your existing observability stack, automatically identifies which signals matter for each release, and determines in real time whether a rollout should proceed, pause, or roll back. Most teams have rollback capability in theory. In practice it's an emergency procedure, not a routine one. Ancestry.com made it routine and saw a 50% reduction in overall production outages, with deployment-related incidents dropping significantly.
Ship code and schema changes together
Database DevOps, now with Snowflake support, brings schema changes into the same pipeline as application code, so the two move together through the same controls with the same auditability. If a rollback is needed, the application and database schema can rollback together seamlessly. This matters especially for teams building AI applications on warehouse data, where schema changes are increasingly frequent and consequential.
Roll out features gradually, measure what actually happens
Improved pipeline and policy support for feature flags and experimentation enables teams to deploy safely, and release progressively to the right users even though the number of releases is increasing due to AI-generated code. They can quickly measure impact on technical and business metrics, and stop or roll back when results are off track. All of this within a familiar Harness user interface they are already using for CI/CD.
Warehouse-Native Feature Management and Experimentation lets teams test features and measure business impact directly with data warehouses like Snowflake and Redshift, without ETL pipelines or shadow infrastructure. This way they can keep PII and behavioral data inside governed environments for compliance and security.
These aren't five separate features. They're one answer to one question: can we safely keep going at AI speed?
From Deployment to Verified Outcome
Traditional CD pipelines treat deployment as the finish line. The model Harness is building around treats it as one step in a longer sequence: application and database changes move through orchestrated pipelines together, verification checks real-time signals before a rollout continues, features are exposed progressively, and experiments measure actual business outcomes against governed data.
A release isn't complete when the pipeline finishes. It's complete when the system has confirmed the change is healthy, the exposure is intentional, and the outcome is understood.
That shift from deployment to verified outcome is what Harness customers say they need most. "AI has made it much easier to generate change, but that doesn't mean organizations are automatically better at releasing it," said Marc Pearce, Head of DevOps at Intelliflo. "Capabilities like these are exactly what teams need right now. The more you can standardize and automate that release motion, the more confidently you can scale."
Release Becomes a System, Not a Scramble
The real shift here is operational. The work of coordinating a release today depends heavily on human judgment, informal communication, and organizational heroics. That worked when the volume of change was lower. As AI development accelerates, it's becoming the bottleneck.
The release process needs to become more standardized, more repeatable, and less dependent on any individual's ability to hold it together at the moment of deployment. Automation doesn't just make releases faster. It makes them more consistent, and consistency is what makes scaling safe.
For Ancestry.com, implementing Harness helped them achieve 99.9% uptime by cutting outages in half while accelerating deployment velocity threefold.
At Speedway Motors, progressive delivery and 20-second rollbacks enabled a move from biweekly releases to multiple deployments per day, with enough confidence to run five to 10 feature experiments per sprint.
AI made writing code cheap. Releasing that code safely, at scale, is still the hard part.
Harness Release Orchestration, AI-Powered Verification and Rollback, Database DevOps, Warehouse-Native Feature Management and Experimentation, and Improve Pipeline and Policy support for FME are available now. Learn more and book a demo.
March 30, 2026
Time to Read
On March 19th, the risks of running open execution pipelines — where what code runs in your CI/CD environment is largely uncontrolled — went from theoretical to catastrophic.
A threat actor known as TeamPCP compromised the GitHub Actions supply chain at a scale we haven't seen before (tracked as CVE-2026-33634, CVSS 9.4). They compromised Trivy, the most widely used vulnerability scanner in the cloud-native ecosystem, and turned it into a credential-harvesting tool that ran inside victims' own pipelines.
Between March 19 and March 24, 2026, organizations running affected tag-based GitHub Actions references were sending their AWS tokens, SSH keys, and Kubernetes secrets directly to the attacker. SANS Institute estimates over 10,000 CI/CD workflows were directly affected. According to multiple security research firms, the downstream exposure extends to tens of thousands of repositories and hundreds of thousands of accounts.
Five ecosystems. Five days. One stolen Personal Access Token.
This is a fundamental failure of the open execution pipeline model — where what runs in your pipeline is determined by external references to public repositories, mutable version tags, and third-party code that executes with full privileges. GitHub Actions is the most prominent implementation.
The alternative, governed execution pipelines, where what runs is controlled through policy gates, customer-owned infrastructure, scoped credentials, and immutable references, is the model we designed Harness around years ago, precisely because we saw this class of attack coming.
Part I: The Long Road to TeamPCP (2025–2026)
TeamPCP wasn't an anomaly; it was the inevitable conclusion of an eighteen-month escalation in CI/CD attack tactics.
1. The tj-actions Proof of Concept (March 2025)
CVE-2025-30066. Attackers compromised a PAT from an upstream dependency (reviewdog/action-setup) and force-pushed malicious code to every single version tag of tj-actions/changed-files. 23,000 repositories were exposed. The attack was later connected to a targeted campaign against Coinbase. CISA issued a formal advisory.
This proved that the industry's reliance on mutable tags (like @v2) was a serious structural vulnerability. According to Wiz, only 3.9% of repositories pin to immutable SHAs. The other 96% are trusting whoever owns the tag today.
2. The Shai-Hulud Worm (Sept–Nov 2025)
The first self-replicating worm in the CI/CD ecosystem. Shai-Hulud 2.0 backdoored 796 npm packages representing over 20 million weekly downloads — including packages from Zapier, PostHog, and Postman.
It used TruffleHog to harvest 800+ credential types, registered compromised machines as self-hosted GitHub runners named SHA1HULUD for persistent C2 over github.com, and built a distributed token-sharing network where compromised machines could replace each other's expired credentials.
PostHog's candid post-mortem revealed that attackers stole their GitHub bot's PAT via a pull_request_target workflow exploit, then used it to steal npm publishing tokens from CI runner secrets. Their admission that this kind of attack "simply wasn't something we'd prepared for" reflects the industry-wide gap between application security and CI/CD security maturity. CISA issued another formal advisory.
3. The Trivy Compromise (March 19, 2026)
TeamPCP went after the security tools themselves.
They exploited a misconfigured GitHub Actions workflow to steal a PAT from Aqua Security's aqua-bot service account. Aqua detected the breach and initiated credential rotation — but reporting suggests the rotation did not fully cut off attacker access. TeamPCP appears to have retained or regained access to Trivy's release infrastructure, enabling the March 19 attack weeks after initial detection.
On March 19, they force-pushed a malicious "Cloud Stealer" to 76 of 77 version tags in trivy-action and all 7 tags in setup-trivy. Simultaneously, they published an infected Trivy binary (v0.69.4) to GitHub Releases and Docker Hub. Every pipeline referencing those tags by name started executing the attacker's code on its next run. No visible change to the release page. No notification. No diff to review.
Part II: Inside the "Cloud Stealer" Tradecraft
TeamPCP's payload was purpose-built for CI/CD runner environments:
Memory Scraping. It read /proc/*/mem to extract decrypted secrets held in RAM. GitHub's log-masking can't hide what's in process memory.
Cloud Metadata Harvesting. It queried the AWS Instance Metadata Service (IMDS) at 169.254.169.254, pivoting from "build job" to full IAM role access in the cloud.
Filesystem Sweep. It searched over 50 specific paths — .env files, .aws/credentials, .kube/config, SSH keys, GPG keys, Docker configs, database connection strings, and cryptocurrency wallet keys.
Encrypted Exfiltration. All data was bundled into tpcp.tar.gz, encrypted with AES-256 and RSA-4096, and sent to typosquatted domains like scan.aquasecurtiy[.]org (note the "tiy"). These domains returned clean verdicts from threat intelligence feeds during the attack. As a fallback, the stealer created public GitHub repos named tpcp-docs under the victim's own account.
The malicious payload executed before the legitimate Trivy scan. Pipelines appeared to work normally. CrowdStrike noted: "To an operator reviewing workflow logs, the step appears to have completed successfully."
The Five-Day Cascade
| Date | Target | Impact |
|---|---|---|
| March 19 | Trivy | 10,000+ workflows affected; CVE-2026-33634 (CVSS 9.4). |
| March 20 | npm | CanisterWorm deployed; 50+ packages backdoored. |
| March 22 | Aqua Security | Internal GitHub org hijacked; 44 repos exposed in a 2-minute burst. |
| March 23 | Checkmarx KICS | AST and KICS Actions poisoned; VS Code extensions trojanized. |
| March 24 | LiteLLM | PyPI packages poisoned; malware ran every time Python started via .pth hooks. |
Sysdig observed that the vendor-specific typosquat domains were a deliberate deception — an analyst reviewing CI/CD logs would see traffic to what appears to be the vendor's own domain.
It took Aqua five days to fully evict the attacker, during which TeamPCP pushed additional malicious Docker images (v0.69.5 and v0.69.6).
Part III: Why Open Execution Pipelines Break at Scale
Why did this work so well? Because GitHub Actions is the leading example of an open execution pipeline — where what code runs in your pipeline is determined by external references that anyone can modify.
This trust problem isn't new. Jenkins had a similar issue with plugins. Third-party code ran with full process privileges. But Jenkins ran inside your firewall; exfiltrating data required getting past your network perimeter.
GitHub Actions took the same open execution approach but moved execution to cloud-hosted runners with broad internet egress, making exfiltration trivially easy. TeamPCP's Cloud Stealer just needed to make an HTTPS POST to an external domain, which runners are designed to do freely.
Here are a few reasons why open execution pipelines break at scale:
Mutable Trust. When you use @v2, you are trusting a pointer, not a piece of code. Tags can be silently redirected by anyone with write access. TeamPCP rewrote 76 tags in a single operation. 96% of the ecosystem is exposed.
Flat Privileges. Third-party Actions run with the same permissions as your code. No sandbox. No permission isolation. This is why TeamPCP targeted security scanners — tools that by design have elevated access to your pipeline infrastructure. The attacker doesn't need to break in. The workflow invites them in.
Secret Sprawl. Secrets are typically injected into the runner's environment or process memory during job execution, where they remain accessible for the job's duration. TeamPCP's /proc/*/mem scraper didn't need any special privilege. It just needed to be running on the same machine.
Unbounded Credential Cascades. There is no architectural boundary that stops a credential stolen in one context from unlocking another. TeamPCP proved this definitively: Trivy → Checkmarx → LiteLLM → AI API keys across thousands of enterprises. One PAT, five ecosystems.
Part IV: Governed Execution Pipelines — Three Structural Walls
Harness CI/CD pipelines are built as governed execution pipelines — where what runs is controlled through customer-owned infrastructure, policy gates, scoped credentials, immutable references, and explicit trust boundaries. At its core is the Delegate — a lightweight worker process that runs inside your infrastructure (your VPC, your Kubernetes cluster), executes tasks locally, and communicates with the Harness control plane via outbound-only connections.
When we designed this architecture, we assumed the execution plane would become the primary target in the enterprise. If TeamPCP tried to attack a Harness-powered environment, they would hit three architectural walls.
Wall 1: The Airlock (Outbound-Only, Egress-Filtered Execution)
The Architecture.
The Delegate lives inside your VPC or cluster. It communicates with our SaaS control plane via outbound-only HTTPS/WSS. No inbound ports are opened.
The Defense.
You control the firewall. Allowlist app.harness.io and the specific endpoints your pipelines need, deny everything else. TeamPCP's exfiltration to typosquat domains would fail at the network layer — not because of a detection rule, but because the path doesn't exist. Both typosquat domains returned clean verdicts from threat intel feeds. Egress filtering by allowlist is more reliable than detection by reputation.
Wall 2: The Vault (Secret Isolation at the Source)
The Architecture.
Rather than bulk-injecting secrets as flat environment variables at job start, Harness can resolve secrets at runtime through your secret manager — HashiCorp Vault, AWS Secrets Manager, GCP Secret Manager, Azure Key Vault — via the Delegate, inside your network. Harness SaaS stores encrypted references and metadata, not plaintext secret values.
The Defense.
TeamPCP's Cloud Stealer worked because in an open execution pipeline, secrets are typically injected into the runner's process memory where they remain accessible for the job's duration. In a governed execution pipeline, this exposure is structurally reduced: secrets can be resolved from your controlled vault at the point they're needed, rather than broadcast as environment variables to every step in the pipeline.
An important caveat: Vault-based resolution alone doesn't eliminate runtime exfiltration. Once a secret is resolved and passed to a step that legitimately needs it — say, an npm token during npm publish — that secret exists in the step's runtime. If malicious code is executing in that same context (for example, a tampered package.json that exfiltrates credentials during npm run test), the secret is exposed regardless of where it came from. This is why the three walls work as a system: Wall 2 reduces the surface of secret exposure, Wall 1 blocks the exfiltration path, and (as we'll see) Wall 3 limits the blast radius to the scoped environment. No single wall is sufficient on its own.
To further strengthen how pipelines use secrets, leverage ephemeral credentials — AWS STS temporary tokens, Vault dynamic secrets, or GCP short-lived service account tokens — that auto-expire after a defined window, often minutes. Even if TeamPCP’s memory scraper extracted an ephemeral credential, it likely would have expired before the attacker could pivot to the next target.
Wall 3: The Dead End (Environment-Scoped Isolation)
The Architecture.
Harness supports environment-scoped delegates as a core architecture pattern. Your "Dev" scanner delegate runs in a different cluster, with different network boundaries and different credentials, than your "Prod" deployment delegate.
The Defense.
The credential cascade that defined TeamPCP hits a dead end. Stolen Dev credentials cannot reach Production publishing gates or AI API keys, because those credentials live in a different vault, resolved by a different delegate, in a different network segment. If the Trivy compromise only yielded credentials scoped to a dev environment, the attack stops at phase one.
Beyond the walls, governed execution pipelines provide additional structural controls:
- No default marketplace dependency: In GitHub Actions, the primary building block is a reference to an external Action in a public repository. In Harness, the primary building blocks are native pipeline steps that don't reference external Git repos. Harness does support running GitHub Actions as steps for teams that need compatibility, but external Actions are an optional path — not the default architecture.
- Reduced tooling and attack surface. Customers can use minimal delegate images with a significantly reduced binary footprint and least-privilege Kubernetes roles to restrict available tooling. TeamPCP's kubectl get secrets --all-namespaces would require tooling and permissions that a properly hardened delegate environment wouldn't provide.
The Comparison
| Dimension | Open Execution (e.g., GitHub Actions) | Governed Execution (Harness) |
|---|---|---|
| Trust Source | External repos, public authors, and mutable tags. | Internal policy, customer-owned infrastructure, and governed configs. |
| Secret Delivery | Bulk-injected as environment variables at job start. | Resolved from your Vault/KMS by the Delegate at execution time. |
| Network Model | Bidirectional with broad egress from cloud runners. | Outbound-only with strict egress allowlisting. |
| Environment Isolation | Optional and typically manually configured. | Separate Delegates per environment supported as a core architecture pattern. |
| Runner Persistence | Self-hosted runners may persist between jobs. | Ephemeral execution patterns and minimal images reduce persistence risk. |
| Governance | SHA pinning is manual; 96% of the ecosystem remains unpinned. | Native steps aren't pulled from external Git repos by default. |
| Credential Rotation | Manual, often incomplete. | Customer-managed vault integration with delegate-scoped access narrows blast radius. |
| Credential Lifetime | Typically long-lived static secrets. | Supports ephemeral credentials (AWS STS, Vault dynamic secrets, GCP temporary tokens) that auto-expire after job completion. |
What TeamPCP Actually Exploited — Mapped to Harness Defenses
| Attack Vector | TeamPCP / Shai-Hulud Method | Governed Pipeline Defense (Harness) |
|---|---|---|
| Tag Poisoning | Force-pushed malicious code to 76 of 77 version tags in trivy-action, affecting all pipelines using @v2. | No Default Marketplace Dependency: Native steps do not reference external Git repos by default, eliminating reliance on mutable third-party tags. |
| Secret Harvesting | Scraped /proc/*/mem and queried AWS IMDS (169.254.169.254) to extract decrypted secrets from runner memory. | Vault-Based Resolution: Secrets are resolved at execution time via the Delegate from your Vault/KMS rather than bulk-injected as environment variables. |
| Lateral Movement | Used stolen Trivy PATs to poison Checkmarx, then LiteLLM, allowing one credential to unlock five ecosystems. | Delegate Scoping: Environment-scoped delegates ensure Dev credentials cannot reach Production publishing gates across network boundaries. |
| Persistence | Installed malicious .pth hooks in Python and registered compromised machines as persistent SHA1HULUD runners. | Ephemeral Execution: Minimal images with reduced binary footprints and auto-scaling delegates significantly reduce persistence opportunities. |
| Network Deception | Sent data to typosquatted domains (e.g., aquasecurtiy[.]org) that passed standard reputation checks. | Egress Allowlisting: Outbound-only traffic restricted to your specific VPC endpoints; unknown domains are blocked at the network layer. |
| Worm Propagation | Shai-Hulud self-replicated via stolen npm tokens. CanisterWorm spread via stolen SSH keys and K8s APIs. | Secret Isolation: Publishing tokens not exposed as env vars. Minimal delegate images resist worm installation and persistence. |
| Rotation Gap | Retained access during incomplete credential rotation window. | Vault Integration + Ephemeral Credentials:Delegate-scoped access narrows blast radius. Ephemeral credentials (AWS STS, Vault dynamic secrets) auto-expire after job completion, limiting the lifetime of stolen credentials to minutes regardless of rotation hygiene. |
Part V: The Nuance — Governed Doesn't Mean Automatically Safe
Architecture is a foundation, not a guarantee. Governed execution pipelines are materially safer against this class of attack, but you can still create avoidable risk by running unvetted containers on delegates, skipping egress filtering, using the same delegate across dev and prod, granting overly broad cloud access, or exposing excessive secrets to jobs that don't need them, or using long-lived static credentials when ephemeral alternatives exist.
I am not claiming that Harness is safe and GitHub Actions is unsafe. That would be too simplistic.
What I am claiming is that governed execution pipelines — where what runs is controlled through policy gates, customer-owned infrastructure, scoped credentials, and immutable references — are a materially safer foundation than open execution pipelines. We designed Harness as our implementation of a governed execution pipeline. But architecture is a starting point — you still have to operate it well.
Part VI: The Strategic Bottom Line — From Open to Governed
As we enter the era of Agentic AI — where AI is generating pipelines, suggesting dependencies, and submitting pull requests at machine speed — we can no longer rely on human review to catch a malicious tag in an AI-generated PR.
But there's a more fundamental shift: AI agents will become the primary actors inside CI/CD pipelines. Not just generating code — autonomously executing tasks, selecting dependencies, making deployment decisions, remediating incidents.
Now imagine an AI agent in an open execution pipeline — downloaded from a public marketplace, referenced by a mutable tag, executing with full privileges, making dynamic runtime decisions you didn't define. It has access to your secrets, your cloud credentials, and your deployment infrastructure. Unlike a static script, an agent makes decisions at runtime — fetching resources, calling APIs, modifying files.
If TeamPCP showed us what happens when a static scanner is compromised, imagine what happens when an autonomous AI agent is compromised — or simply makes a decision you didn't anticipate.
This is why governed execution pipelines aren't just a security improvement — they're an architectural prerequisite for the AI era. In a governed pipeline, even an AI agent operates within structural boundaries: it runs on infrastructure you control, accesses only scoped secrets, has restricted egress, and its actions are audited. The agent may be autonomous, but the pipeline constrains what it can reach.
The questions every engineering leader should be asking:
- Is my pipeline open or governed? Do I control what code executes, or is it determined by external references I don't audit?
- Where does execution happen? In infrastructure I control, or in an environment assembled from public dependencies?
- Who controls the network boundary? My security team, or the maintainer of a third-party Action?
- Are secrets sitting in runner memory or safely in my Vault?
- What stops a credential cascade from crossing environment boundaries?
- When AI agents start running autonomously in my pipelines, what structural boundaries constrain them?
What You Should Do Right Now
If you use Trivy, Checkmarx, or LiteLLM:
- Assume compromise if you ran any of these tools between March 19–25. Rotate all credentials accessible to affected CI/CD runners. Check your GitHub org for repos named tpcp-docs — their presence indicates successful exfiltration.
- Block scan.aquasecurtiy[.]org, checkmarx[.]zone, and models.litellm[.]cloud at the network level.
- Update to safe versions: check with the providers of each impacted package and update the scanner and actions.
If you use GitHub Actions:
- Pin every Action to an immutable commit SHA. Today.
- Commit SHAs are not sufficient. They pin to the right commit, but do not guarantee that the right repository is selected.
- Add provenance verification: To close the gap left by SHA pinning alone, verify the Action’s source and publisher, restrict which external Actions are allowed, and prefer artifacts with verifiable provenance or attestations.
- Audit workflows for pull_request_target triggers.
- Enforce Least Privilege on GitHub Tokens: Audit every Personal Access Token and GitHub App permission. If it’s not scoped to the specific repository and the specific task (e.g., "contents: read"), it is a liability.
- Monitor egress for unexpected destinations: Domain reputation alone is insufficient.
For the longer term:
- Evaluate whether your CI/CD pipelines are open or governed. If production credentials flow through your pipelines, you need a governed execution pipeline where you control the infrastructure, the network boundary, the secret resolution, and the audit trail.
- Establish policies: Implement platform-wide automated governance to enforce SHAs and least-privilege token usage programmatically through systems like OPA.
The Responsibility We Share
I'm writing this as the CEO of a company that competes with GitHub in the CI/CD space. I want to be transparent about that.
But I'm also writing this as someone who has spent two decades building infrastructure software and who saw this threat model coming. When we designed Harness, the open execution pipeline model had already evolved from Jenkins plugins to GitHub Actions — each generation making it easier for third-party code to run with full privileges and, by moving execution further from the customer's network perimeter, making exfiltration easier. We deliberately chose to build governed execution pipelines instead.
The TeamPCP campaign didn't teach us anything new about the risk. What it did was make the difference between open and governed execution impossible for the rest of the industry to ignore.
Open source security tools are invaluable. The developers and companies who build them — including Aqua Security and Checkmarx — are doing essential work. The problem isn't the tools. The problem is running them inside open execution pipelines where third-party code has full privileges, secrets sit in memory, and exfiltration faces no structural barrier.
If you want to explore how the delegate architecture works in practice, we're here to show you. But more importantly, regardless of what platform you choose, please take these structural questions seriously. The next TeamPCP is already studying the credential graph.
March 11, 2026
Time to Read
Over the last few years, something fundamental has changed in software development.
If the early 2020s were about adopting AI coding assistants, the next phase is about what happens after those tools accelerate development. Teams are producing code faster than ever. But what I’m hearing from engineering leaders is a different question:
What’s going to break next?
That question is exactly what led us to commission our latest research, State of DevOps Modernization 2026. The results reveal a pattern that many practitioners already sense intuitively: faster code generation is exposing weaknesses across the rest of the software delivery lifecycle.
In other words, AI is multiplying development velocity, but it’s also revealing the limits of the systems we built to ship that code safely.
The Emerging “Velocity Paradox”
One of the most striking findings in the research is something we’ve started calling the AI Velocity Paradox - a term we coined in our 2025 State of Software Engineering Report.
Teams using AI coding tools most heavily are shipping code significantly faster. In fact, 45% of developers who use AI coding tools multiple times per day deploy to production daily or faster, compared to 32% of daily users and just 15% of weekly users.
At first glance, that sounds like a huge success story. Faster iteration cycles are exactly what modern software teams want.
But the data tells a more complicated story.
Among those same heavy AI users:
- 69% report frequent deployment problems when AI-generated code is involved
- Incident recovery times average 7.6 hours, longer than for teams using AI less frequently
- 47% say manual downstream work, QA, validation, remediation has become more problematic
What this tells me is simple: AI is speeding up the front of the delivery pipeline, but the rest of the system isn’t scaling with it. It’s like we are running trains faster than the tracks they are built for. Friction builds, the ride is bumpy, and it seems we could be on the edge of disaster.

The result is friction downstream, more incidents, more manual work, and more operational stress on engineering teams.
Why the Delivery System Is Straining
To understand why this is happening, you have to step back and look at how most DevOps systems actually evolved.
Over the past 15 years, delivery pipelines have grown incrementally. Teams added tools to solve specific problems: CI servers, artifact repositories, security scanners, deployment automation, and feature management. Each step made sense at the time.
But the overall system was rarely designed as a coherent whole.
In many organizations today, quality gates, verification steps, and incident recovery still rely heavily on human coordination and manual work. In fact, 77% say teams often have to wait on other teams for routine delivery tasks.
That model worked when release cycles were slower.
It doesn’t work as well when AI dramatically increases the number of code changes moving through the system.
Think of it this way: If AI doubles the number of changes engineers can produce, your pipelines must either:
- cut the risk of each change in half, or
- detect and resolve failures much faster.
Otherwise, the system begins to crack under pressure. The burden often falls directly on developers to help deploy services safely, certify compliance checks, and keep rollouts continuously progressing. When failures happen, they have to jump in and remediate at whatever hour.
These manual tasks, naturally, inhibit innovation and cause developer burnout. That’s exactly what the research shows.
Across respondents, developers report spending roughly 36% of their time on repetitive manual tasks like chasing approvals, rerunning failed jobs, or copy-pasting configuration.
As delivery speed increases, the operational load increases. That burden often falls directly on developers.
What Organizations Should Do Next
The good news is that this problem isn’t mysterious. It’s a systems problem. And systems problems can be solved.
From our experience working with engineering organizations, we've identified a few principles that consistently help teams scale AI-driven development safely.
1. Standardize delivery foundations
When every team builds pipelines differently, scaling delivery becomes difficult.
Standardized templates (or “golden paths”) make it easier to deploy services safely and consistently. They also dramatically reduce the cognitive load for developers.
2. Automate quality and security checks earlier
Speed only works when feedback is fast.
Automating security, compliance, and quality checks earlier in the lifecycle ensures problems are caught before they reach production. That keeps pipelines moving without sacrificing safety.
3. Build guardrails into the release process
Feature flags, automated rollbacks, and progressive rollouts allow teams to decouple deployment from release. That flexibility reduces the blast radius of new changes and makes experimentation safer.
It also allows teams to move faster without increasing production risk.
4. Remember measurement, not just automation
Automation alone doesn’t solve the problem. What matters is creating a feedback loop: deploy → observe → measure → iterate.
When teams can measure the real-world impact of changes, they can learn faster and improve continuously.
The Next Phase of AI in Software Delivery
AI is already changing how software gets written. The next challenge is changing how software gets delivered.
Coding assistants have increased development teams' capacity to innovate. But to capture the full benefit, the delivery systems behind them must evolve as well.
The organizations that succeed in this new environment will be the ones that treat software delivery as a coherent system, not just a collection of tools.
Because the real goal isn’t just writing code faster. It’s learning faster, delivering safer, and turning engineering velocity into better outcomes for the business.
And that requires modernizing the entire pipeline, not just the part where code is written.
Latest Blogs
The pipeline that never reached production

The pipeline that never reached production
How to improve CI/CD governance using template-driven pipelines, Git controls, and policy enforcement to protect production.
April 2, 2026
Time to Read
How template-driven CD prevents governance drift
Modern CI/CD platforms allow engineering teams to ship software faster than ever before.
Pipelines complete in minutes. Deployments that once required carefully coordinated release windows now happen dozens of times per day. Platform engineering teams have succeeded in giving developers unprecedented autonomy, enabling them to build, test, and deploy their services with remarkable speed.
Yet in highly regulated environments-especially in the financial services sector-speed alone cannot be the objective.
Control matters. Consistency matters. And perhaps most importantly, auditability matters.
In these environments, the real measure of a successful delivery platform is not only how quickly code moves through a pipeline. It is also how reliably the platform ensures that production changes are controlled, traceable, and compliant with governance standards.
Sometimes the most successful deployment pipeline is the one that never reaches production.
This is the story of how one enterprise platform team redesigned their delivery architecture to ensure that production pipelines remained governed, auditable, and secure by design.
The subtle risk in fast CI/CD platforms
A large financial institution had successfully adopted Harness for CI and CD across multiple engineering teams.
From a delivery perspective, the transformation looked extremely successful. Developers were productive, teams could create pipelines quickly, and deployments flowed smoothly through various non-production environments used for integration testing and validation. From the outside, the platform appeared healthy and efficient.
But during a platform architecture review, a deceptively simple question surfaced:
“What prevents someone from modifying a production pipeline directly?”
There had been no incidents. No production outages had been traced back to pipeline misconfiguration. No alarms had been raised by security or audit teams.
However, when the platform engineers examined the system more closely, they realized something concerning.
Production pipelines could still be modified manually.
In practice this meant governance relied largely on process discipline rather than platform enforcement. Engineers were expected to follow the right process, but the platform itself did not technically prevent deviations. In regulated industries, that is a risky place to be.
The architecture shift: separate authoring from execution
The platform team at the financial institution decided to rethink the delivery architecture entirely. Their redesign was guided by a simple but powerful principle:
Pipelines should be authored in a non-prod organization and executed in the production organization. And, if additional segregation was needed due to compliance, the team could decide to split into two separate accounts.
Authoring and experimentation should happen in a safe environment. Execution should occur in a controlled one.
Instead of creating additional tenants or separate accounts, the platform team decided to go with a dedicated non-prod organization within the same Harness account. This organization effectively acted as a staging environment for pipeline design and validation.
Architecture diagram
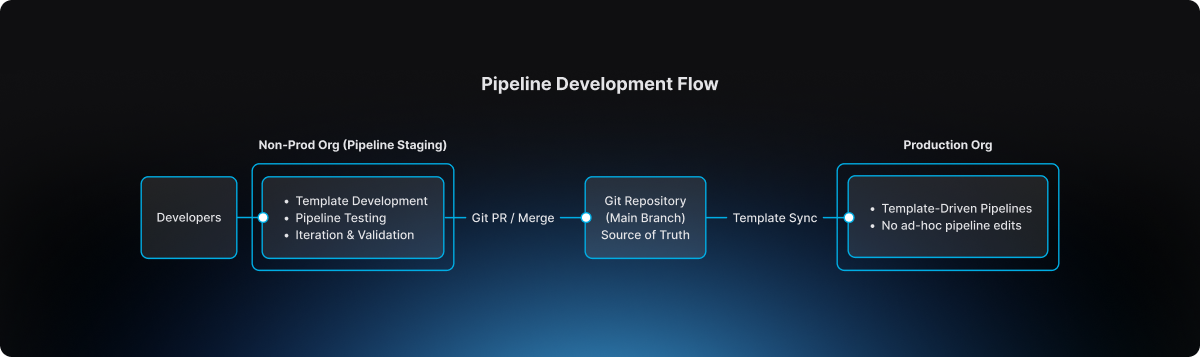
This separation introduced a clear lifecycle for pipeline evolution.
The non-prod organization became the staging environment where pipeline templates could be developed, tested, and refined. Engineers could experiment safely without impacting production governance.
The production organization, by contrast, became an execution environment. Pipelines there were not designed or modified freely. They were consumed from approved templates.
Guardrail #1: production pipelines must use templates
The first guardrail introduced by the platform team was straightforward but powerful.
Production pipelines must always be created from account-level templates.
Handcrafted pipelines were no longer allowed. Project-level template shortcuts were also prohibited, ensuring that governance could not be bypassed unintentionally.
This rule was enforced directly through OPA policies in Harness.
Example policy
package harness.cicd.pipeline

deny[msg] {
  template_scope := input.pipeline.template.scope
  template_scope != "account"
  msg = "pipeline can only be created from account level pipeline template"
}
This policy ensured that production pipelines were standardized by design. Engineers could not create or modify arbitrary pipelines inside the production organization. Instead, they were required to build pipelines by selecting from approved templates that had been validated by the platform team.
As a result, production pipelines ceased to be ad-hoc configurations. They became governed platform artifacts.
Guardrail #2: governance starts in the non-prod organization
Blocking unsafe pipelines in production was only part of the solution.
The platform team realized it would be even more effective to prevent non-compliant pipelines earlier in the lifecycle.
To accomplish this, they implemented structural guardrails within the non-prod organization used for pipeline staging. Templates could not even be saved unless they satisfied specific structural requirements defined by policy.
For example, templates were required to include mandatory stages, compliance checkpoints, and evidence collection steps necessary for audit traceability.
Example policy
package harness.ci_cd

deny[msg] {
  input.templates[_].stages == null
  msg = "Template must have necessary stages defined"
}

deny[msg] {
  some i
  stages := input.templates[i].stages
  stages == [Evidence_Collection]
  msg = "Template must have necessary stages defined"
}
These guardrails ensured that every template contained required compliance stages such as Evidence Collection, making it impossible for teams to bypass mandatory governance steps during pipeline design.
Governance, in other words, became embedded directly into the pipeline architecture itself.
The source of truth: Git
The next question the platform team addressed was where the canonical version of pipeline templates should reside.
The answer was clear: Git must become the source of truth.
Every template intended for production usage lived inside a repository where the main branch represented the official release line.
Direct pushes to the main branch were blocked. All changes required pull requests, and pull requests themselves were subject to approval workflows that mirrored enterprise change management practices.
Governance flow
.png)
This model introduced peer review, immutable change history, and a clear traceability chain connecting pipeline changes to formal change management records.
For auditors and platform leaders alike, this was a significant improvement.
The promotion workflow
Once governance mechanisms were in place, the promotion workflow itself became predictable and repeatable.
Engineers first authored and validated templates within the non-prod organization used for pipeline staging. There they could test pipelines using real deployments in controlled non-production environments.
The typical delivery flow followed a familiar sequence:
After validation, the template definition was committed to Git through a branch and promoted through a pull request. Required approvals ensured that platform engineers, security teams, and change management authorities could review the change before it reached the release line.
Once merged into main, the approved template became available for pipelines running in the production organization. Platform administrators ensured that naming conventions and version identifiers remained consistent so that teams consuming the template could easily track its evolution.
Finally, product teams created their production pipelines simply by selecting the approved template. Any attempt to bypass the template mechanism was automatically rejected by policy enforcement
The day the model proved its value
Several months after the new architecture had been implemented, an engineer attempted to modify a deployment pipeline directly inside the production organization.
Under the previous architecture, that change would have succeeded immediately.
But now the platform rejected it. The pipeline violated the OPA rule because it was not created from an approved account-level template.
Instead of modifying the pipeline directly, the engineer followed the intended process: updating the template within the non-prod organization, submitting a pull request, obtaining the necessary approvals, merging the change to Git main, and then consuming the updated template in production.
The system had behaved exactly as intended. It prevented uncontrolled change in production.
Why this model works
The architecture introduced by the large financial institution delivered several key guarantees.
Production pipelines are standardized because they originate only from platform-approved templates. Governance is preserved because Git main serves as the official release line for pipeline definitions. Auditability improves dramatically because every pipeline change can be traced back to a pull request and associated change management approval. Finally, platform administrators retain the ability to control how templates evolve and how they are consumed in production environments.
The lesson for platform teams
Pipelines are often treated as simple automation scripts.
In reality they represent critical production infrastructure.
They define how code moves through the delivery system, how security scans are executed, how compliance evidence is collected, and ultimately how deployments reach production environments. If pipeline creation is uncontrolled, the entire delivery system becomes fragile.
The financial institution solved this problem with a remarkably simple model. Pipelines are built in the non-prod staging organization. Templates are promoted through Git governance workflows. Production pipelines consume those approved templates.
Nothing more. Nothing less.
Final takeaway
Modern CI/CD platforms have dramatically accelerated the speed of software delivery.
But in regulated environments, the true achievement lies elsewhere. It lies in building a platform where developers move quickly, security remains embedded within the delivery workflow, governance is enforced automatically, and production environments remain protected from uncontrolled change.
That is not just CI/CD. That is platform engineering done right.
Introducing Zero Trust Architecture for Software Delivery

Introducing Zero Trust Architecture for Software Delivery
Move beyond RBAC and gates. Discover how to create a "last line of defense" for your SDLC by validating every automated task at the runner level.
April 2, 2026
Time to Read
For the world’s largest financial institutions, places like Citi and National Australia Bank, shipping code fast is just part of the job. But at that scale, speed is nothing without a rock-solid security foundation. It’s the non-negotiable starting point for every release.
Most Harness users believe they are fully covered by our fine-grained Role-Based Access Control (RBAC) and Open Policy Agent (OPA). These are critical layers, but they share a common assumption: they trust the user or the process once the initial criteria are met. If you let someone control and execute a shell script, you’ve trusted them to a great extent.
But what happens when the person with the "right" permissions decides to go rogue? Or when a compromised account attempts to inject a malicious script into a trusted pipeline?
Harness is changing the security paradigm by moving beyond Policy as Code to a true Zero Trust model for your delivery infrastructure.
The Challenge: When Permissions Aren't Enough
Traditional security models focus on the "Front Door." Once an employee is authenticated and their role is verified, the system trusts their actions. In a modern CI/CD environment, this means an engineer with "Edit" and "Execute" rights can potentially run arbitrary scripts on your infrastructure.
If that employee goes rogue or their credentials are stolen, RBAC won't stop them. OPA can control whether shell scripts are allowed at all, but it often struggles to parse the intent of a custom shell script in real-time.
The reality is that verify-at-the-door is a legacy mindset. We need to verify at execution time. CI/CD platforms are a supply-chain target that are often targeted. The recent attack against the Checkmarx GitHub Action has been a painful reminder of the lesson the Solarwinds fiasco should have taught the industry.
Introducing Harness Zero Trust
Harness Zero Trust is a new architectural layer that acts as a mandatory "interruption" service at the most critical point: the Harness Delegate (our lightweight runner in your infrastructure).
Instead of the Delegate simply executing tasks authorized by the control plane, it now operates on a "Never Trust, Always Verify" basis.
How It Works: The Final Line of Defense
When Zero Trust is enabled, the Harness Delegate pauses before executing any task. It sends the full execution context to a Zero Trust Validator, a service hosted and controlled by your security team.
This context includes:
- User Identity: Who triggered the action?
- Task Specifics: Exactly what is the Delegate being asked to do?
- Script Content: The full body of any shell scripts.
- Environment Variables: The inputs and secrets being injected into the task.
The Delegate waits a moment. Only if the validator returns a "True" signal does the task proceed. If the signal is "False," the execution is killed instantly.
Why This Matters for Enterprise DevSecOps
By moving validation to the Delegate level, we provide a "Last Line of Defense" that hits several key enterprise requirements:
- Rogue Employee Protection: Even if a user has the rights to run a pipeline, your security service can flag suspicious patterns (like a script attempting to delete a production database or exfiltrate data) and stop it before it starts.
- Architectural Superiority: While competitors struggle with stability and baseline security, Harness is doubling down on a hardened architecture. RBAC protects the door; OPA governs the "what"; and Zero Trust validates the "how."
- Custom Judgement: Because Harness sends the complete task details, you can point this validator at a customer algorithm or an AI-powered security tool to judge the "safety" of scripts in real-time. Essentially, you are peer-reviewing every line of automation at execution time.
The Takeaway
We built this capability alongside some of the world's most regulated institutions to ensure it doesn't become a bottleneck. It’s designed to be a silent guardian. It shuts down the 1% of rogue actions while the other 99% of your engineers continue to innovate at high velocity.
The bottom line: at Harness, we believe that the promise of AI-accelerated coding must be met with an equally advanced delivery safety net. We’re building out that safety net every day. Zero Trust is the next piece.
From Chaos to Confidence: Debunking the 3 Biggest Myths of Chaos Engineering

From Chaos to Confidence: Debunking the 3 Biggest Myths of Chaos Engineering
Chaos engineering isn’t risky or exclusive. It uses controlled, hypothesis-driven tests to improve resilience, complement QA, and build system confidence.
April 2, 2026
Time to Read
Many organizations hesitate to adopt chaos engineering because of persistent misconceptions that make it seem reckless or reserved for tech giants.
But the reality is far more practical and far more accessible.
Drawing from experience building the chaos engineering program at Target.com, Matt Schillerstrom breaks down the three biggest myths holding teams back and what is actually true.
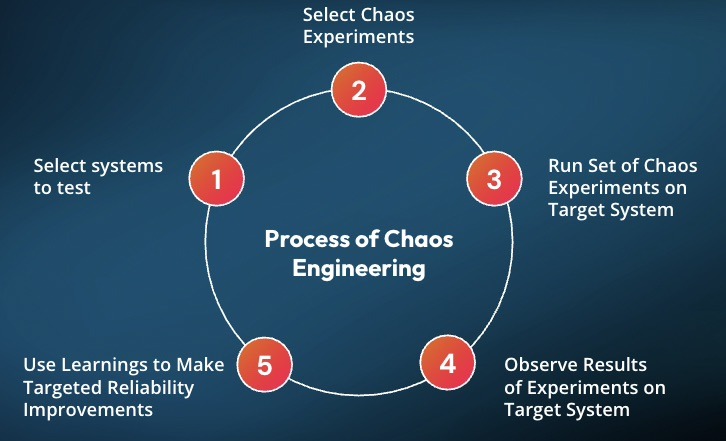
Myth 1: Chaos Engineering Means Random Failure
The fear is understandable. Engineers unplugging servers, triggering outages, and hoping for the best.
The Reality: Chaos engineering is not random. It is disciplined, which helps teams build trust and confidence in their systems.
It is built on hypothesis-driven experimentation. Every test starts with a clear expectation: what should happen if this component fails?
Instead of breaking things randomly, teams run controlled experiments. For example, stopping one out of ten servers to observe how the system adapts. These scenarios are planned, reviewed, and executed with intention.
At Target, when Matt was working with engineering teams, they would learn something before running a test by getting the whole team aligned on the experiment's hypothesis. It would require teams to review their architecture diagrams, documentation, and runbooks, often revealing issues before a test was started.
The goal is not disruption. The goal is learning.
Today, teams are taking this further with AI, automatically identifying resilience risks and generating experiments before issues reach production.
Read how this works in practice: AI-Powered Resilience Testing with Harness MCP Server and Windsurf
Myth 2: It’s Only for FAANG Companies
Chaos engineering is often associated with Netflix, Google, and other hyperscalers. That makes it feel out of reach.
The Reality: You do not need massive scale to get meaningful value.
You can start small today.
A simple experiment, such as increasing memory utilization on a single service, can reveal whether your auto-scaling actually works. These small tests validate that the resilience mechanisms you are using will function when issues happen, rather than having your customers impacted.
What matters is not scale. What matters is consistency and learning how your system behaves under stress.
Myth 3: Chaos Engineering Replaces Traditional Testing
Some teams worry that adopting chaos engineering means replacing QA or existing testing workflows.
The Reality: Chaos engineering strengthens what you already do.
At Target, chaos experiments were layered into monthly load testing. While simulating peak traffic, failure scenarios such as payment authorization latency were introduced to observe system behavior under real pressure.
This approach does not replace testing. It makes it more realistic and more valuable.
Build Confidence, Not Chaos
Chaos engineering is not about breaking systems. It is about understanding them.
When teams move from ad hoc testing to small, continuous, hypothesis-driven experiments, they gain something far more valuable than test results. They gain confidence.
Confidence that their systems will behave as expected.
Confidence that failures will not become outages.
Confidence that they are ready for the unexpected.
See It in Action
If you are thinking about chaos engineering, the best way to understand it is to start.
Harness helps teams safely design, run, and learn from controlled chaos experiments without putting production at risk.
Want to try your first chaos engineering test? Sign up for your free Resilience Testing account today. Prefer a hands-on demo with an expert? Click here for a personalized demo.
Get Ship Done: Everything We Shipped in March 2026
.png)
Get Ship Done: Everything We Shipped in March 2026
March 2026: Shipping Features to Close the AI Velocity Paradox
April 2, 2026
Time to Read
According to our AI Velocity Paradox report, many engineering teams say AI has made them ship code faster, but quality and security issues have exasperated across the SDLC. That gap is the whole story. AI coding assistants are compressing the time to write and commit code, but the bottlenecks have just moved downstream: into builds, security scans, deployment pipelines, incident response, and cost controls. In March, we shipped 55 features, most of them targeting exactly those downstream stages. This is what closed-loop AI velocity looks like.
AI Built Into Every Step
Harness MCP v2 (Early Preview)
The next version of the Harness MCP server is rolling out to early access customers. It ships with 10 unified tools, CRUD and execute support across 119+ resource types, and 26 built-in prompt templates that chain tools together for multi-step workflows, debug a pipeline failure, deploy an app, review DORA metrics, and triage vulnerabilities. Install it in one command: npx harness-mcp-v2. No cloning, no local setup.
Learn more about how we redesigned our MCP server to be more agentic AI-friendly.

AI Skills for Your IDE
A new skills repository sits on top of MCP to let AI coding assistants, such as Claude Code, Cursor, and OpenAI Codex, act within Harness without the user needing to know Harness. Skills are structured instruction files. "Create a CI pipeline for my Node.js app" turns into the right tool calls automatically.
GitOps Troubleshooting via AI
The AI velocity paradox doesn't end at deployment. It continues into operations, especially in systems like GitOps, where small configuration issues can cascade quickly.
Harness AI now understands GitOps entities and can detect misconfigurations in manifests, identify missing dependencies or clusters, diagnose connectivity issues, and suggest fixes in context. With the expansion of the "Ask AI" assistant into GitOps, teams can troubleshoot issues directly where they occur, not after the fact.
Watch GitOps and Harness AI in action:
AI Chat: OPA Policy Enforcement on Generated Resources
With Harness AI, users can now do much more around Open Policy Agent (OPA). AI-driven entity creation is now automatically evaluated against your organization's Open Policy Agent policies, so when the agent generates a Harness resource, it checks compliance in real time and surfaces validation messages directly in the chat. This means governance isn't a post-creation audit; it's baked into the moment of creation.

Security Baked Into the Pipeline
EPSS-Based Vulnerability Prioritization
Vulnerability prioritization now includes EPSS (Exploit Prediction Scoring System) scores alongside CVSS severity. EPSS predicts the probability that a CVE will be exploited in the wild within 30 days. Teams can stop triaging by theoretical severity and focus on the vulnerabilities that attackers are actively targeting.

Manual Severity Override
Security teams can now adjust scanner-assigned severity levels when the tool's rating doesn't match real-world risk in their environment. Override the score, add context, and move on.
Full OSS Dependency Visibility
Supply Chain Security now covers both direct and transitive (indirect) open source dependencies in code repositories, with vulnerability intelligence from the Qwiet database. When a vulnerable child dependency is three layers deep, you can see exactly where it was introduced and trace the path to fix it.
AutoFix Directly in GitHub Pull Requests
A new GitHub App delivers AI-generated security fixes from Harness SAST and SCA scanning directly inside the GitHub PR workflow. Developers get automated fix suggestions and can have a back-and-forth conversation about the remediation without leaving GitHub.
AutoFix for Harness Code Repositories
The same AutoFix capability now works in Harness Code. SAST and SCA scans automatically open pull requests with AI-generated fixes, including plain-language explanations of what was changed and why.
Dependency Firewall
The Artifact Registry Dependency Firewall now ships with a full Harness CLI, letting developers audit dependencies for npm, Python, Maven, NuGet, and Go packages before they hit a build. Maven and Gradle plugins are included. In testing against a multi-module Maven project, artifact upload time improved 10x compared to standard flows.
AI Discovery for Your AI Ecosystem
Automatically discovers AI assets across models, APIs, and MCP servers in your environment. Provides deep visibility into prompts, responses, tool usage, and data flows, with continuous posture evaluation and centralized governance controls.
AI Firewall (Beta)
Runtime protection for AI applications: detects prompt injection, model misuse, unsafe outputs, and data leakage across multi-hop AI application flows with policy-driven enforcement.
DAST AI Testing (Beta)
DAST for LLM applications covering the OWASP LLM Top 10 vulnerability categories. Runs during development, before production.
Secure AI Coding in Cursor, Windsurf, and Claude (Beta)
Real-time security scanning now runs inside AI-native development environments. The existing IDE extension handles the integration; no new tooling is required.
Deploy Faster and More Reliably
Feature Flags as First-Class Pipeline Steps
14 out-of-the-box feature flag steps are now available in the step library: create flags, manage targets, set allocations, trigger kill switches. Combine them with approvals and manual gates to coordinate releases exactly when you want them to happen.
OPA Governance for Feature Flags
Policy as Code rules can now be enforced on feature flag saves, applying the same governance model you use for pipelines to your flag configurations.
Feature Flag Archiving
Retire feature flags without deleting them. Archived flags stop being sent to SDKs and disappear from default views, but all historical data, impressions, configurations, and audit logs are preserved for compliance and analysis.
ECS Scale Step
Scale ECS services up or down without triggering a full deployment. This is a dedicated step; it doesn't touch your service definition or redeploy anything.
ECS Scheduled Actions
Define time-based auto-scaling policies for ECS services directly in Harness, using the new EcsScheduledActionDefinition manifest type.
Helm Values Overrides in Service Hooks
Native Helm deployments can now expose Harness values overrides to service hooks before Helm runs. Use this to decrypt override files (e.g., with SOPS) in a pre-run hook.
Host Groups for WinRM Deployments
Physical data center WinRM deployments can now assign independent credentials to different groups of hosts within a single infrastructure definition. Unblocks environments running Just Enough Administration (JEA) configurations where each server group has distinct endpoint settings.
Google Cloud Storage for MIG Manifests
Managed Instance Group deployments on GCP can now pull manifests and templates from Google Cloud Storage.
Pipeline Notifications for Approval Waits
Pipelines now send notifications the moment they pause for user input, such as approvals, manual interventions, or runtime inputs.
Faster Builds
CPU and Memory Metrics in Build Execution View
Build stages now display real-time CPU and memory usage directly in the execution view. Use it to right-size infrastructure and troubleshoot memory pressure before it causes failures.
Branch-Based Build Version Counters
Build numbers now track independently per branch. Teams running parallel branches no longer share a global counter.
Real-Time Step Status for Container Step Groups
Container-based step groups report step status in real time during execution rather than waiting for the group to complete.
Cache Intelligence: Azure Blob Storage
Build caches can now be stored and retrieved from Azure Blob Storage with principal authentication and OIDC-based access.
Cache Intelligence: Go Builds on Linux
Automatic dependency caching is now available for Go projects building on Linux.
Docker Proxy Auto-Detection
The Docker Build and Push plugins now automatically detect and pass HARNESS_HTTP_PROXY, HARNESS_HTTPS_PROXY, and HARNESS_NO_PROXY as Docker build arguments. No manual proxy configuration needed.
API and Runtime Security
Traceable Now Embedded in Harness
Traceable's API security capabilities, discovery, inventory, threat detection, and runtime protection are now accessible directly in the Harness UI as a native embedded experience, without switching tools or tabs.
Self-Service Bot and Abuse Protection Policies
Bot and abuse protection now supports self-serve policy templates. The Velocity/Aggregation template lets you write rules like "Flag all users who have logged in from more than 5 countries in the last 30 minutes" or "Flag bot IPs distributing attacks across more than 10 countries over 24 hours." Covers both fast-moving and slow distributed attack patterns.
Dynamic Payload Matching in Custom API Policies
Custom policies, such as signature, rate-limiting, DLP, enumeration, and exclusion, now support dynamic payload matching. Both sides of a comparison can reference live values from the request, response, or extracted attributes.
Incident Response, Upgraded
Native ServiceNow Actions in Runbooks
Runbooks can now create ServiceNow incidents, update records, and add comments natively, without custom webhook configuration. Fields pull dynamically from your ServiceNow instance. Previously, this required PagerDuty or OpsGenie to accomplish via custom integrations; it's now first-class.
Reusable Webhook Templates
Configure a webhook once, save it as a template, and reuse it across integrations. Templates are organization-scoped and use copy-on-write, i.e., changes don't propagate to existing webhooks.
Named Alert Rules
Alert rules now support custom display names. Identify and manage rules by name instead of opaque identifiers.
Active Pages View for On-Call
On-call users can now see all currently active pages from a single view: status, assigned responders, escalation progress, and acknowledgment state in one table.
Cloud Cost Visibility
Partial Savings Auto-Inference
The savings inference engine now detects partial infrastructure changes, not just fully realized ones. Track savings as they accumulate, not only after a recommendation is fully implemented.
AWS Cost Optimization Hub Integration
Recommendations now expand across all major AWS resource types. Moving from Cost Explorer Hub to Cost Optimization Hub, with AWS costs shown as net-amortized directly from the console.
Anomaly Whitelisting for Reserved Instances and Savings Plans
Whitelist expected RI/SP billing events, renewals, purchases, and adjustments, to reduce false-positive noise in anomaly detection.
Budgets Decoupled from Perspectives
Budgets no longer require a Perspective to exist first. They're now based on Cost Categories, making them importable into BI dashboards and usable in more governance contexts.
Cluster Orchestrator Savings Report
A read-only savings report shows projected savings before Cluster Orchestration is enabled and actual savings after. Understand the value before committing, then track realized results over time.
Node Pool Recommendations with Cloud Billing Tags
Node pool recommendations now surface AWS cost allocation and environment tags alongside Kubernetes node labels, giving recommendations more operational context.
Database Changes Without the Drama
Snowflake Support
Harness Database DevOps now supports Snowflake with OAuth, PKI, and username/password authentication for apply and rollback steps.
Online Schema Changes for MySQL with Percona Toolkit
Run online schema changes on MySQL with zero table locks. Enable it from the DB schema edit dialog.
Keyless Auth for Google Spanner
Authenticate to Cloud Spanner using Workload Identity, eliminating service account keys from Spanner deployments entirely.
Code Management
Repo Forking
Harness Code now supports repository forking. Developers can fork any repo, make changes, and open a pull request back to the upstream source, the same workflow as GitHub.
Git LFS Upload Performance
Large file uploads via Git LFS are faster. File content now streams during OID calculation instead of buffering in memory.
Automated Testing
On the testing/AI Test Automation side, updates focused on handling complexity at scale: better organization with nested test tasks, improved traceability with Jira integration, more flexible AI-driven test creation, and UX improvements for navigating large test suites. Because if AI increases the volume of changes, testing systems need to become more adaptive, not more manual.
Other Updates
- Platform: Proactive email alerts at 80%, 95%, and 100% of account resource limits (users, projects, connectors, secrets, roles) with up to 5 configurable recipients.
- Build logs now display the actual machine size name (e.g., medium) instead of the internal flex label.
- Chaos Engineering: Splunk Observability probe support, user-defined variables, load test integration, native Windows network chaos faults, Linux chaos faults (network, API, JVM, process, service, DNS, disk fill), and Disaster Recovery component support added.
- AI SRE documentation restructured into separate tracks for administrators and incident responders.
Conclusion
The throughput you see here, 55 features in 31 days, reflects what happens when the AI acceleration loop closes end to end. Teams writing code faster with AI agents need pipelines, security scans, deployments, and incident response to keep pace. That's the bet we're making: engineering velocity compounds when AI works across the entire delivery chain, not just the code-generation process. What's next? Look out for our April updates.
Cost Awareness in CI/CD Pipelines: A FinOps Guide
.jpg)
Cost Awareness in CI/CD Pipelines: A FinOps Guide
Integrate cost awareness in CI/CD pipelines to optimize cloud spend and empower DevOps teams. Learn how Harness helps.
April 1, 2026
Time to Read
The Problem with Ignoring Cost in CI/CD
If you’ve ever pushed a feature branch that quietly triggered multiple production deployments—and only realized the impact when the AWS bill jumped 240% month-over-month—you already understand the problem.
Cost awareness in CI/CD pipelines isn’t about slowing teams down. It’s about avoiding financial surprises that lead to tense finance meetings and urgent cost-cutting exercises.
Many platform engineering teams treat cloud spend as something to review after deployment. Code ships. Infrastructure scales. Services consume resources. Weeks later, someone from finance posts a Slack screenshot of a sharply rising spend graph. By that point, the expensive workload has been running for days or weeks. Rolling it back risks disruption. And the engineers who shipped it are already focused on the next sprint.
That reactive model might work when cloud usage is stable and margins are wide. It breaks down quickly as deployment velocity increases and systems become more complex. Without pipeline cost visibility built into your workflows, teams optimize purely for speed—without seeing the financial impact of each merge.
Why CI/CD Cost Awareness Fails by Default
Traditional pipelines are designed for one purpose: delivering code to production quickly and reliably. Teams track build duration, deployment success rates, and test coverage. But cloud cost governance pipelines? That usually sits outside the CI/CD system.
This creates a structural gap.
Engineers making deployment decisions rarely see the cost implications of those decisions in real time. You can monitor CPU usage, memory, and latency—but not that your new microservice is quietly generating $400 per day in cross-region data transfer charges.
That disconnect leads to friction:
- Engineers optimize for performance and functionality.
- Finance focuses on budgets and spend controls.
- Platform teams are left reconciling the two after costs have already accumulated.
By the time a cost spike is discovered, the context behind the deployment is often lost. The feedback loop is simply too slow.
At enterprise scale, small inefficiencies compound. One team’s cost regression might be negligible. Ten teams introducing cost-heavy services every week becomes a serious budget issue. Without infrastructure cost tracking at the pipeline level, you can’t clearly attribute increases to specific deployments or commits. You see total spend rising—but not what caused it.
Building Cost Awareness into CI/CD Workflows
The goal isn’t to introduce manual approvals or slow down delivery. The goal is to make cost data visible early enough for teams to make smarter decisions before code hits production.
1. Automated Cost Feedback Loops
One of the most effective ways to enable CI/CD cost optimization is by integrating automated cost feedback loops directly into pipeline stages.
Before a deployment completes, your system should estimate the incremental cost impact and surface it alongside build and test results.
For example:
- Deploying a Kubernetes service? Estimate compute, storage, and networking costs based on the manifest.
- Provisioning infrastructure via Terraform? Calculate projected monthly run rate before applying changes.
- Scaling a service? Predict resource usage and associated cost impact.
The estimates don’t need to be perfect. Directional accuracy is enough to catch major regressions. If a deployment is projected to increase monthly spend by 30%, that’s a signal to pause and evaluate. If the cost delta is minimal, the pipeline proceeds normally.
This approach enables build pipeline cost control without adding unnecessary friction.
2. Pipeline Cost Visibility and Budget Guardrails
Once cost data flows through your pipelines, the next step is establishing budget guardrails.
Pipeline cost visibility allows you to define thresholds—for example, triggering a review if service-level spend increases by more than 20%. This doesn’t block innovation; it simply ensures cost increases are intentional.
With this model:
- Teams deploy freely within defined cost parameters.
- Significant cost jumps trigger additional context or approval.
- Cost regressions are caught before they become financial escalations.
Infrastructure cost tracking at the pipeline level also improves attribution. Instead of reviewing spend by account or department, you can tie cost increases directly to individual pipeline runs and commits. That clarity makes DevOps cost management far more actionable.
3. Shifting Cost Ownership Left
True FinOps CI/CD integration means shifting cost ownership closer to the engineers making infrastructure decisions.
Cost becomes a first-class operational metric—alongside performance, reliability, and security.
When cost data lives in the same interface as builds and deployments, teams naturally factor it into trade-offs. You reduce the need for reactive enforcement because engineers can see and adjust in real time.
This alignment benefits everyone:
- Engineers maintain speed.
- Platform teams maintain control.
- Finance gains visibility and predictability.
Cloud cost governance pipelines work best when they support engineering velocity—not compete with it.
How Harness Cloud Cost Management Enables Pipeline-Level Cost Awareness
Harness Cloud Cost Management is designed to connect DevOps execution with financial accountability.
Unlike traditional tools that focus on billing-level reporting, Harness embeds pipeline cost visibility directly into CI/CD workflows. Engineers receive real-time cost feedback in the same system where they manage builds and deployments.
Key capabilities include:
- Service- and pipeline-level cost analysis
- Cost anomaly detection and trend monitoring
- Policy-based budget thresholds and governance controls
- Cost allocation, showback, and chargeback models
If a deployment exceeds predefined thresholds, the pipeline can automatically flag it or enforce policy-based controls—supporting consistent build pipeline cost control across teams.
By connecting cost allocation directly to services, teams, and pipeline runs, organizations gain granular insight into what drives spend. Conversations between finance and engineering become fact-based and collaborative rather than reactive.
For teams already using Harness CI/CD, adding cost awareness becomes a natural extension of existing workflows—no context switching required.
Learn more about Harness Cloud Cost Management and explore the cost visibility and governance capabilities available in the platform.
Embedding Cost Discipline Without Slowing Teams Down
Cloud cost management at scale can’t rely on monthly budget reviews or occasional optimization sprints. It has to be embedded where cost decisions actually happen: inside your CI/CD pipelines.
When engineers see cost impact in real time, they make smarter trade-offs.
When platform teams enforce guardrails programmatically, they prevent regressions early.
When finance has attribution tied to specific deployments, discussions become clearer and more productive.
Cost awareness in CI/CD pipelines isn’t friction—it’s context.
The teams that succeed with CI/CD cost optimization don’t treat cost as a constraint. They treat it as an operational signal that improves engineering decisions.
If your organization has struggled with unexpected cloud spend or unclear attribution, it may be time to rethink where cost visibility lives. Embedding DevOps cost management directly into your CI/CD workflows gives you the speed of modern delivery—without sacrificing financial control.
Defeating Context Rot: Mastering the Flow of AI Sessions

Defeating Context Rot: Mastering the Flow of AI Sessions
AI agents fail due to context rot—growing context degrades accuracy. Use plan, execute, reset, and checkpoints to keep outputs consistent and reliable.
April 1, 2026
Time to Read
In Part 1, we argued that most dev teams start in the wrong place. They obsess over prompts, when the real problem is structural: agents are dropped into repositories that were never designed for them. The solution was to make the repository itself agent-native through a standardized instruction layer like AGENTS.md.
But even after you fix the environment, something still breaks.
The agent starts strong. It understands the problem, follows instructions, seems super intelligent
Then, somewhere along the way, things begin to drift. The code still compiles, but the logic gets inconsistent. Small mistakes creep in. Constraints are ignored. Assumptions mutate.
Nothing fails loudly. Everything just gets slightly worse.
This is the second failure mode of AI systems: context rot.
Context Rot Is Not a Bug — It’s a Property
There is a persistent assumption in the industry that more context leads to better performance. If a model can handle large context windows, then giving it more information should improve accuracy.
In practice, the opposite is often true.
Recent research from Chroma shows that LLM performance degrades as input length increases, even when the model is operating well within its maximum context window. Similar observations are echoed across independent analyses, including this breakdown of why models deteriorate in longer sessions and practical explorations of how context mismanagement impacts production systems.
This is not an edge case. It is a structural limitation.
Models do not “understand” context in a hierarchical way. They distribute attention across tokens. As context grows, signal competes with noise. Important instructions lose weight. Irrelevant details gain influence. Conflicts accumulate.
What looks like a reasoning failure is often just context degradation.
Why Long Sessions Break Down
If you’ve worked with AI coding agents for more than a few hours, you’ve already seen this pattern.
A session starts with clear instructions and aligned reasoning. Over time, it fills with partial implementations, outdated assumptions, repeated instructions, and exploratory dead-ends. The model doesn’t forget earlier information, it simply cannot prioritize it effectively anymore.
Detailed guides on context management highlight this exact failure mode: as sessions grow, models become increasingly sensitive to irrelevant or redundant tokens, which degrade output quality. Platform-level documentation also reinforces the same principle - effective systems explicitly control how context is introduced, retained, and pruned.
In practice, this shows up as inconsistency. But underneath, it’s the predictable outcome of unmanaged context growth.
The Link Between Context Rot and Hallucination
This is where teams often misdiagnose the issue.
When agents hallucinate, the instinct is to blame the model. But hallucination is often downstream of context rot.
OpenAI’s work on hallucinations explains that models are optimized to produce plausible outputs even under uncertainty. When context degrades, uncertainty increases. The model fills gaps with statistically likely answers.
So the failure chain looks like this:
Context degradation → ambiguity → confident guessing → hallucination
In other words, hallucination is not always a knowledge problem.
It is often a context management problem.
Sessions Are Not Conversations
Most developers interact with AI through chat, so they treat sessions like conversations.
That mental model breaks at scale.
A long-running AI session is not a conversation. It is a stateful system.
And like any stateful system, it degrades without control.
Letting context accumulate indefinitely is equivalent to running a system without memory management. Eventually, performance collapses—not because the system is incapable, but because it is overloaded.
The Plan → Execute → Reset Discipline
Once you accept that context degrades, the solution becomes straightforward: you don’t try to out-prompt the problem. You control how context evolves.
Across production teams, a consistent pattern emerges:
Plan → Execute → Reset
This is not a trick. It is operational discipline.
Planning before execution
The most common mistake is asking the agent to write code immediately. This forces premature decisions and locks the model into an approach before it has fully understood the problem.
Instead, enforce a planning phase.
Have the model break down the task, identify dependencies, and surface uncertainties before implementation. This aligns closely with best practices in production-grade prompt engineering, where structured reasoning is prioritized over immediate generation.
Planning reduces unnecessary context growth and prevents incorrect assumptions from propagating.
Stepwise execution
Once the plan is validated, execution should be incremental.
Large, monolithic prompts create large, monolithic contexts—and those degrade fastest.
Stepwise execution keeps the working context focused. Each step introduces only the information required for that step. Errors are caught early, before they spread across the system.
This is not about slowing down development. It is about maintaining signal integrity.
Resetting the session
Even with disciplined execution, context will eventually degrade.
The only reliable solution is to reset.
This may feel inefficient, but in practice, it is one of the highest-leverage actions you can take. A fresh session restores clarity, removes noise, and re-establishes correct prioritization of instructions.
Modern context management approaches consistently emphasize this: keep context bounded, and reintroduce only what is necessary for the task at hand.
Meta-Prompting: Forcing the Model to Think First
One of the most effective techniques for preventing context rot is meta-prompting.
Instead of telling the model what to do, you tell it how to approach the task.
You explicitly require it to:
- identify assumptions
- highlight uncertainties
- ask clarifying questions
This interrupts the model’s default behavior of immediate generation.
Why does this work?
Because hallucinations are often driven by premature certainty. Meta-prompting introduces friction at exactly the right point—before incorrect assumptions become embedded in the context.
Checkpoints: Turning Drift into Signal
Context rot is dangerous because it is gradual and often invisible.
Checkpoints make it observable.
At key moments, you force the model to validate its output against:
- the original task
- repository constraints (AGENTS.md)
- architectural expectations
This transforms hidden drift into explicit feedback.
Instead of discovering problems at the end, you correct them continuously.
The Connection to Part 1
Part 1 of the series solved the problem of what the agent sees.
Part 2 addresses what happens over time.
AGENTS.md provides structure.
Session discipline preserves that structure.
Without AGENTS.md, the agent guesses.
Without discipline, the agent drifts.
You need both to achieve reliable outcomes.
Why This Matters Now
As teams move from experimentation to production, sessions become longer and more complex. Agents interact with more systems, touch more code, and accumulate more context.
This is where most failures emerge.
Not because the model is incapable, but because the workflow is uncontrolled.
Context rot is the primary bottleneck in real-world AI engineering today.
Before You Scale, You Stabilize
In Part 3, we turn to a different problem.
So far, we have focused on a single agent operating within a controlled session. That constraint makes it possible to reason about context, to reset it, and to keep it aligned with the task.
But most real systems do not stay within that boundary.
As soon as you introduce multiple agents, external tools, or retrieval systems, the problem changes. Context is no longer contained in a single session. It becomes distributed across components that do not share the same state or assumptions.
At that point, failures become harder to trace. Drift is no longer local. It propagates.
This is where orchestration becomes necessary, but also where it becomes risky.
Part 3 explores how to build these systems in a way that preserves the guarantees established here. We will look at how to introduce MCPs, subagents, and external integrations without losing control over context, consistency, or behavior.
Operationalizing Production Data Testing with Harness Database DevOps

Operationalizing Production Data Testing with Harness Database DevOps
Automate production data testing with Harness DB DevOps. Validate schema changes, rollback safety, and reduce deployment risk in CI/CD pipelines.
April 1, 2026
Time to Read
Testing database changes against production-like data removes risk from your delivery process but to be effective, it must be orchestrated, governed, and automated. Manual scripts and ad-hoc checks lack the repeatability and auditability required for modern delivery practices.
Harness Database DevOps provides a framework to embed production data testing into your CI/CD pipelines, enabling you to manage database schema changes with the same rigor as application code. Harness DB DevOps is designed to bridge development, operations, and database teams by bringing visibility, governance, and standardized execution to database changes.
Instead of treating testing with production data as an afterthought, you can define it as a pipeline stage that executes reliably across environments.
A Pipeline-Driven Reference Workflow
To incorporate production data testing into your delivery process, you define a Harness Database DevOps pipeline with structured, repeatable steps. The result is a governed testing model that captures evidence of correctness before any change ever reaches production.
Stage 1: Environment Provisioning and Data Preparation
In Harness Database DevOps, you begin by configuring the necessary database instances and schemas:
- DB Schemas are defined in Git, using Liquibase or Flyway changelogs or script-based SQL files under version control.
- DB Instances connect to your target environments with credentials and Delegate access configured.
For production data testing, you provision two isolated instances seeded with a snapshot of production data (secured and masked as needed). These instances are not customer-facing; they serve as ephemeral test targets.
This structure sets up identical baselines for controlled experimentation.
Stage 2: Schema Application Within a Harness Pipeline
Harness Database DevOps lets you define a deployment pipeline that incorporates database and application changes in the same workflow:
- Pipelines unify database deployments with application delivery.
- You add stages such as “Apply Schema Changes” that reference your DB Schema and DB Instance.
Using Liquibase or Flyway via Harness, the pipeline applies schema changes to Instance A while Instance B remains the baseline.
This step executes the migration in a real, production-scale context, capturing performance, constraint behaviors, and other runtime characteristics.
Stage 3: Automated Rollback and Undo Migration Testing
A powerful capability of Harness Database DevOps is automated rollback testing within the pipeline:
- The pipeline can execute undo migrations to revert schema changes.
- Pipelines track execution results and rollback outcomes, enabling teams to validate that undo logic works reliably.
Testing rollback paths removes the assumption that reversal will work in production, a key risk often untested in traditional workflows.
Stage 4: Comparison Against Baseline and Validation
After rollback, you compare Instance A (post-rollback) with Instance B (untouched):
- At this point, they should be identical in schema and data state.
- Tools designed for database comparisons (e.g., DiffKit) can be integrated to perform row-level and schema-level verification, highlighting hidden drifts or silent mutations.
If disparities are detected, the pipeline can fail early, prompting review and remediation before production deployment.
This approach builds evidence rather than assumptions about the quality and safety of database changes.
How This Aligns with Harness Capabilities?
The updated workflow aligns with the documented capabilities of Harness Database DevOps:
- Orchestration of database changes as part of CI/CD pipelines with visibility across environments.
- Governance and approvals, so schema changes are reviewed and compliant.
- Integrated rollback support for automated undo migrations.
- Unified interface and audit trails to track which changes ran where and when.
Importantly, the workflow does not assume native data cloning features within Harness itself. Instead, it positions data-centric operations (cloning and validation) as composable steps in a broader automation pipeline.
Strategic Outcomes for Engineering Teams
Embedding production data testing inside Harness Database DevOps pipelines delivers measurable outcomes:
- Reduced risk of production incidents by catching issues early.
- Repeatable, auditable delivery practices, aligning database changes with application code flows.
- Clear rollback evidence, not just theoretical promise.
- Improved collaboration between developers and DBAs through pipeline transparency.
This integrated, pipeline-oriented approach elevates database change management into a disciplined engineering practice rather than a set of isolated tasks.
Conclusion
Database changes do not fail because teams lack skill or intent. They fail because uncertainty is tolerated too late in the delivery cycle when production data, scale, and history finally collide with untested assumptions.
Testing with production data, when executed responsibly, shifts database delivery from hope-based validation to evidence-based confidence. It allows teams to validate not just that a migration applies, but that it performs, rolls back cleanly, and leaves no hidden drift behind. That distinction is the difference between routine releases and high-severity incidents.
By operationalizing this workflow through Harness Database DevOps, organizations gain a governed, repeatable way to:
- Treat database changes as first-class citizens in CI/CD
- Validate forward and rollback paths against real data
- Produce auditable proof of correctness before production
- Scale database delivery without scaling risk
This is not about adding more processes. It is about removing uncertainty from the most irreversible layer of your system.
Explore a Harness Database DevOps to see how production-grade database testing, rollback validation, and governed pipelines can fit seamlessly into your existing workflows The fastest teams don’t just deploy quickly, they deploy with confidence.
Shift-Left FinOps: Proactive Cloud Cost Control

Shift-Left FinOps: Proactive Cloud Cost Control
Shift-Left FinOps moves cost optimization earlier in development. Reduce cloud waste with governance and automation. Learn more.
April 1, 2026
Time to Read
What Is Shift-Left FinOps?
Shift-Left FinOps reframes cloud cost optimization as an engineering responsibility rather than a retrospective financial review.
Instead of analyzing cloud spend after infrastructure has already been deployed, organizations integrate FinOps automation and cost governance directly into development workflows.
Developers receive immediate feedback about the financial impact of infrastructure changes during development, not weeks later during billing reconciliation.
This approach aligns FinOps best practices with modern platform engineering workflows built around:
- Infrastructure as Code (IaC)
- automated CI/CD pipelines
- Policy as Code governance
- real-time cost visibility
The result is proactive cost management, where waste is prevented before resources ever reach production.
Why Traditional FinOps Creates Cloud Cost Governance Gaps
Most organizations still treat FinOps as a retrospective discipline.
Finance teams review monthly cloud bills, identify anomalies, and ask engineering teams to investigate cost spikes.
This approach worked when infrastructure provisioning happened slowly through manual processes.
Modern cloud environments operate differently.
Teams now deploy infrastructure changes dozens or even hundreds of times per day through automated pipelines.
By the time billing data arrives, the operational context behind those provisioning decisions has already disappeared.
This delay introduces several operational challenges.
Cost Attribution Becomes Difficult
Without consistent tagging and governance policies, organizations struggle to determine:
- which team owns specific resources
- which service generated costs
- which environment the infrastructure belongs to
Missing metadata makes cloud financial management and cost attribution significantly harder.
Optimization Becomes Reactive Remediation
When cost issues are discovered weeks later, teams must retrofit governance controls onto already-running infrastructure.
This reactive approach introduces operational risk and disrupts delivery schedules.
Instead of preventing waste, teams are forced into post-deployment cloud cost optimization efforts.
Developers Lack Cost Visibility
Developers often make infrastructure decisions without understanding their financial implications.
Without real-time cost visibility, engineers cannot evaluate tradeoffs between:
- instance sizes
- storage tiers
- managed service configurations
Shift-Left FinOps addresses these problems by embedding Infrastructure as Code cost control and governance earlier in the development lifecycle.
Core Components of Shift-Left FinOps Implementation
Implementing Shift-Left FinOps requires three foundational capabilities:
- Policy as Code governance
- Infrastructure as Code cost control integration
- Automated cost visibility and feedback loops
Together, these capabilities enable FinOps automation and proactive cost management across cloud environments.
Codifying Cloud Cost Governance with Policy as Code
Policy as Code frameworks translate financial governance requirements into enforceable rules.
These rules automatically evaluate infrastructure definitions before resources are deployed.
Instead of relying on documentation or manual enforcement, policy as code provides automated cloud cost governance directly within engineering workflows.
Effective cost governance policies typically address three categories of waste.
Tagging Enforcement
Policies ensure every resource includes metadata required for cost attribution.
Examples include:
- environment
- team ownership
- cost center
Resource Sizing Policies
Governance rules prevent developers from provisioning oversized instances for workloads that do not require maximum capacity.
This supports long-term cloud cost optimization and prevents overprovisioning.
Lifecycle Management Policies
Policies identify resources missing automated shutdown schedules, retention rules, or lifecycle controls.
These controls prevent idle resources from generating unnecessary costs.
Example conceptual tagging policy:
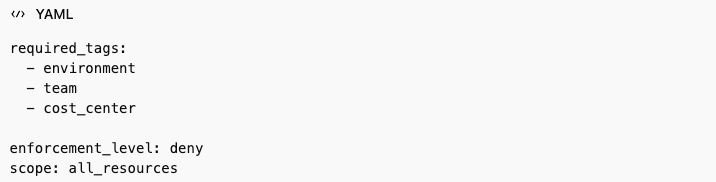
With Policy as Code enforcement, developers receive immediate feedback during infrastructure validation rather than after deployment.
Integrating Infrastructure as Code Cost Control into Development Workflows
Infrastructure as Code provides the technical foundation for shift-left cloud cost governance.
IaC allows infrastructure changes to be:
- reviewed
- tested
- validated
- audited
before deployment.
These characteristics create natural enforcement points for Infrastructure as Code cost control policies.
Local Development Validation
Developers run policy checks locally before committing infrastructure changes.
This prevents cost policy violations from entering shared repositories.
Early validation enables proactive cost management during development.
CI/CD Pipeline Enforcement
Pull request pipelines automatically validate infrastructure definitions against governance policies.
If cost policies fail, the merge is blocked.
Example validation workflow:
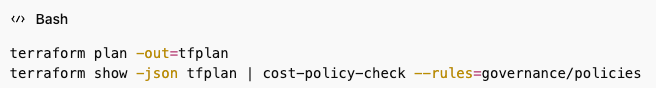
This ensures consistent cloud cost governance across all infrastructure deployments.
Deployment Pipeline Validation
Production deployment pipelines include a final validation step before infrastructure changes are applied.
This layered validation model creates defense in depth for FinOps automation:
- development validation prevents wasted effort
- CI/CD validation prevents policy drift
- deployment validation prevents actual cost impact
Enabling Real-Time Cost Visibility for Developers
Shift-Left FinOps only works when developers have access to cost insights during infrastructure planning.
Without cost visibility, governance policies feel arbitrary and difficult to follow.
Cost estimation should occur during infrastructure planning stages, not after deployment.
When developers run terraform plan, they should also see estimated monthly costs associated with proposed infrastructure changes.
This allows developers to evaluate architectural tradeoffs such as:
- instance sizing
- storage tier selection
- service configuration
Integrating cost feedback into existing workflows improves adoption.
Examples include:
- pull request comments showing cost impact
- budget alerts routed to engineering channels
- optimization recommendations during infrastructure review
These feedback loops support FinOps best practices by making cost awareness part of everyday development work.
Common Pitfalls in Shift-Left FinOps Implementation
Organizations implementing shift-left cloud cost governance frequently encounter predictable challenges.
Understanding these patterns helps teams implement FinOps automation successfully.
Overly Restrictive Policies
Governance policies that generate frequent false positives slow developer velocity.
Developers may attempt to bypass governance controls.
Policies should focus on real sources of cloud cost waste.
Manual Governance Processes
Shift-left cost governance fails when platform teams must manually review every infrastructure change.
All governance rules should be automated through Policy as Code and CI/CD validation pipelines.
Lack of Cost Context
Providing policies without cost visibility creates confusion.
Developers need both:
- clear governance rules
- cost impact insights
Disrupting Developer Workflows
Successful governance systems integrate into existing workflows such as:
- Terraform development
- pull request review
- CI/CD deployment pipelines
The most effective governance systems remain invisible until violations occur.
Implementing Proactive Cost Management with Harness Cloud Cost Management
Harness Cloud Cost Management enables organizations to implement Shift-Left FinOps and proactive cost management at scale.
The platform integrates FinOps automation and cost governance directly into platform engineering workflows.
Harness CCM connects cloud environments across:
- AWS
- Azure
- GCP
This provides unified cost visibility across multi-cloud infrastructure.
Real-time cost allocation allows developers to see cost breakdowns during infrastructure provisioning rather than waiting for billing cycles.
Teams can enforce governance policies such as:
- tagging requirements
- resource sizing policies
- budget constraints
These policies automatically validate infrastructure changes during development and CI/CD pipelines.
Harness CCM also supports cloud cost optimization through automated insights and recommendations, including:
- rightsizing underutilized instances
- deleting orphaned resources
- optimizing storage tiers
These capabilities help organizations implement modern cloud financial management practices while maintaining developer velocity.
Frequently Asked Questions
How does Shift-Left FinOps support cloud cost optimization?
Shift-Left FinOps prevents waste before resources are deployed by embedding cost governance directly into development workflows.
This proactive model improves cloud cost optimization and cloud financial management outcomes.
What tools enable Policy as Code cost governance?
Typical implementations include:
- Infrastructure as Code tools such as Terraform
- policy frameworks like Open Policy Agent
- CI/CD pipeline integrations
These technologies enable automated cloud cost governance through policy as code.
Does shift-left governance slow developer velocity?
No. When implemented correctly, automated cost policies provide immediate feedback without manual approvals.
This improves delivery speed while maintaining cost control and FinOps automation.
How do organizations enforce governance across multiple clouds?
Organizations define standardized governance policies that apply across AWS, Azure, and GCP.
These policies focus on universal patterns such as:
- tagging
- resource sizing
- lifecycle management
This approach supports consistent multi-cloud cost governance and financial management.
Conclusion
Shift-Left FinOps transforms cloud cost optimization from a reactive financial process into a proactive engineering practice.
By embedding Policy as Code governance, Infrastructure as Code cost control, and automated FinOps workflows into development pipelines, organizations prevent waste before infrastructure reaches production.
The result is stronger cloud cost governance, improved cloud financial management, and more efficient cloud operations.
Developers gain real-time cost insights.
Platform teams enforce governance automatically.
Finance teams gain accurate cost attribution across environments.
At the scale of modern cloud infrastructure, proactive cost management is essential for sustainable cloud growth.
The Dangerous Myth: “We Have SCA, So We’re Covered”

The Dangerous Myth: “We Have SCA, So We’re Covered”
SCA alone isn’t enough. Secure your supply chain by governing pipelines, artifacts, containers, and AI across build, promotion, and runtime stages.
April 1, 2026
Time to Read
- SCA provides visibility into open source risk but leaves artifacts, pipelines, containers, and AI components exposed.
- CI/CD pipelines are privileged infrastructure and must be treated as zero-trust environments.
- Build systems are a critical trust boundary; artifact attestation and registry gating are essential.
- Container images, third-party integrations, and AI models are now active supply chain attack vectors.
- True supply chain security requires control at ingest, build, promotion, and runtime — not just scanning.
Most organizations begin their software supply chain journey the same way: they implement Software Composition Analysis (SCA) to manage open source risk. They scan for vulnerabilities, generate SBOMs, and remediate CVEs. For many teams, that feels like progress—and it is.
But it is not enough.
As discussed in the webinar conversation with Information Security Media Group, open-source visibility is necessary, but it is not sufficient. Modern applications are no longer just collections of third-party libraries. They are built, packaged, signed, stored, promoted, deployed, and increasingly augmented by AI systems. Each stage introduces new dependencies and new trust boundaries.
Events like Log4j made open source risk impossible to ignore. However, the evolution of the threat landscape has demonstrated that attackers are no longer limited to exploiting known vulnerabilities in libraries. They are targeting the mechanics of delivery itself—ingestion, build pipelines, artifact storage, and CI/CD automation. Organizations that stop at SCA are securing one layer of a much broader system.
Where Modern Supply Chains Actually Get Compromised
Artifact Integrity and Registry Blind Spots
Artifacts are the final outputs of the build process—container images, binaries, scripts, Helm charts, JAR files. They are what actually run in production. Yet many organizations treat artifact management as operational plumbing rather than a security control point.
The webinar highlighted how focusing exclusively on source code can obscure the reality that artifacts may be tampered with after build, altered during promotion, or stored in misconfigured registries. Visibility into open source dependencies does not automatically guarantee artifact integrity. An attacker who compromises a registry or intercepts promotion workflows can distribute malicious artifacts at scale.
The key risk lies in assuming that once an artifact is built, it is trustworthy. Without signing, provenance tracking, and gating at the registry level, artifacts become one of the most exploitable surfaces in the supply chain.
CI/CD Pipelines as Privileged Infrastructure
CI/CD systems hold credentials, secrets, deployment paths, and signing keys. They connect development directly to production. As one of the speakers noted during the discussion, pipelines should be treated as privileged infrastructure and assumed to be potential targets of compromise.
A compromised runner can publish malicious artifacts, exfiltrate secrets, or promote unauthorized builds. This is not theoretical. Attacks involving poisoned GitHub Actions and manipulated build systems demonstrate how easily the pipeline itself can become the distribution mechanism.
Security must therefore extend beyond scanning artifacts to enforcing strict governance within pipelines. This includes least privilege access, ephemeral credentials, audit trails, and Policy as Code enforcement to ensure required security checks cannot be bypassed.
Containers and Upstream Image Poisoning
Container ecosystems introduce additional risk vectors. Malicious images uploaded to public registries, typosquatting packages, and compromised upstream components can all infiltrate environments through seemingly legitimate pulls.
Organizations that implicitly trust external registries transfer vendor risk into their own infrastructure. Without upstream proxy controls, cool-off periods, or quarantine mechanisms, container ingestion becomes another blind spot.
The supply chain does not stop at internal code repositories. It extends to every external source that feeds into the build.
Vendor and Third-Party Integration Risk
Modern delivery pipelines integrate numerous third-party services. Vendors often have privileged access to environments or automated integrations into CI/CD workflows. If a vendor is compromised, that risk propagates downstream.
The webinar discussion emphasized that the supply chain must be viewed as a “trust fabric.” Pipelines, registries, and vendors are all part of that fabric. A weakness in any one node can cascade across the system.
Build Systems Are the New Trust Boundary
Build systems represent one of the most underestimated attack surfaces in modern software delivery. A source tree may pass review and scanning, yet small modifications in the build process can fundamentally alter the resulting artifact.
Examples discussed during the session included pre-install hooks, registry overrides, runtime installers, or seemingly minor shell script changes that introduce malicious behavior before artifacts are signed or scanned. These changes can bypass traditional SCA tools because the underlying source code appears clean.
This is why build integrity must be verifiable. Provenance should be recorded and tied to specific systems and identities. Build steps should be signed and attested. Promotion gates should require verification of those attestations before artifacts move forward.
Trust must be anchored in the build output, not assumed from the source input.
Why Pipelines Must Be Treated as Untrusted
CI/CD pipelines are often viewed as automation tools, but they are in fact highly privileged systems that bridge development and production. They hold secrets, manage deployment logic, and often operate with broad permissions across infrastructure.
The webinar discussion stressed that pipelines must be treated as untrusted environments by default. This does not imply mistrust of developers, but rather recognition that any high-privilege system is an attractive target.
Policy-as-code frameworks, strict RBAC, auditability, and enforcement of mandatory security checks ensure that controls cannot be disabled under pressure to ship. Developers may unintentionally bypass safeguards when under deadlines. Governance mechanisms must therefore be systemic, not optional.
In complex environments where multiple tools—GitHub Actions, Jenkins, Docker, Kubernetes—are integrated together, misconfiguration becomes another source of risk. Each tool has its own security model. Without centralized governance, complexity compounds vulnerability.
AI Is Expanding the Supply Chain Attack Surface
As if artifacts, pipelines, and containers were not enough, AI-native applications are adding an entirely new dimension to supply chain security.
Modern applications increasingly rely on Large Language Models, prompt libraries, embeddings, model weights, and training datasets. These components influence runtime behavior in ways that traditional code does not. Yet they are rarely tracked or governed with the same rigor as open-source dependencies.
The concept of an “AI Bill of Materials” is emerging, but no standardized framework currently exists. Organizations are integrating AI features faster than governance standards can keep pace.
The risks differ from traditional CVEs. Poisoned training data can subtly manipulate model behavior. Backdoored model weights can introduce hidden functionality. Prompt injection attacks can trick systems into exposing sensitive information. Shadow AI systems may be deployed without formal oversight.
Unlike deterministic software, AI systems produce probabilistic outputs. Static security testing does not fully address this unpredictability. Security teams must now consider model provenance, data lineage, vendor trust, and runtime behavior monitoring as part of the supply chain equation.
Even the build-versus-buy decision for LLMs becomes a supply chain governance choice. Building offers control but introduces operational burden and long-term responsibility. Buying accelerates deployment but increases trust dependency on external vendors. In both cases, AI components extend the trust fabric and must be governed accordingly.
A Practical Framework for End-to-End Supply Chain Security
Moving beyond SCA requires structured controls across the full lifecycle of delivery.
Ingest-Time Controls ensure that risky packages and images are prevented from entering developer workflows in the first place through dependency firewalls, upstream proxy governance, and vendor controls.
Build-Time Integrity requires signed environments, provenance attestations, and enforcement of SLSA-style compliance so that artifacts can be cryptographically tied to verified build processes.
Promotion-Time Governance introduces artifact registry gating, quarantine workflows, and policy enforcement to prevent unauthorized or tampered artifacts from advancing to production.
Runtime Verification ensures continuous monitoring of deployment health, secret usage, and, increasingly, AI behavior to detect anomalous activity after release.
This layered approach transforms supply chain security from a reactive scanning function into an operational control system embedded directly into software delivery workflows.
From Visibility to Control
Software supply chain security has evolved.
It is no longer an open-source vulnerability problem alone. It is a trust management challenge spanning artifacts, pipelines, containers, vendors, and AI components.
Organizations that succeed will not stop at generating reports. They will enforce policy at every stage. They will treat CI/CD as privileged infrastructure. They will require attestations before promotion. They will govern ingestion and monitor runtime behavior. They will extend security controls into AI-native systems.
Supply chain security must move beyond visibility. It must deliver enforceable control across the entire software delivery lifecycle. Software supply chain security isn’t about scanning more. It’s about governing every stage of software delivery from code to artifact to pipeline to production to AI.
Ready to see how Harness embeds supply chain security directly into CI/CD, artifact governance, and AI-powered verification?
Explore Harness Software Supply Chain Security solutions and secure your delivery pipeline end-to-end.
FAQs
Is SCA enough for software supply chain security?
No. SCA provides visibility into open-source vulnerabilities but does not protect CI/CD pipelines, artifact integrity, container ecosystems, or AI components.
Why are CI/CD pipelines considered high-risk?
Pipelines hold credentials, signing keys, and deployment paths. A compromised runner can inject malicious artifacts or exfiltrate secrets.
What is artifact governance?
Artifact governance includes registry gating, quarantine workflows, attestation verification, and policy enforcement before artifacts are promoted or deployed.
What is an AI Bill of Materials (AI-BOM)?
An AI-BOM would catalog AI components such as models, prompts, embeddings, and training data. Standards are still emerging.
How do supply chain attacks bypass SCA?
They exploit ingestion workflows, build steps, compromised pipelines, or malicious container images — rather than known CVEs.
Should organizations build or buy LLMs?
Build offers control but high cost and operational burden. Buy offers speed and vendor expertise but introduces trust and governance risks.
Your Repo Is a Knowledge Graph. You Just Don't Query It Yet.

Your Repo Is a Knowledge Graph. You Just Don't Query It Yet.
SCM is evolving into Source Context Management, enabling AI agents with rich, precomputed context to improve accuracy, speed, and reliability in software development.
April 1, 2026
Time to Read
Why Source Code Management must become Source Context Management in the age of AI agents
The Premise
For decades, SCM has meant one thing: Source Code Management. Git commits, branches, pull requests, and version history. The plumbing of software delivery. But as AI agents show up in every phase of the software development lifecycle, from writing a spec to shipping code to reviewing a PR, the acronym is quietly undergoing its most important transformation yet.
SCM is becoming Source Context Management.
And this isn't a rebrand. It's a rethinking of what a source repository is, what it stores, and what it serves, not just to developers, but to the agents working alongside them.
The Context Crisis in Agentic SDLC
AI agents in software development are powerful but contextually blind by default. Ask a coding agent to implement a feature and it will reach out and read files, one by one, directory by directory, until it has assembled enough context to act. Ask a code review agent to assess a PR and it will crawl through the codebase to understand what changed and why it matters.
Anthropic's 2026 Agentic Coding Trends Report documents this shift in detail: the SDLC is changing dramatically as single agents evolve into coordinated multi-agent teams operating across planning, coding, review, and deployment. The report projects the AI agents market to grow from $7.84 billion in 2025 to $52.62 billion by 2030. But as agents multiply across the lifecycle, so does their hunger for codebase context, and so does the cost of getting that context wrong.
This approach has two brutal failure modes:
- Context window bloat. Feeding raw source files to an LLM is expensive, slow, and lossy. A 300,000-line codebase doesn't fit in any context window. The agent is forced to guess what's relevant, and it often guesses wrong.
- Semantic blindness. Reading files doesn't tell an agent why code is structured the way it is, what modules depend on what, which functions are high-risk, or what the design philosophy behind a component is. Text is not meaning.
The result? Agents that hallucinate implementations because they missed a key abstraction three directories away. Code reviewers that flag style issues but miss architectural regressions. PRD generators that know the syntax of your codebase but not its soul.
The bottleneck is not the model. It is the absence of a pre-computed, semantically rich, always-available representation of the entire codebase: a context engine.
A Tale of Two Agents
Consider a simple task: "Add rate limiting to the /checkout endpoint."
Without a context engine, a coding agent opens checkout.go, reads the handler function, and writes a token-bucket rate limiter inline at the top of the handler. The code compiles. The tests pass. The PR looks clean.
The agent missed three things:
- The service already uses a middleware-based rate limiting pattern in middleware/ratelimit.go for every other endpoint. The agent created a second, inconsistent approach.
- A shared RateLimitConfig interface exists that all rate limiters must implement for centralized configuration management. The agent's inline implementation ignores it.
- Every rate-limit event flows through a centralized metrics.Emit() call for observability dashboards. The agent's version remains invisible to ops.
The code works. The team that maintains it finds it wrong in every way that matters. A senior engineer catches these issues in review, requests changes, and the cycle restarts. Multiply this by every agent-generated PR across every team, every day.
With a context engine, the same agent queries before writing code: "How is rate limiting implemented in this service?" The context engine returns:
- The existing middleware pattern in middleware/ratelimit.go
- The RateLimitConfig interface it must implement
- The metrics.Emit() integration point for observability
- The test conventions in middleware/ratelimit_test.go
The agent writes a new rate limiter that follows the established pattern, implements the shared interface, emits metrics through the standard pipeline, and includes tests that match the existing style. The PR wins approval on the first pass.
The difference is context quality, not model quality.
Beyond LSP: From Interactive Intelligence to Agentic Intelligence
The Language Server Protocol (LSP) transformed developer tooling in the past decade. By standardizing the interface between editors and language-aware backends, LSP gave every IDE, from VS Code to Neovim, access to autocomplete, go-to-definition, hover documentation, and real-time diagnostics. LSP was designed to serve a specific consumer: a human developer, working interactively, in a single file at a time. That design made the right trade-offs for its era:
- Interactive response optimization. Servers pre-compute and cache indices for low-latency, cursor-anchored queries rather than producing complete semantic snapshots of entire repositories on demand
- Position orientation. Most queries anchor to a file and cursor position, perfect for an editor but limiting for full-repo semantic traversal
- Session binding. Requires an active language server process, tightly coupled to an open editor session
- Single-client design. The protocol assumes one client per server instance, not built for concurrent multi-agent access
For interactive development, these are strengths. LSP excels at what it was built to do.
Agents are a different class of consumer. They don't sit in a file waiting for cursor events. They operate across entire repositories, across SDLC phases, often in parallel. They need the full semantic picture before they start, not incrementally as they navigate.
Agents need not a replacement for LSP, but a complement: something pre-built, always available, queryable at repo scale, and semantically complete, ready before anyone opens a file.
Enter LST: The Foundation of Source Context Management
Lossless Semantic Trees (LST), pioneered by the OpenRewrite project (born at Netflix, commercialized by Moderne), take a different approach to code representation.
Unlike the traditional Abstract Syntax Tree (AST), an LST:
- Preserves formatting. Whitespace, comments, style decisions are retained, enabling round-trip code transformation without destructive rewrites
- Is fully type-attributed. Every node in the tree knows the full type of every symbol, including fields defined in external binary dependencies
- Is pre-computed and cacheable. LSTs are generated once, stored, and queried repeatedly without needing a live language server
- Scales to entire repositories. Moderne's platform has demonstrated querying and transforming hundreds of millions of lines of code in seconds using pre-stored LSTs
This is the first layer of a Source Context Management system. Not raw files. Not a running language server. A pre-indexed semantic tree of the entire codebase, queryable by agents at any time.
The Three-Layer Architecture of a Context Engine
A proper Source Context Management system is not a single component. It is a three-layer stack that turns a repository from a file store into something agents can actually reason over.
Layer 1: Semantic Indexing (LST + Embeddings)
Every file in the repository is parsed into an LST and simultaneously embedded into a vector representation. This creates two complementary indices:
- Structural index (LST): knows types, dependencies, call hierarchies, inheritance chains
- Semantic index (vectors): knows meaning, intent, similar patterns, conceptual proximity
Layer 2: Code Graph
The LST and semantic indices are projected into a code knowledge graph, a property graph where nodes are functions, classes, modules, interfaces, and comments, and edges are relationships: calls, imports, inherits, implements, modifies, tests.
This graph enables queries like:
- "What is the blast radius if I change this interface?"
- "Which modules have never been touched by the team that owns this service?"
- "What are all the callers of this deprecated function across microservices?"
- "Which code paths are covered by zero tests?"
Layer 3: Agentic Integration (MCP / API)
The context engine exposes itself through a Model Context Protocol (MCP) server or REST API, so any agent (whether a coding agent, a review agent, a risk assessment agent, or a documentation agent) can query the context engine directly, retrieving precisely the subgraph or semantic chunk it needs, without ever touching the raw file system.
The key insight: agents never read files. They query the context engine.
One Context Engine, Entire SDLC
A single context engine can serve every phase of the software development lifecycle.
Product Requirements (PRD Generation)
A PRD agent queries the context engine to understand existing capabilities, technical constraints, and module boundaries before generating a requirements document. It produces specs grounded in what the system actually is, not what someone thinks it is.
Technical Specification
A spec agent traverses the code graph to identify affected components, surface similar prior implementations, flag integration points, and propose an architecture, all without reading a single file directly.
Implementation (Coding)
A coding agent retrieves the precise subgraph surrounding the feature area: the types it needs to implement, the interfaces it must satisfy, the patterns used in adjacent modules, the test conventions for this package. It writes code that fits the codebase, not just code that compiles.
Pull Request & Code Review
A review agent queries the context engine to understand the semantic diff, not just what lines changed, but what that change means for the rest of the system. It can immediately surface:
- Functions that are now unreachable
- Breaking changes to downstream consumers
- Regressions in design patterns
- Missing test coverage for the changed blast radius
Risk Assessment
A risk agent scores every PR against the code graph, identifying high-centrality nodes (code that many things depend on), historically buggy modules, and changes that cross team ownership boundaries. No DORA metrics spreadsheet required.
Documentation & Design Principles
A documentation agent can traverse the code graph to generate living documentation (architecture diagrams, module dependency maps, API contracts) that updates automatically as the codebase evolves. Design principles can be encoded as graph constraints and validated on every merge.
Incident Response
When a production incident occurs, an on-call agent queries the context engine with the failing component and gets an immediate blast-radius map, the last 10 changes to that subgraph, the owners, and the test coverage status. Time-to-understanding drops from hours to seconds.
The Business Imperative
The business case is simple:
- Developer productivity. Agents with accurate context write correct code on the first pass. Fewer review cycles, fewer reverted commits, fewer rollbacks.
- Delivery velocity. Pre-computed context means agents don't spend half their time reading the codebase. Tasks that take minutes of agent compute today can take seconds.
- Risk reduction. A code graph makes the blast radius of every change visible before it merges. Risk moves left, from production incidents to pre-merge awareness.
- Institutional memory. The context engine captures why code is structured the way it is, not just what it does. New engineers (and new agents) onboard against the graph, not against tribal knowledge.
The Open Source Ecosystem Is Already Here
This is not a theoretical architecture. Tools exist today:
- OpenRewrite / Moderne. LST generation and large-scale codebase transformation
- tree-sitter. Universal parser for building ASTs across 150+ languages
- CodeRAG. Graph-based code analysis for AI-assisted development
- ArangoDB / FalkorDB / Neo4j / Memgraph. Graph databases well-suited for code relationship storage
- Chroma / Qdrant / Milvus. Vector databases for semantic code embeddings
- MCP (Model Context Protocol). Anthropic's open protocol for agent-to-tool communication
- Context-aware code review engines. Platforms that leverage semantic code understanding to power AI-assisted review beyond surface-level linting
The missing piece is not any individual component. It is the platform that assembles them into a unified, repo-attached context engine that every agent in the SDLC can query through a single interface.
The Challenges to Solve
Source Context Management faces real engineering challenges:
- Security and access control. A context engine is a pre-analyzed, queryable understanding of the codebase: dependency chains, blast-radius maps, test coverage gaps, ownership boundaries. In the wrong hands, this becomes a penetration testing roadmap. Agents querying the context engine must respect the same repo-level permissions that developers have, enforced at the graph query level, not just the API boundary. Context leakage across team or tenant boundaries is the single highest-severity threat vector this architecture introduces. Any serious deployment must treat threat modeling as a first-class architectural concern. Anthropic's 2026 Agentic Coding Trends Report makes the same call, listing "security-first architecture" as one of eight defining trends for agentic coding.
- Polyglot repos. Most enterprise codebases span multiple languages. The context engine must support unified graph construction across Java, Python, TypeScript, Go, and more simultaneously.
- Index freshness. The context engine must update incrementally on every commit, much like Git's own index, which uses content-addressable hashing and stat caching to detect exactly what changed without re-reading every file. A context engine that rebuilds from scratch on every push will not scale; one that recomputes only the affected subgraph on each commit will. A stale graph is worse than no graph, because it gives agents false confidence.
- Graph scale. A 10-million-line monorepo produces a graph with hundreds of millions of edges. Query performance at this scale requires dedicated graph infrastructure.
- Evaluation. How do you measure whether an agent's output improved because the context engine was accurate? Building evals for context quality is an unsolved problem.
The Reframe: What Is a Repository?
This is the shift:
A repository is not a collection of files. A repository is a knowledge graph with a version history attached.
Git's job is to version that knowledge. The context engine's job is to make it queryable. The agent's job is to act on it.
Follow this model and the consequences are concrete. Every CI/CD pipeline should include a context engine update step, as natural as running tests. Every developer platform should expose a context engine API alongside its code hosting API. Every AI coding tool should be evaluated not just on model quality but on context engine quality.
Source code repositories that don't invest in their context layer will produce agents that are fast but wrong. Repositories with rich, well-maintained context engines will produce agents that feel like senior engineers, because they have the same depth of understanding of the codebase that a senior engineer carries in their head.
Conclusion: The Next Infrastructure Primitive
The LSP gave us IDE intelligence. Git gave us version control. Docker gave us portable environments. Kubernetes gave us cluster orchestration. Each of these was an infrastructure primitive that unlocked a new generation of developer tooling.
The Source Context Engine is the next infrastructure primitive.
It is the prerequisite for every agentic SDLC capability worth building. And like every infrastructure primitive before it, the teams and platforms that build it first will be hard to catch.
SCM is no longer just about managing source code. It's about managing the context that makes the source code understandable.
Terraform Vendor Lock-In: How to Escape It

Terraform Vendor Lock-In: How to Escape It
Terraform vendor lock-in is real. Learn how OpenTofu and Harness IaCM help you escape it and manage multi-IaC environments. Explore now.
March 31, 2026
Time to Read
Did ecTerraform vendor lock-in just become your biggest operational risk without you noticing? When HashiCorp changed Terraform's license from MPL to BSL in August 2023, legal terms were not the only alteration. They fundamentally shifted the operational landscape for thousands of platform teams who built their infrastructure automation around what they believed was an open, community-driven tool. If your organization runs Terraform at scale, you're now facing a strategic decision that wasn't on your roadmap six months ago.
The uncomfortable truth is that most teams didn't architect for IaC portability. Why would they? Terraform was open source. It was the standard. And now, many organizations find themselves in a position they swore they'd never be in again after the Kubernetes wars: locked into a single vendor's roadmap, pricing model, and strategic priorities.
This isn't theoretical; it’s the very serious reality platform engineers are dealing with right now!
Why Terraform Lock-In Became Real Overnight
Terraform lock-in wasn't always a concern. For years, Terraform represented the opposite of vendor lock-in. It was open source, cloud-agnostic, and community-driven. Teams built entire operational models around it. They trained engineers, standardized on HCL, built module libraries, and integrated Terraform deeply into CI/CD pipelines. You’ve got to hand it to them; these aspects were very desirable.
Then HashiCorp moved to the Business Source License. Suddenly, the "open" in "open source" came with conditions. The BSL restricts certain commercial uses, and while many organizations technically fall outside those restrictions, the change introduced uncertainty.
- Could HashiCorp tighten the license further?
- Would future versions include features only available under commercial terms?
- What happens when your infrastructure automation depends on a tool whose strategic direction you no longer control?
The deeper problem is architectural. Most teams didn't design for IaC engine portability because they didn't need to. Terraform state files, provider interfaces, and workflow patterns became embedded assumptions. Module libraries assumed Terraform syntax. Pipelines called `terraform plan` and `terraform apply` directly. When every workflow is tightly coupled to a single tool's CLI and API, switching becomes expensive.
This is classic vendor lock-in, even if it happened gradually and without malice.
The Hidden Costs of Staying Locked In
The immediate cost of Terraform lock-in isn't the license itself, but rather related to what you can't do when you're locked in.
- You can't experiment with alternative IaC engines without rewriting modules.
- You can't adopt tools that might better suit specific use cases.
- You can't negotiate from a position of strength because your entire infrastructure automation stack depends on one vendor's roadmap.
If HashiCorp decides to sunset features, deprecate APIs, or introduce breaking changes, you either adapt or do without; stuck on an outdated version with mounting technical debt.
The operational risk compounds over time. When you're locked into a single IaC tool, you're also locked into its limitations. If drift detection isn't native, you build workarounds. If policy enforcement is bolted on, you maintain custom integrations. If the state backend causes performance issues at scale, you optimize around the bottleneck rather than solving the root problem.
And then there's the talent risk. If your team only knows Terraform, and the industry shifts toward other IaC paradigms, you're either retraining everyone or competing for a shrinking talent pool. Monocultures are fragile.
How to Escape Terraform Lock-In Without Rewriting Everything
The good news is that escaping Terraform lock-in doesn't require a full rewrite. It requires a deliberate strategy to introduce portability into your IaC architecture.
Start with OpenTofu as Your Baseline
OpenTofu emerged as the open-source fork of Terraform immediately after the license change. It's MPL-licensed, community-governed through the Linux Foundation, and API-compatible with Terraform 1.5.x. For most teams, OpenTofu migration is the lowest-friction path to regaining control over your IaC engine.
Migrating to OpenTofu doesn't mean abandoning your existing Terraform workflows. Because OpenTofu maintains compatibility with Terraform's core primitives, you can run OpenTofu side-by-side with Terraform during a transition. This lets you validate behavior, test edge cases, and build confidence before committing fully.
The strategic advantage of OpenTofu is not just licensing, optionality. Once you're no longer tied to HashiCorp's roadmap, you can evaluate IaC engines based on technical merit rather than sunk cost.
Decouple Your Workflows from Engine-Specific Assumptions
The harder part of escaping IaC vendor lock-in is decoupling your operational workflows from Terraform-specific patterns. This means abstracting your pipelines so they don't hardcode `terraform plan` and `terraform apply`. It means designing module interfaces that could theoretically support multiple engines. It means treating the IaC engine as an implementation detail rather than the foundation of your architecture.
This is where infrastructure as code portability becomes a design principle. If your pipelines call a generic "plan" and "apply" interface, switching engines becomes a simple configuration change, not a migration project.
Adopt Multi-IaC Tool Management from the Start
The reality is that most large organizations will eventually run multiple IaC tools. Some teams will use OpenTofu. Others will stick with Terraform for compatibility with existing state. New projects might adopt Terragrunt for DRY configurations or Pulumi for type-safe infrastructure definitions.
Fighting this diversity creates friction. Embracing it requires tooling that supports multi-IaC environments without forcing everyone into a lowest-common-denominator workflow. You need a platform that treats OpenTofu, Terraform, and other engines as first-class citizens, not as competing standards.
How Harness IaCM Enables Vendor-Neutral Infrastructure Management
Harness Infrastructure as Code Management was built to solve the multi-IaC problem that most teams are only now realizing they have. It doesn't force you to pick a single engine. It doesn't assume Terraform is the default. It treats OpenTofu and Terraform as equally supported engines, with workflows that abstract away engine-specific details while preserving the flexibility to use either.
This matters because escaping Terraform lock-in isn't just about switching tools. It's about building infrastructure automation that doesn't collapse the next time a vendor changes direction.
Harness IaCM supports OpenTofu and Terraform natively, which means you can run both engines in the same platform without maintaining separate toolchains. You get unified drift detection, policy enforcement, and workspace management across engines. If you're migrating from Terraform to OpenTofu, you can run both during the transition and compare results side-by-side.
The platform also supports Terragrunt, which means teams that have invested in DRY Terraform configurations don't have to throw away that work to gain vendor neutrality. You can keep your existing module structure while gaining the operational benefits of a managed IaC platform.
Beyond engine support, Harness IaCM addresses the systemic problems that make IaC vendor lock-in so painful. The built-in Module and Provider Registry means you're not dependent on third-party registries that could introduce their own lock-in. Variable Sets and Workspace Templates let you enforce consistency without hardcoding engine-specific logic into every pipeline. Default plan and apply pipelines abstract away the CLI layer, so switching engines doesn't require rewriting every workflow.
Drift detection runs continuously, which means you catch configuration drift before it becomes an incident. Policy enforcement happens at plan time, which means violations are blocked before they reach production. These aren't afterthoughts or plugins. They're native platform capabilities that work the same way regardless of which IaC engine you're using.
And because Harness IaCM is part of the broader Harness Platform, you can integrate IaC workflows with CI/CD, feature flags, and policy governance without duct-taping together disparate tools. This is the architectural model that makes multi-IaC tool management practical at scale.
Explore the Harness IaCM product or dive into the technical details in the IaCM docs.
The Path Forward: Portability as a Design Principle
Escaping Terraform lock-in is not about abandoning Terraform everywhere tomorrow. It's about regaining strategic control over your infrastructure automation. It's about designing for portability so that future licensing changes, roadmap shifts, or technical limitations don't force another painful migration.
The teams that will navigate this transition successfully are the ones that treat IaC engines as interchangeable components in a larger platform architecture. They're the ones that build workflows that abstract away engine-specific details. They're the ones that invest in tooling that supports multi-IaC environments without creating operational chaos.
If your organization is still locked into Terraform, now is the time to architect for optionality. Start by evaluating OpenTofu migration paths. Decouple your pipelines from engine-specific CLI calls. Adopt a platform that treats IaC engines as implementation details, not strategic dependencies.
Because the next time a vendor changes their license, you want to be in a position to evaluate your options, not scramble for a migration plan.
AI Ships More Code. Harness FME Helps You Release It Safely

AI Ships More Code. Harness FME Helps You Release It Safely
See how Harness FME with pipelines and policies help platform teams standardize rollouts, reduce rollback risk, and turn feature releases into a governed workflow.
March 31, 2026
Time to Read
- AI increased code velocity, but it also exposed how manual most release operations still are.
- Harness FME now fits directly into pipeline-driven workflows, so rollout, approvals, experimentation, and cleanup can follow one repeatable path.
- Recent policy integration adds governance where teams need it most: on flags, targeting rules, segments, and change requests.
- The value is platform-level because Harness connects delivery, release control, and policy enforcement in one system.
- Platform teams can move faster without creating feature flag sprawl, approval bottlenecks, or production rollout drift.
Feature flags with pipelines and policies help reduce risk
AI made writing code faster. It didn’t make releasing that code safer.
That’s the tension platform teams are dealing with right now. Development velocity is rising, but release operations still depend on too many manual decisions, too many disconnected tools, and too much tribal knowledge. Teams can deploy more often, but they still struggle to standardize how features are exposed, how approvals are handled, how risky changes are governed, and how old flags get cleaned up before they turn into debt.
That’s where the latest Harness FME integrations matter.
Harness Feature Management & Experimentation is no longer just a place to create flags and run tests. With recent pipeline integration and policy support, FME becomes part of a governed release system. That’s the bigger story.
Feature flags are valuable. But at scale, value comes from operationalizing them.
AI sped up code. It didn’t fix release operations.
The software delivery gap is getting easier to see.
In a recent Harness webinar, Lena Sano, a software developer on the Harness DevRel team and I framed the problem clearly: AI accelerates code creation, but the release system behind it often still looks manual, inconsistent, and fragile.
That perspective matters because both Lena and I sit close to the problem from different angles. I brought the platform and operating-model view. Lena showed what it actually looks like when feature release becomes pipeline-driven instead of person-driven.
The tension they described is familiar to most platform teams. When more code gets produced, more change reaches production readiness. That doesn’t automatically translate into safer releases. In fact, it usually exposes the opposite. Teams start batching more into each launch, rollout practices diverge from service to service, and approvals become a coordination tax instead of a control mechanism.
That’s why release discipline matters more in the AI era, not less.
Feature flags without pipelines don’t scale
Feature flags solve an important problem: they decouple deployment from release.
That alone is a major improvement. Teams can deploy code once, expose functionality gradually, target cohorts, run experiments, and disable a feature without redeploying the whole application.
But a flag by itself is not a release process.
I made the point directly in the webinar: feature flags are “the logical end of the pipeline process.” That line gets to the heart of the issue. When flags live outside the delivery workflow, teams get flexibility but not consistency. They can turn things on and off, but they still don’t have a standardized path for approvals, staged rollout, rollback decisions, or cleanup.
That’s where many programs stall. They adopt feature flags, but not feature operations.
The result is predictable:
- rollout patterns vary by team
- approvals happen too often or too late
- experiments live outside the release workflow
- stale flags stay in code far longer than they should
- governance turns into manual review instead of automation
This is why platform teams need more than flagging. They need a repeatable system around feature release.
Pipelines make feature release operational
The recent Harness FME pipeline integration addresses exactly that gap.
In the webinar demo, Lena showed a feature release workflow where the pipeline managed status updates, targeting changes, approvals, rollout progression, experiment review, and final cleanup. I later emphasized that “95% of it was run by a single pipeline.”
That’s not just a useful demo line. It’s the operating model platform teams have been asking for.
Standardized rollout states
The first value of pipeline integration is simple: teams get a common release language.
Instead of every service or squad improvising its own process, pipelines can define explicit rollout stages and expected transitions. A feature can move from beta to ramping to fully released in a consistent, visible way.
That sounds small, but it isn’t. Standardized states create transparency, reduce confusion during rollout, and make it easier for multiple teams to understand where a change actually is.
Approvals and evidence in one workflow
Approvals are often where release velocity goes to die.
Without pipelines, approvals happen per edit or through side channels. A release manager, product owner, or account team gets pulled in repeatedly, and the organization calls that governance.
It isn’t. It’s coordination overhead.
Harness pipelines make approvals part of the workflow itself. That means platform teams can consolidate approval logic, trigger it only when needed, and capture the decision in the same system that manages the rollout.
That matters operationally and organizationally. It reduces noise for approvers, creates auditability, and keeps release evidence close to the actual change.
Rollback paths that match the problem
One of the most useful ideas in the webinar was that rollback should depend on what actually failed.
If the problem is isolated to a feature treatment, flip the flag. If the issue lives in the deployment itself, use the pipeline rollback or redeploy path. That flexibility matters because forcing every incident through a full application rollback is both slower and more disruptive than it needs to be.
With FME integrated into pipelines, teams don’t have to choose one blunt response for every problem. They can respond with the right mechanism for the failure mode.
That’s how release systems get safer.
Cleanup built into the release lifecycle
Most organizations talk about flag debt after they’ve already created it.
The demo tackled that problem directly by making cleanup part of the release workflow. Once the winning variant was chosen and the feature was fully released, the pipeline paused for confirmation that the flag reference had been removed from code. Then targeting was disabled and the release path was completed.
That is a much stronger model than relying on someone to remember cleanup later.
Feature flags create leverage when they’re temporary control points. They create drag when they become permanent artifacts.
Policy is the missing control plane for feature management
Pipelines standardize motion. Policies standardize behavior.
That’s why the recent FME policy integration matters just as much as pipeline integration.
As organizations move from dozens of flags to hundreds or thousands, governance breaks down fast. Teams start hitting familiar failure modes: flags without owners, inconsistent naming, unsafe default treatments, production targeting mistakes, segments that expose sensitive information, and change requests that depend on people remembering the rules.
Policy support changes that.
Harness now brings Policy as Code into feature management so teams can enforce standards automatically instead of managing them with review boards and exceptions.
Governance without review-board bottlenecks
This is the core release management tradeoff most organizations get wrong.
They think the only way to increase safety is to add human checkpoints everywhere. That works for a while. Then scale arrives, and those checkpoints become the bottleneck.
Harness takes a better approach. Platform teams can define policies once using OPA and Rego, then have Harness automatically evaluate changes against those policy sets in real time.
That means developers get fast feedback without waiting for a meeting, and central teams still get enforceable guardrails.
That is what scalable governance looks like.
Guardrails for flags, targeting, segments, and change requests
The strongest part of the policy launch is that it doesn’t stop at the flag object itself.
It covers the areas where release risk actually shows up:
- Feature flags: enforce naming conventions, required ownership, tags, and metadata
- Targeting rules: block unsafe production rollouts, require safer defaults, and enforce environment-specific targeting rules
- Segments: prevent risky definitions, including segment patterns that could expose PII
- Change requests: require the right approvals and structure when sensitive rollout conditions are met
That matters because most rollout failures aren’t caused by the existence of a flag. They’re caused by how that flag is configured, targeted, or changed.
Flexible scope and inheritance across teams
Governance only works when it matches how organizations are structured.
Harness policy integration supports that with scope and inheritance across the account, organization, and project levels. Platform teams can set non-negotiable global guardrails where they need them, while still allowing business units or application teams to define more specific policies in the places that require flexibility.
That is how you avoid the two classic extremes: the wild west and the central committee.
Global standards stay global. Team-level nuance stays possible.
Why this is a platform story, not a feature story
The most important point here is not that Harness added two more capabilities.
It’s that these capabilities strengthen the same release system.
Pipelines standardize the path from deployment to rollout. FME controls release exposure, experimentation, and feature-level rollback. Policy as Code adds guardrails to how teams create and change those release controls. Put together, they form a more complete operating layer for software change.
That is the Harness platform value.
A point tool can help with feature flags. Another tool can manage pipelines. A separate policy engine can enforce standards. But when those pieces are disconnected, the organization has to do the integration work itself. Process drift creeps in between systems, and teams spend more time coordinating tools than governing change.
Harness moves that coordination into the platform.
This is the same platform logic that shows up across continuous delivery and GitOps, Feature Management & Experimentation, and modern progressive delivery strategies. The more release decisions can happen in one governed system, the less organizations have to rely on handoffs, tickets, and tribal knowledge.
A better operating model for platform teams
The webinar and the new integrations point to a clearer operating model for modern release management.
1. Deploy once, release gradually
Use CD to ship the application safely. Then use FME to expose the feature by cohort, percentage, region, or treatment.
2. Put rollout logic in the pipeline
Standardize stages, approvals, status transitions, and evidence collection so every release doesn’t invent its own operating model.
3. Enforce policy automatically
Move governance into Policy as Code. Don’t ask people to remember naming standards, metadata requirements, targeting limits, or approval conditions.
4. Preserve the right rollback options
Use the flag, the pipeline, or a redeploy path based on the actual failure mode. Don’t force every issue into one response pattern.
5. Remove flags before they become debt
Treat cleanup as a first-class release step, not a future best intention.
This is the shift platform engineering leaders should care about. The goal isn’t to add feature flags to the stack. It’s to build a governed release system that can absorb AI-era change volume without depending on heroics.
What engineering leaders should measure
If this model is working, the signal should show up in operational metrics.
Start with these:
- Change failure rate — are smaller, feature-level controls reducing risky releases?
- Mean time to recovery — can teams isolate and contain problems faster?
- Approval overhead per release — are approvals becoming more targeted and less repetitive?
- Flag lifecycle hygiene — are stale flags being removed on schedule?
- Policy violation trends — are teams catching bad patterns earlier in the workflow?
- Release consistency across teams — are rollout paths becoming more standardized?
These are the indicators that tell you whether release governance is scaling or just getting noisier.
Ready to see it in action?
AI made software creation faster, but it also exposed how weak most release systems still are.
Feature flags help. Pipelines help. Policy as code helps. But the real value shows up when those capabilities work together as one governed release model.
That’s what Harness FME now makes possible. Teams can standardize rollout paths, automate approvals where they belong, enforce policy without slowing delivery, and clean up flags before they become operational debt. That is what it means to release fearlessly on a platform, not just with a point tool.
Ready to see how Harness helps platform teams standardize feature releases with built-in governance? Contact Harness for a demo.
FAQ
Why do teams need both pipelines and feature flags?
Pipelines automate deployment and standardize release workflows. Feature flags decouple deployment from feature exposure, which gives teams granular control over rollout, experimentation, and rollback. Together, they create a safer and more repeatable release system.
What does Harness FME pipeline integration add?
It brings feature release actions into the same workflow that manages delivery. Teams can standardize status changes, targeting, approvals, rollout progression, and cleanup instead of handling those steps manually or in separate tools.
Why is policy as code important for feature management?
At scale, manual governance breaks down. Policy as code lets platform teams enforce standards automatically on flags, targeting rules, segments, and change requests so safety doesn’t depend on people remembering the rules.
What kinds of policies can teams enforce in Harness FME?
Teams can enforce naming conventions, ownership and tagging requirements, safer targeting defaults, environment-specific rollout rules, segment governance, and approval requirements for sensitive change requests.
How does this reduce release risk?
It reduces risk by combining progressive rollout controls with standardized workflows and automated governance. Teams can limit blast radius, catch unsafe changes earlier, and respond with the right rollback path when issues appear.
How does this support the broader Harness platform story?
It shows how Harness connects delivery automation, feature release control, and governance in one system. That reduces toolchain sprawl and turns release management into a platform capability rather than a collection of manual steps.
How do teams avoid feature flag debt?
They make cleanup part of the workflow. When the rollout is complete and the winning treatment is chosen, the pipeline should require confirmation that the flag has been removed from code and no longer needs active targeting.
Why Warehouse Native Experimentation Matters for Platform Teams

Why Warehouse Native Experimentation Matters for Platform Teams
Harness Warehouse Native Experimentation is now GA, helping teams run trusted experiments where data lives and release with less risk.
March 31, 2026
Time to Read
Releasing fearlessly isn't just about getting code into production safely. It's about knowing what happened after the release, trusting the answer, and acting on it without stitching together three more tools.
That is where many teams still break down.
They can deploy. They can gate features. They can even run experiments. But the moment they need trustworthy results, the workflow fragments. Event data moves into another system. Metric definitions drift from business logic. Product, engineering, and data teams start debating the numbers instead of deciding what to do next.
That's why Warehouse Native Experimentation matters.
Today, Harness is making Warehouse Native Experimentation generally available in Feature Management & Experimentation (FME). After proving the model in beta, this capability is now ready for broader production use by teams that want to run experiments directly where their data already lives.
This is an important launch on its own. It is also an important part of the broader Harness platform story.
Because “release fearlessly” is incomplete if experimentation still depends on exported datasets, shadow pipelines, and black-box analysis.
Releasing fearlessly requires more than safer deployments
The AI era changed one thing fast: the volume of change.
Teams can create, modify, and ship software faster than ever. What didn't automatically improve was the system that turns change into controlled outcomes. Release coordination, verification, experimentation, and decision-making are still too often fragmented across different tools and teams.
That's the delivery gap.
In a recent Harness webinar, Lena Sano, a Software Developer on the Harness DevRel team and I showed why this matters. Their point was straightforward: deployment alone is not enough. As I said in the webinar, feature flags are “the logical end of the pipeline process.”
That framing matters because it moves experimentation out of the “nice to have later” category and into the release system itself.
When teams deploy code with Harness Continuous Delivery, expose functionality with Harness FME, and now analyze experiment outcomes with trusted warehouse data, the release moment becomes a closed loop. You don't just ship. You learn.
Warehouse Native Experimentation is now generally available
Warehouse Native Experimentation extends Harness FME with a model that keeps experiment analysis inside the data warehouse instead of forcing teams to export data into a separate analytics stack.
That matters for three reasons.
First, it keeps teams closer to the source of truth the business already trusts.
Second, it reduces operational drag. Teams do not need to build and maintain unnecessary movement of assignment and event data just to answer basic product questions.
Third, it makes experimentation more credible across functions. Product teams, engineers, and data stakeholders can work from the same governed data foundation instead of arguing over two competing systems.
General availability makes this model ready to support production experimentation programs that need more than speed. They need trust, repeatability, and platform-level consistency.
Why the old experimentation model breaks at AI speed
Traditional experimentation workflows assume that analysis can happen somewhere downstream from release. That assumption does not hold up well anymore.
When development velocity rises, so does the volume of features to evaluate. Teams need faster feedback loops, but they also need stronger confidence in the data behind the decision. If every experiment requires moving data into another system, recreating business metrics, and validating opaque calculations, the bottleneck just shifts from deployment to analysis.
That's the wrong pattern for platform teams.
Platform teams are being asked to support higher release frequency without increasing risk. They need standardized workflows, strong governance, and fewer manual handoffs. They do not need another disconnected toolchain where experimentation introduces more uncertainty than it removes.
Warehouse Native Experimentation addresses that by bringing experimentation closer to the release process and closer to trusted business data at the same time.
What Warehouse Native Experimentation does differently
This launch matters because it changes how experimentation fits into the software delivery model.
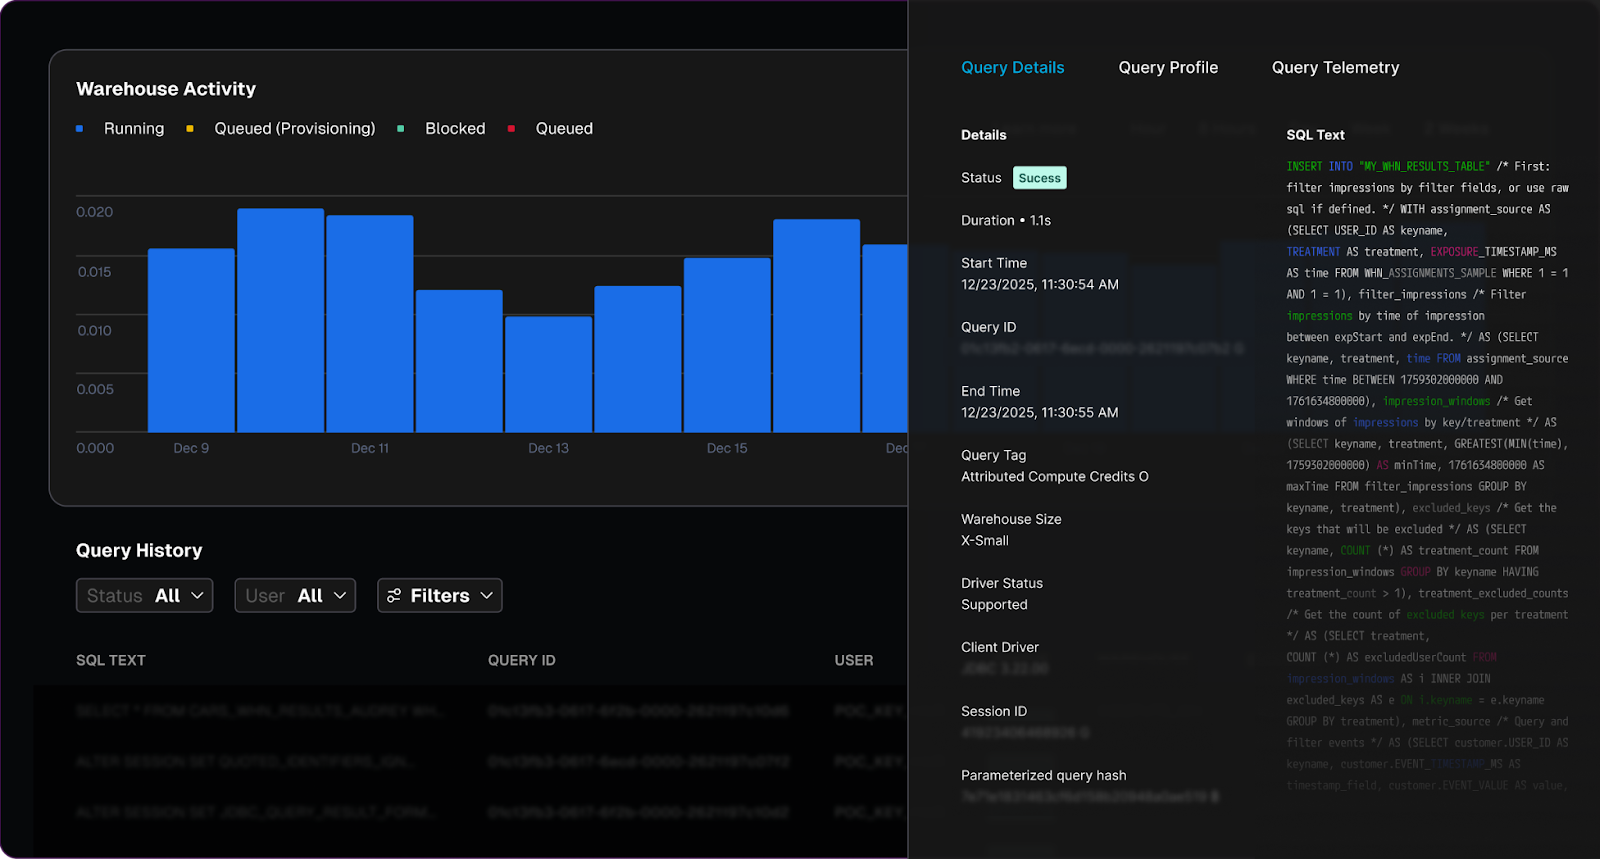

Experiment where your data lives
Warehouse Native Experimentation lets teams run analyses directly in supported data warehouses rather than exporting experiment data into an external system first.
That is a meaningful shift.
It means your experiment logic can operate where your product events, business events, and governed data models already exist. Instead of copying data out and hoping definitions stay aligned, teams can work from the warehouse as the source of truth.
For organizations already invested in platforms like Snowflake or Amazon Redshift, this reduces friction and increases confidence. It also helps avoid the shadow-data problem that shows up when experimentation becomes one more separate analytics island.
Create metrics that reflect the business
Good experimentation depends on metric quality.
Warehouse Native Experimentation lets teams define metrics from the warehouse tables they already trust. That includes product success metrics as well as guardrail metrics that help teams catch regressions before they become larger incidents.
This is a bigger capability than it may appear.
Many experimentation programs fail not because teams lack ideas, but because they cannot agree on what success actually means. When conversion, latency, revenue, or engagement are defined differently across tools, the experiment result becomes negotiable.
Harness moves that discussion in the right direction. The metric should reflect the business reality, not the reporting limitations of a separate experimentation engine.
Understand impact with transparent results
Speed matters. Trust matters more.
Warehouse Native Experimentation helps teams understand impact with results that are transparent and inspectable. That gives engineering, product, and data teams a better basis for action.
The practical benefit is simple: when a result looks surprising, teams can validate the logic instead of debating whether the tool is doing something hidden behind the scenes.
That transparency is a major part of the launch story. Release fear decreases when teams trust both the rollout controls and the data used to judge success.
Why this is a platform story, not a point feature
Warehouse Native Experimentation is valuable on its own. But its full value shows up when you look at how it fits into the Harness platform.
Pipelines standardize the release moment
In the webinar, Lena demonstrated a workflow where a pipeline controlled flag status, targeting, approvals, rollout progression, and even cleanup. I emphasized that “95% of it was run by a single pipeline.”
That is not just a demo detail. It is the operating model platform teams want.
Pipelines make releases consistent. They reduce team-to-team variation. They create auditability. They turn release behavior into a reusable system instead of a series of manual decisions.
FME controls exposure and learning
Harness FME gives teams the ability to decouple deployment from release, expose features gradually, target specific cohorts, and run experiments as part of a safer delivery motion.
That is already powerful.
It lets teams avoid full application rollback when one feature underperforms. It lets them isolate problems faster. It gives product teams a structured way to learn from real usage without treating every feature launch like an all-or-nothing event.
Warehouse-native analysis closes the loop with trusted data
Warehouse Native Experimentation completes that model.
Now the experiment does not end at exposure control. It continues into governed analysis using the data infrastructure the business already depends on. The result is a tighter loop from release to measurement to decision.
That is why this is a platform launch.
Harness is not asking teams to choose between delivery tooling and experimentation tooling and warehouse trust. The platform brings those motions together:
- Deploy the change safely with pipelines.
- Release it progressively with feature management.
- Measure it with experiments tied to trusted warehouse data.
- Standardize the workflow so teams can repeat it at scale.
That is what “release fearlessly” looks like when it extends beyond deployment.
The operating model: release, verify, learn, standardize
Engineering leaders should think about this launch as a better operating model for software change.
Release with control. Use pipelines and feature flags to separate deployment from feature exposure.
Verify with the right signals. Use guardrail metrics and rollout logic to contain risk before it spreads.
Learn from trusted data. Run experiments against the warehouse instead of recreating the truth somewhere else.
Standardize the process. Make approvals, measurement, and cleanup part of the same repeatable workflow.
This is especially important for platform teams trying to keep pace with AI-assisted development. More code generation only helps the business if the release system can safely absorb more change and turn it into measurable outcomes.
Warehouse Native Experimentation helps make that possible.
Who should care now
This feature will be especially relevant for teams that:
- already store product and business event data in a warehouse
- want to reduce the overhead of separate experimentation infrastructure
- need stronger trust and governance around experiment analysis
- are standardizing progressive delivery practices across multiple teams
- want experimentation to support release operations instead of sitting outside them
Want to see it in action?
As software teams push more change through the system, trusted experimentation can no longer sit off to the side. It has to be part of the release model itself.
Harness now gives teams a stronger path to do exactly that: deploy safely, release progressively, and measure impact where trusted data already lives. That is not just better experimentation. It is a better software delivery system.
Ready to see how Harness helps teams release fearlessly with trusted, warehouse-native experimentation? Contact Harness for a demo.
FAQ
What is Warehouse Native Experimentation?
Warehouse Native Experimentation is a capability in Harness FME that lets teams analyze experiment outcomes directly in their data warehouse. That keeps experimentation closer to governed business data and reduces the need to export data into separate analysis systems.
Why does general availability matter?
GA signals that the capability is ready for broader production adoption. For platform and product teams, that means Warehouse Native Experimentation can become part of a standardized release and experimentation workflow rather than a limited beta program.
How is warehouse-native experimentation different from traditional experimentation tools?
Traditional approaches often require moving event data into a separate system for analysis. Warehouse-native experimentation keeps analysis where the data already lives, which improves trust, reduces operational overhead, and helps align experiment metrics with business definitions.
How does this support the “release fearlessly” story?
Safer releases are not only about deployment controls. They also require trusted feedback after release. Warehouse Native Experimentation helps teams learn from production changes using governed warehouse data, making release decisions more confident and more repeatable.
How does this fit with Harness pipelines and feature flags?
Harness pipelines help standardize the release workflow, while Harness FME controls rollout and experimentation. Warehouse Native Experimentation adds trusted measurement to that same motion, closing the loop from deployment to exposure to decision.
Who benefits most from this capability?
Organizations with mature data warehouses, strong governance requirements, and a need to scale experimentation across teams will benefit most. It is especially relevant for platform teams that want experimentation to be part of a consistent software delivery model.
Regression Testing in CI/CD: Deliver Faster Without the Fear

Regression Testing in CI/CD: Deliver Faster Without the Fear
Learn how intelligent regression testing in CI/CD uses test impact analysis, flaky test detection, and automated rollbacks to ship faster without risk.
March 31, 2026
Time to Read
A financial services company ships code to production 47 times per day across 200+ microservices. Their secret isn't running fewer tests; it's running the right tests at the right time.
Modern regression testing must evolve beyond brittle test suites that break with every change. It requires intelligent test selection, process parallelization, flaky test detection, and governance that scales with your services.
Harness Continuous Integration brings these capabilities together: using machine learning to detect deployment anomalies and automatically roll back failures before they impact customers. This framework covers definitions, automation patterns, and scale strategies that turn regression testing into an operational advantage. Ready to deliver faster without fear?
What Is Regression Testing? (A Real-world Example)
Managing updates across hundreds of services makes regression testing a daily reality, not just a testing concept. Regression testing in CI/CD ensures that new code changes don’t break existing functionality as teams ship faster and more frequently. In modern microservices environments, intelligent regression testing is the difference between confident daily releases and constant production risk.
- The Simple Definition: Regression testing is the practice of re-running existing tests after code changes to ensure nothing that previously worked is unintentionally broken. Instead of validating new features, it safeguards stable functionality across your application.
- When Small Changes Create Big Problems: Even “low-risk” tweaks, like changing a payments API header, can silently break downstream jobs and critical flows like checkout. Regression tests catch these integration issues before production, protecting revenue and user experience.
- How This Fits Into Modern CI/CD: In modern CI/CD, regression tests run continuously on pull requests, main branch merges, and staged rollouts like canaries. In each case, the tests ensure the application continues to work as expected.
Regression Testing vs. Retesting
These terms often get used interchangeably, but they serve different purposes in your pipeline. Understanding the distinction helps you avoid both redundant test runs and dangerous coverage gaps.
- Retesting validates a specific fix. When a bug is found and patched, you retest that exact functionality to confirm the fix works. It's narrow and targeted.
- Regression testing protects everything else. After that fix goes in, regression tests verify the change didn't break existing functionality across dependent services.
In practice, you run them sequentially: retest the fix first, then run regression suites scoped to the affected services. For microservices environments with hundreds of interdependent services, this sequencing prevents cascade failures without creating deployment bottlenecks.
The challenge is deciding which regression tests to run. A small change to one service might affect three downstream dependencies, or even thirty. This is where governance rules help. You can set policies that automatically trigger retests on pull requests and broader regression suites at pre-production gates, scoping coverage based on change impact analysis rather than gut feel.
To summarize, Regression testing checks that existing functionality still works after a change. Retesting verifies that a specific bug fix works as intended. Both are essential, but they serve different purposes in CI/CD pipelines.
Where Regression Fits in the CI/CD Pipeline
The regression testing process works best when it matches your delivery cadence and risk tolerance. Smart timing prevents bottlenecks while catching regressions before they reach users.
- Run targeted regression subsets on every pull request to catch breaking changes within developer workflows. Keep these under 10 minutes for fast feedback.
- Execute broader suites on main branch merges using parallelization and cloud resources to compress full regression cycles from hours to minutes.
- Gate pre-production deployments with end-to-end smoke tests and contract validation before progressive rollout begins.
- Monitor live metrics during canary releases and feature experiments to detect regressions under real traffic patterns that test environments can't replicate.
- Combine synthetic monitoring with AI-powered automated rollback triggers to validate actual user impact and revert within seconds when thresholds are breached.
This layered approach balances speed with safety. Developers get immediate feedback while production deployments include comprehensive verification. Next, we'll explore why this structured approach becomes even more critical in microservices environments where a single change can cascade across dozens of services.
Why Regression Testing Matters for Microservices, Risk, and Compliance
Modern enterprises managing hundreds of microservices face three critical challenges: changes that cascade across dependent systems, regulatory requirements demanding complete audit trails, and operational pressure to maintain uptime while accelerating delivery.
Microservices Amplify Blast Radius Across Dependent Services
A single API change can break dozens of downstream services you didn't know depended on it.
- Cascade failures are the norm, not the exception. A payment schema change that seems harmless in isolation can break reconciliation jobs, notification services, and reporting pipelines across 47 dependent services. Resilience or “Chaos” testing can help you assess your exposure to cascading failures.
- Loosely coupled doesn't mean independent. NIST guidance confirms that cloud-native architectures consist of multiple components where individual changes can have system-wide impact.
- Higher deployment frequency requires higher automation. Research demonstrates that microservices require automated testing integration into CD pipelines to maintain reliability at scale.
Regulated Environments Demand Complete Audit Trails
Financial services, healthcare, and government sectors require documented proof that tests were executed and passed for every promotion.
- Compliance requires traceability. The DoD Cyber DT&E Guidebook mandates traceable test evidence for continuous authorization, noting that minor software changes can significantly impact system risk posture.
- Policy-as-code turns testing into a compliance enabler. Harness governance features enforce required test gates and generate comprehensive audit logs of every approval and pipeline execution.
- Auditors expect timestamped evidence on demand. Automated frameworks with audit logging eliminate scrambling when validation requests arrive.
Pre-Production Detection Reduces Operational Costs and MTTR
Catching regressions before deployment saves exponentially more than fixing them during peak traffic.
- The math is simple. A failed regression test costs developer time; a production incident costs customer trust, revenue, and weekend firefighting.
- Automated gates prevent breaks from reaching users. Research confirms that regression testing in pipelines stops new changes from introducing functionality failures.
- AI verification adds a final safety net. Harness detects anomalies post-deployment and triggers automated rollbacks within seconds, eliminating expensive emergency responses.
With the stakes clear, the next question is which techniques to apply.
Types of Regression Testing Techniques You'll Actually Use
Once you've established where regression testing fits in your pipeline, the next question is which techniques to apply. Modern CI/CD demands regression testing that balances thoroughness with velocity. The most effective techniques fall into three categories: selective execution, integration safety, and production validation.
Types of Regression Testing Techniques You'll Actually Use
Once you've established where regression testing fits in your pipeline, the next question is which techniques to apply. Modern CI/CD demands regression testing that balances thoroughness with velocity. The most effective techniques fall into three categories: selective execution, integration safety, and production validation—with a few pragmatic variants you’ll use day-to-day.
- Full regression suites rerun your critical end-to-end and high-value scenarios before major releases or architectural changes. They’re slower, but essential for high‑risk changes and compliance-heavy environments.
- Smoke and sanity regression focus on a small, fast set of tests that validate core flows (login, checkout, core APIs) on every commit or deployment. These suites act as your “always on” safety net.
- Unit-level regression runs targeted unit tests around recently changed modules. This is your fastest feedback loop, catching logic regressions before they ever hit cross-service integration or UI layers.
- Selective regression and test impact analysis run only the suites that exercise changed code paths, using dependency mapping to cut execution time without sacrificing confidence.
- Contract testing enforces backward compatibility through consumer-driven contracts like Pact, preventing integration failures between teams and services.
- API/UI regression testing locks in behavior at the interaction layer—REST, GraphQL, or UI flows—so refactors behind the scenes don’t break user-visible behavior.
- Performance and scalability regression ensure that latency, throughput, and resource usage don’t degrade between releases, especially for high-traffic or revenue-critical paths.
- Progressive delivery verification combines canary deployments with real-time metrics and error signals to surface regressions under actual traffic, with automated halt/rollback when thresholds are breached.
These approaches work because they target specific failure modes. Smart selection outperforms broad coverage when you need both reliability and rapid feedback.
How to Automate Regression Testing Across Your Pipeline
Managing regression testing across 200+ microservices doesn't require days of bespoke pipeline creation. Harness Continuous Integration provides the building blocks to transform testing from a coordination nightmare into an intelligent safety net that scales with your architecture.
Step 1: Generate pipelines with context-aware AI. Start by letting Harness AI build your pipelines based on industry best practices and the standards within your organization. The approach is interactive, and you can refine the pipelines with Harness as your guide. Ensure that the standard scanners are run.
Step 2: Codify golden paths with reusable templates. Create Harness pipeline templates that define when and how regression tests execute across your service ecosystem. These become standardized workflows embedding testing best practices while giving developers guided autonomy. When security policies change, update a single template and watch it propagate to all pipelines automatically.
Step 3: Enforce governance with Policy as Code. Use OPA policies in Harness to enforce minimum coverage thresholds and required approvals before production promotions. This ensures every service meets your regression standards without manual oversight.
With automation in place, the next step is avoiding the pitfalls that derail even well-designed pipelines.
Best Practices and Common Challenges (And How to Fix Them)
Regression testing breaks down when flaky tests erode trust and slow suites block every pull request. These best practices focus on governance, speed optimization, and data stability.
- Quarantine flaky tests automatically using policy enforcement and require test owners before suite re-entry. Research shows flaky tests reproduce only 17-43% of the time, making governance more effective than debugging individual failures.
- Parallelize and shard test execution across multiple agents to keep PR feedback under 5 minutes.
- Apply test impact analysis to run only tests affected by code changes, reducing unnecessary execution.
- Provision ephemeral test environments with seeded datasets to eliminate data drift between runs.
- Use contract-backed mocks for external dependencies to ensure consistent test behavior.
- Add AI-powered verification as a final backstop to catch regressions that slip past test suites.
Turn Regression Testing Into a Safety Net, Not a Speed Bump
Regression testing in CI/CD enables fast, confident delivery when it’s selective, automated, and governed by policy. Regression testing transforms from a release bottleneck into an automated protection layer when you apply the right strategies. Selective test prioritization, automated regression gates, and policy-backed governance create confidence without sacrificing speed.
The future belongs to organizations that make regression testing intelligent and seamless. When regression testing becomes part of your deployment workflow rather than an afterthought, shipping daily across hundreds of services becomes the norm.
Ready to see how context-aware AI, OPA policies, and automated test intelligence can accelerate your releases while maintaining enterprise governance? Explore Harness Continuous Integration and discover how leading teams turn regression testing into their competitive advantage.
FAQ: Practical Answers for Regression Testing in CI/CD
These practical answers address timing, strategy, and operational decisions platform engineers encounter when implementing regression testing at scale.
When should regression tests run in a CI/CD pipeline?
Run targeted regression subsets on every pull request for fast feedback. Execute broader suites on the main branch merges with parallelization. Schedule comprehensive regression testing before production deployments, then use core end-to-end tests as synthetic testing during canary rollouts to catch issues under live traffic.
How do we differentiate regression testing from retesting in practice?
Retesting validates a specific bug fix — did the payment timeout issue get resolved? Regression testing ensures that the fix doesn’t break related functionality like order processing or inventory updates. Run retests first, then targeted regression suites scoped to affected services.
How much regression coverage is enough for production?
There's no universal number. Coverage requirements depend on risk tolerance, service criticality, and regulatory context. Focus on covering critical user paths and high-risk integration points rather than chasing percentage targets. Use policy-as-code to enforce minimum thresholds where compliance requires it, and supplement test coverage with AI-powered deployment verification to catch regressions that test suites miss.
Should we run full regression suites on every commit?
No. Full regression on every commit creates bottlenecks. Use change-based test selection to run only tests affected by code modifications. Reserve comprehensive suites for nightly runs or pre-release gates. This approach maintains confidence while preserving velocity across your enterprise delivery pipelines.
What's the best way to handle flaky tests without blocking releases?
Quarantine flaky tests immediately, rather than letting them block pipelines. Tag unstable tests, move them to separate jobs, and set clear SLAs for fixes. Use failure strategies like retry logic and conditional execution to handle intermittent issues while maintaining deployment flow.
How do we maintain regression test quality at scale?
Treat test code with the same rigor as application code. That means version control, code reviews, and regular cleanup of obsolete tests. Use policy-as-code to enforce coverage thresholds across teams, and leverage pipeline templates to standardize how regression suites execute across your service portfolio.
The McKinsey Incident Is a Warning Shot for AI-Native Design

The McKinsey Incident Is a Warning Shot for AI-Native Design
An AI agent compromised McKinsey's GenAI platform, Lilli, in 2 hours via application, API, and AI-layer flaws. The incident is a warning about unified application runtime security.
March 31, 2026
Time to Read
When an offensive security AI agent can compromise one of the world’s most sophisticated consulting firms in under two hours with no credentials, guidance, or insider knowledge, it’s not just a breach but a warning sign to industry.
That’s exactly what happened when an AI agent targeted McKinsey’s Generative AI platform, Lilli. The agent chained together application flaws, API misconfigurations, and AI-layer vulnerabilities into a machine-speed attack. This wasn’t a novel zero-day exploit. It was the exploitation of familiar application security gaps and newer AI attack vectors, amplified by AI speed, autonomy, and orchestration.
Enterprises are already connecting functionality and troves of data through APIs. Increasingly, they’re wiring up applications with Generative AI and agentic workflows to accelerate their businesses. The risk of intellectual property loss and sensitive data exposure is amplified exponentially. Organizational teams must rethink their AI security strategy and likely also revisit API security in parallel.
Offensive AI Exposes the Soft Underbelly of AI Systems
Let’s be precise about what happened, avoiding the blame for McKinsey moving at a pace that much of the industry is already adopting with application and AI technology.
The offensive AI agent probing McKinsey’s AI system was quickly able to:
- Discover 200+ API endpoints via public docs.
- Identify 22 unauthenticated endpoints.
- Exploit a SQL injection flaw in an unauthenticated search API
- Enumerate a backend database via error messages.
- Escalate privileges for full access across the platform.
From there, the AI agent accessed:
- 46.5M internal chat messages with sensitive data.
- 728K files containing research and client records.
- 57K user accounts covering the entire workforce.
- 95 system prompts governing AI behaviors.
Even experienced penetration testers don’t move this fast, not without AI tools to augment their testing. Many would stumble to find the type of SQL injection flaw present, let alone all the other elements in the attack chain.
Attack Chains Span Application Layers
What makes this security incident different and intriguing is how the AI agent crossed layers of the technology stack that are now prominent in AI-native designs.
1. Application Layer
McKinsey’s search API was vulnerable to blind SQL injection. The AI agent discovered that while values were parameterized (a security best practice), it could still inject into JSON keys used as field names in the backend database and analyze the resulting error messages. Through continued probing and evaluation of these error messages, the agent mapped the query structure and extracted production data.
These are long-known weaknesses in how applications are secured. Many organizations rely on web application firewall (WAF) instances to filter and monitor web application traffic and to stop attacks such as SQL injection. However, attack methods constantly evolve. Blind SQL injection, where attackers infer information from the system without seeing direct results, is harder to detect and works by analyzing system responses to invalid queries, such as those that delay server response. These attacks can also be made to look like normal data traffic.
Security teams need monitoring capabilities that analyze application traffic over time to identify anomalous behaviors and the signals of an attack.
2. API Layer
The offensive agent quickly performed reconnaissance of McKinsey’s system to understand its API footprint and discovered that 22 API endpoints were unauthenticated, one of which served as the initial and core point of compromise.
The public API documentation served as a roadmap for the AI agent, detailing the system's structure and functionality. This presents a tricky proposition, since well-documented APIs and API schema definitions are critical to increasing adoption of productized APIs, enabling AIs to find your services, and facilitating agent orchestration.
APIs aren’t just data pipes anymore; they’re also control planes for AI systems.
APIs serve as control planes in AI-native designs, managing the configuration of model commands and access controls, and also connecting the various AI and data services. Compromising this layer enables attackers to manipulate AI configuration, control AI behavior, and exfiltrate data.
The major oversight here was the presence of 22 unauthenticated API endpoints that allowed unfettered access. This is a critical API security vulnerability, known as broken authentication.
Lack of proper authorization enabled the AI agent to manipulate unique identifiers assigned to data objects within the API calls, increase its own access permissions (escalate privileges), and retrieve other users' data. The weakness is commonly known as broken object-level authorization (BOLA), where system checks fail to restrict user or machine access to specific data. McKinsey’s AI design also allowed direct API access to backend systems, potentially exposing internal technical resources and violating zero-trust architecture (ZTA) principles. With ZTA, you must presume that the given identity and the environment are compromised, operate with least privilege, and ensure controls are in place to limit blast radius in the event of an attack. At a minimum, all identities must be continuously authenticated and authorized before accessing resources.
3. AI Layer
A breach in an AI system essentially provides centralized access to all organizational knowledge. A successful intrusion can grant control over system logic via features such as writable system prompts. This enables attackers to rewrite AI guardrails, subtly steering AI to bypass compliance policies, generate malicious code, or leak sensitive information.
New risks arise when organizations aim to improve AI system usefulness by grounding them with other sources (e.g., web searches, databases, documents, files) or using retrieval-augmented generation (RAG) pipelines that connect data sources to AI systems. This is done to tweak the prompts sent to LLMs and improve the quality of responses. However, attackers exploit these connections to corrupt the information processing or trick the AI into revealing sensitive or proprietary data.
With its elevated access, the AI agent had the ability to gain influence over:
- How the system reasons by corrupting prompts or RAG context that dictate AI logic
- What the system returns by manipulating LLM prompts and responses
- What users trust when malicious code or actions are inserted into outputs from authoritative internal tools that are used unknowingly by users or other agents.
A breach in the AI layer is not just a security incident, but a core attack on the integrity and competence of the business.
The rise of generative AI has further dissolved traditional security perimeters and created critical new attack vectors. Attackers can now target core mechanisms of institutional intelligence and reasoning, not just data.
Point Solutions Will Continue to Fail
Traditional "defense in depth" thinking segments application and AI protection into isolated layers, commonly WAFs, API gateways, API runtime security, and AI guardrails. While offering granular protection, such approaches inadvertently create a critical security blind spot: they fail to track sophisticated, multi-stage attacks that exploit handoffs between application layers.
Modern attacks are fluid campaigns. They may target frontend code as the initial attack vector, abuse APIs to attack business logic, bypass access controls enforced by gateways, pivot to database services for data exfiltration, and leverage access to manipulate reasoning of AI services.
The fatal flaw is the inability to maintain a single, unbroken chain of contextual awareness across the entire sequence. Each isolated WAF, gateway, or AI guardrail only sees a segment of the event and loses visibility once the request passes to the next layer. This failure to correlate events in real-time across APIs, applications, databases, and AI services is the blind spot that attackers exploit. By the time related signals are gathered and correlated in an organization’s SIEM, the breach has already occurred. True resilience requires a unified runtime platform to quickly identify, correlate, and respond to complex application attack chains.
Shift From Tools to Platforms
To connect signals and stop advanced attacks, organizations need correlated visibility and control across their application, API, and AI footprint. This essential capability comes from three key elements.
1. Unified Visibility & Signal Correlation
A platform must identify your application assets by combining and analyzing traffic signals from:
- Application traffic: Signals generated by user interfaces, including chatbots, web applications, and client-side code.
- API traffic: Signals generated by applications, system integrations, and agents that invoke functionality or act on data.
- AI interactions: Signals generated when user or machine identities generate prompts, receive responses, locate services through MCP, invoke tools, and find AI resources.
2. Context-Awareness
Runtime protection must go beyond simple authentication checks. It requires a deep understanding of other application context including:
- Authorization flows: Verify if a user, machine, or agent should be allowed to perform a specific action, not just if a request is authenticated.
- Data flows: Identify 1st- and 3rd-party APIs, including AI services, called by your AI applications and the data or sensitive data they pass.
3. Multi-Layer Runtime Protection
Threat detection and prevention must happen at multiple levels during runtime, which include:
- Request stitching: Detect abusive sequences and anomalous transaction flows instead of focusing solely on isolated events or rule violations.
- API requests & responses: Protect REST and GraphQL API calls and detect attacks such as BOLA and introspection.
- AI prompts & responses: Protect model interactions to preserve AI safety and prevent attacks like prompt injection or sensitive data leaks.
AI Doesn’t Break Security, It Exposes It
The incident with McKinsey's AI system didn’t introduce new vulnerabilities. It revealed something more important.
AI systems amplify every weakness across your stack, and AI excels at finding them.
Act now by reevaluating your AI security posture, unifying security monitoring, and bridging gaps that AI can exploit before attackers do.
It’s fortunate this event was essentially a research experiment and not a motivated threat actor. Attackers are already thinking in terms of AI-native designs. It’s not about endpoints or services for them; it’s about attack chains that enable them to get to your organization’s data or intelligence.
When reviewing your application security strategy, it’s not whether you have application firewalls, API protection, or AI guardrails to mitigate attacks; it’s whether they work together effectively.
The Modern Software Delivery Platform®
Loved by Developers, Trusted by Businesses
Need more info? Contact Sales