
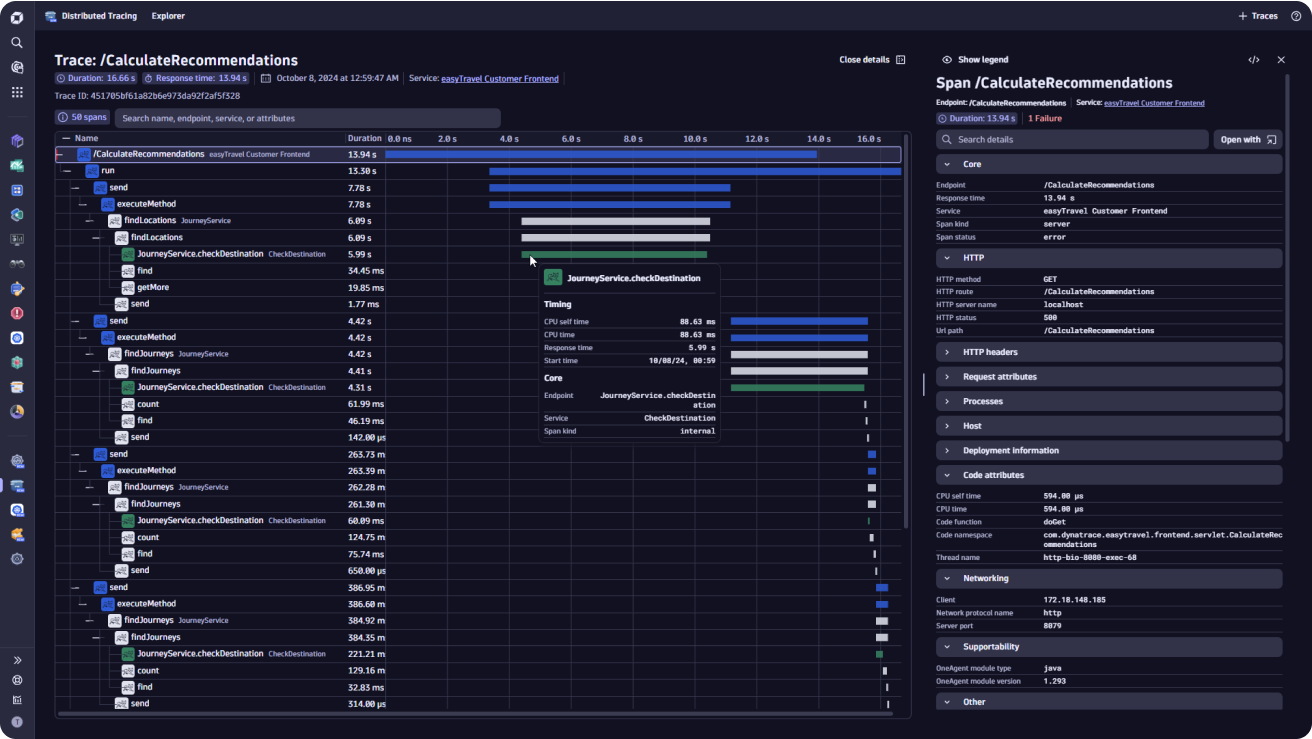
Get to the root cause faster with real-time visibility of your code wherever it's running— from Dev to Production, from bare-metal to Kubernetes.
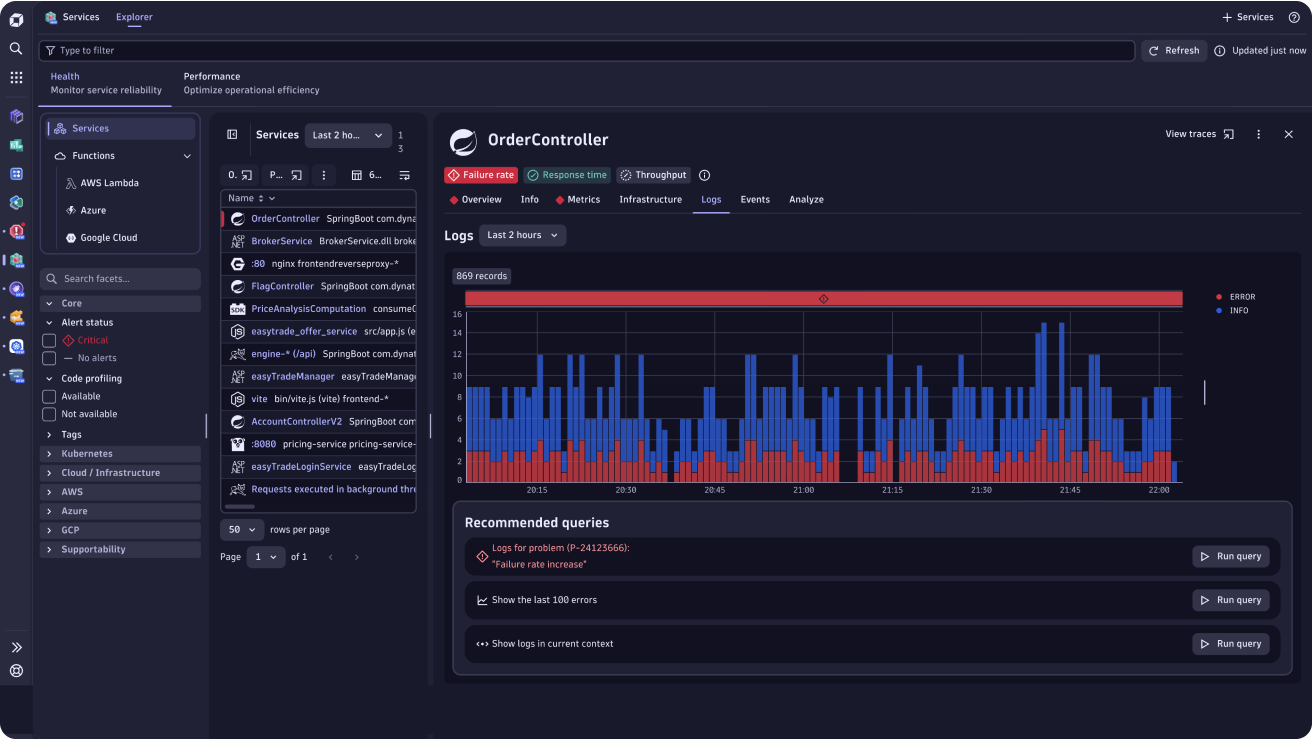
Optimize troubleshooting with the most scalable and efficient log analytics
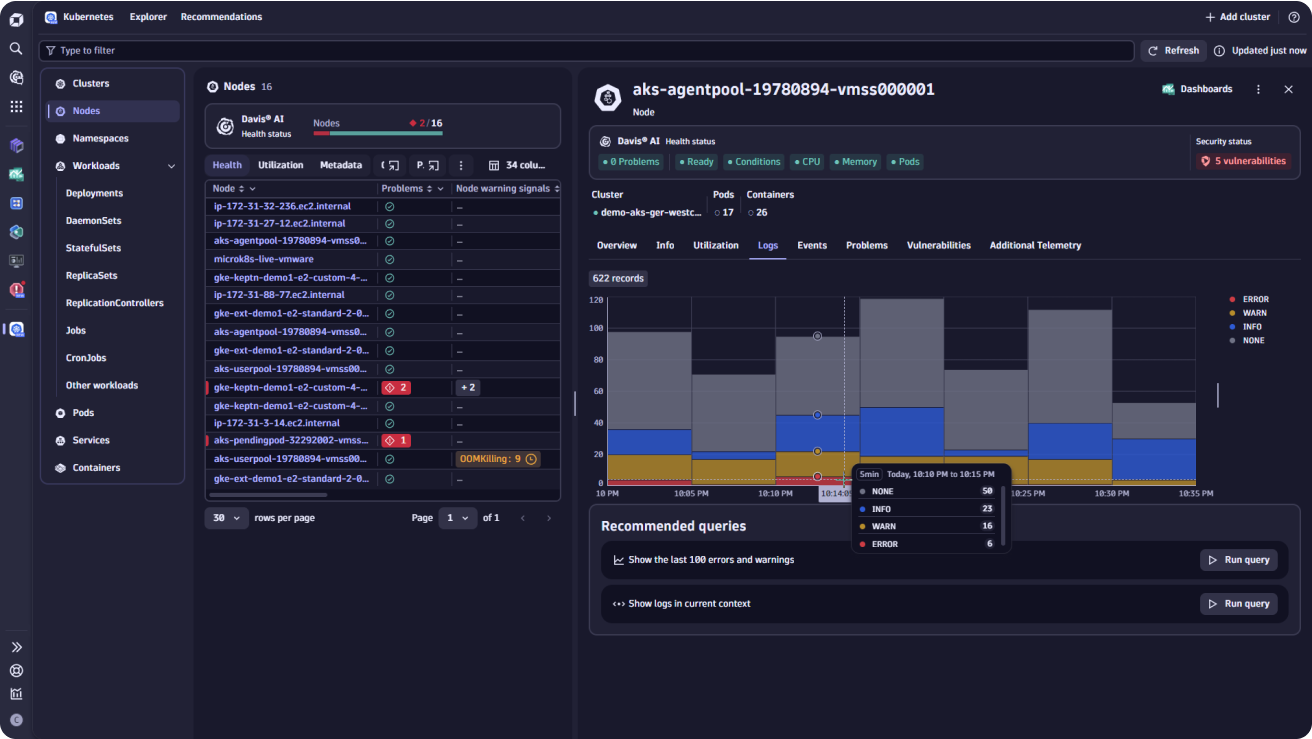
- Easily find and visualize your desired logs in the right context for your Kubernetes entities, cloud services, or hosts
- Automatically analyze logs, traces, metrics, and events with Davis Causal AI
- Granular record and field level permissions for best-in-class security and compliance Ingest, process, and analyze at any scale at a fraction of the cost
- Ingest, process, and analyze at any scale at a fraction of the cost
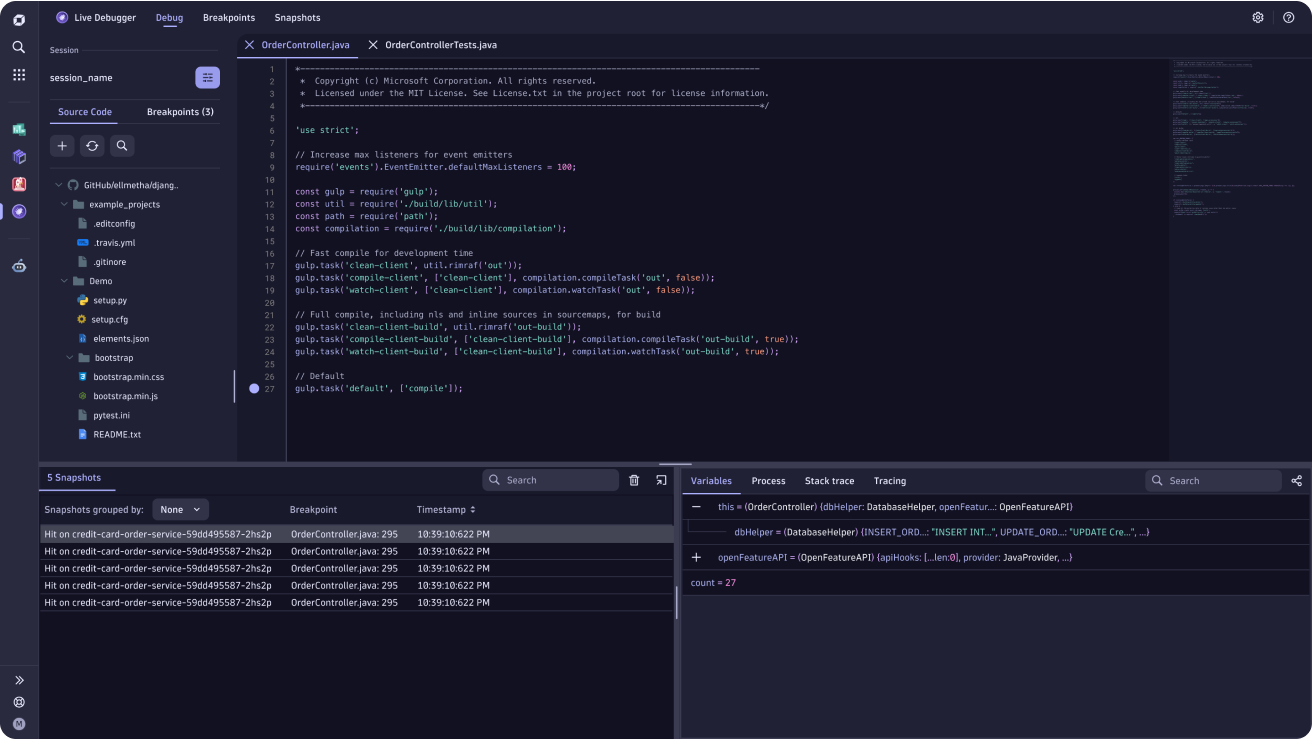
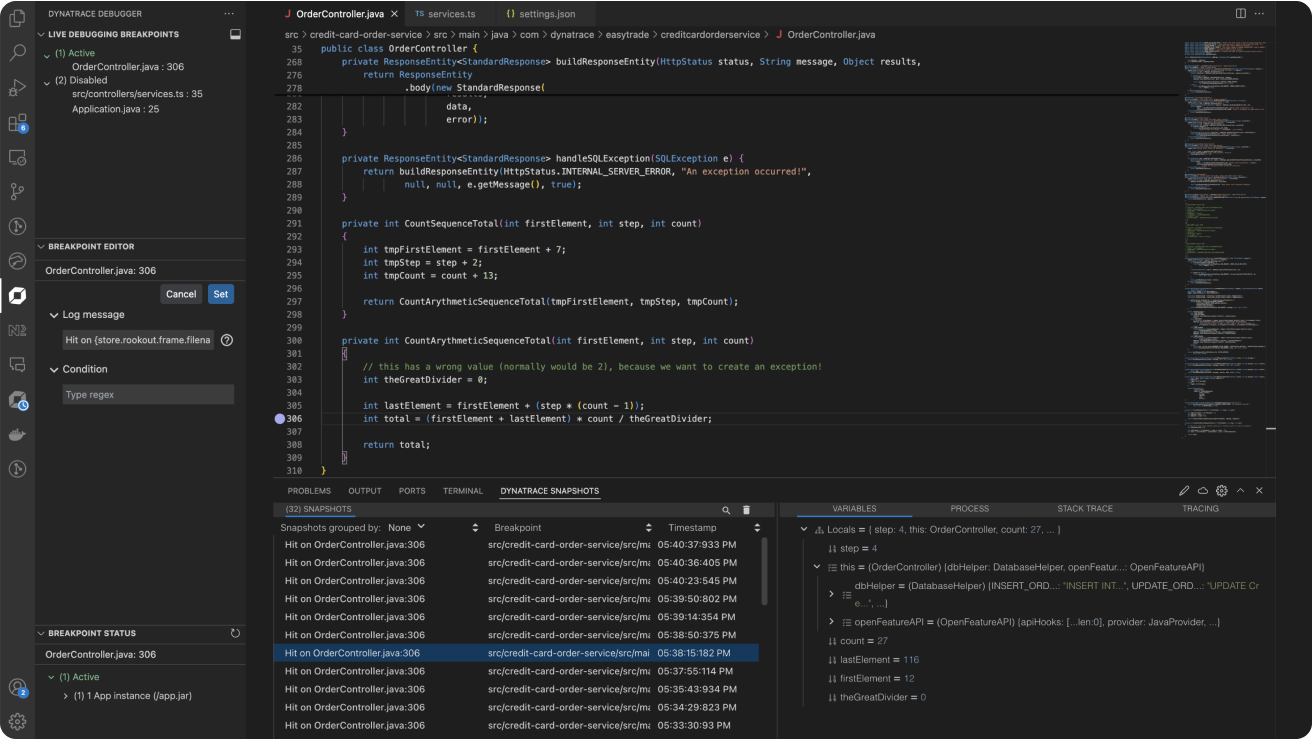
Get real-time snapshots with Live Debugger
- Instantly capture full-stack debug data from any line of code directly from both your IDE or a web-based interface
- Get runtime data and answers for your unknown unknowns in any environment, from Dev to Prod, in one click
- Easily debug your cloud-native and AI-native applications, including open source and third party
- Get a holistic view of your application with integrated snapshots, logs, and traces
Improve your workflows with intelligent and integrated full stack observability
- Zero configuration needed to observe your code, traces, services, and infrastructure powered by OneAgent
- Automatic alerts with detailed root cause analysis powered by Davis® AI
- Supercharge your OpenTelemetry data with always-on profiling, code-level insights, and Real User Monitoring
- Utilize data from high-level dashboards down to granular details
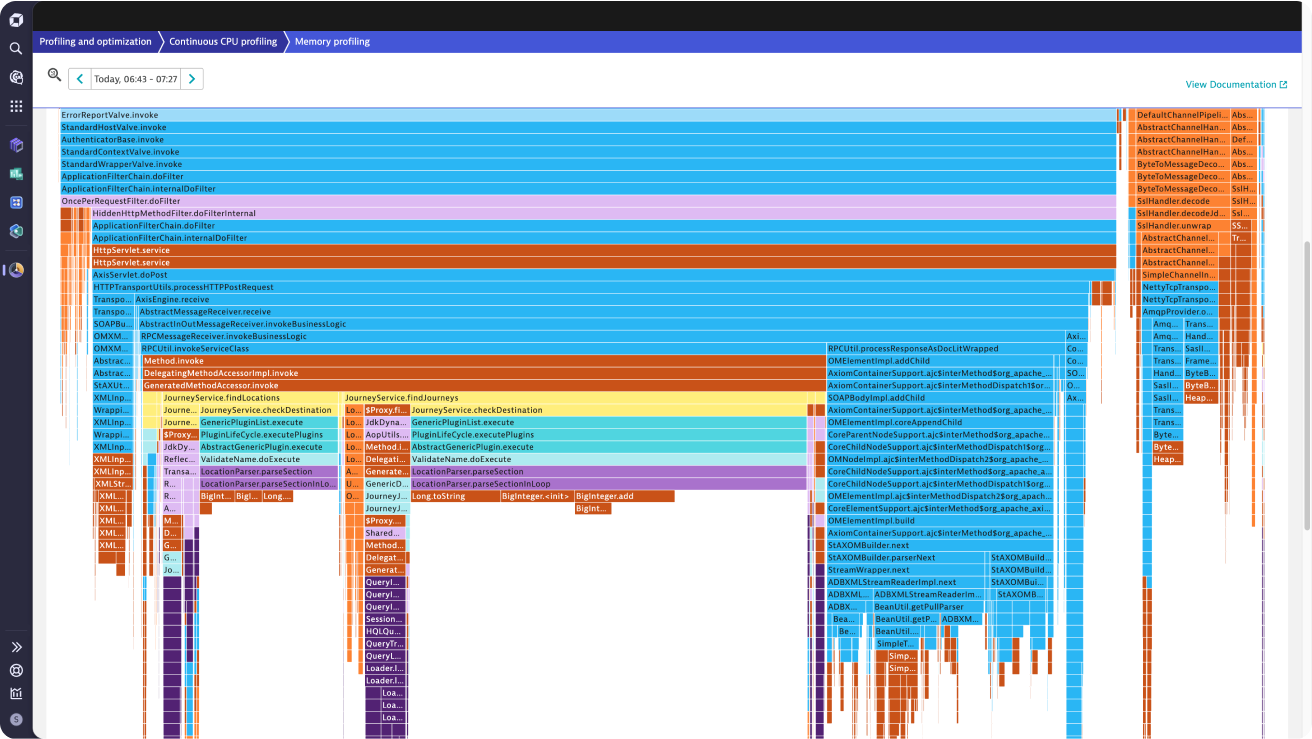
Get built-in performance analytics for production with zero configuration
- Always-on profiling directly in production and at any scale
- Granular memory allocations and continuous memory profiling
- Dynamic measuring of code execution time
- Continuous thread analysis for optimizing scalability
- Memory dumps that trigger remotely for in-depth analysis
Customize with flexibility to power any use case
- Query, process, and analyze all observability data (Traces, Logs, Metrics, and Typology) to get answers to the most complex questions
- Build intelligent automations and workflows using code or no-code
- Configure away with APIs and IaC
- Build your own applications and views on the Dynatrace platform
- Integrate with your IDE, ChatOps, issue tracking, and much more
Supercharge your AI agents and developer workflows with Dynatrace Observability
- Seamlessly connect your AI ecosystem and development tools to Dynatrace to unlock real-time, context-rich insights—right within your IDE.
- Empower your teams with live observability and security data across environments to accelerate debugging, streamline workflows, and reduce cognitive load.
- Enable smarter, faster decision-making by feeding your AI agents with enriched, actionable data—automatically correlated across logs, traces, metrics, and runtime behavior
Developer stories

Improved performance
Identify and resolve issues up to 80% faster
Better peak sales
Reduce service impacting critical incidents by 60%
Optimized experiences
Digital incidents and outage times reduced by 50%
Better outcomes
AI insights reveal how UX impacts conversions
