Announcing our new GPU profiling feature! 🚀
Do more with less.
Polar Signals Cloud is an always-on, zero-instrumentation continuous profiling for CPU, GPU, and Memory that helps improve performance, understand incidents, and lower infrastructure costs.
Trusted by
![]()
Get started in seconds
With just one command and the easiest onboarding guide you’ll ever see, you can start saving costs and optimizing performance in your infrastructure.
All it takes is a single command.
$ kubectl apply -f https://api.polarsignals.com/api/manifests.yaml?token=<your-token-here>
If you want to understand what you're applying here and what each individual Kubernetes object is for, check out the docs.
Build faster and more reliable apps with Polar Signals Cloud

Visualize and understand how your application behaves with Polar Signals Cloud's Flame Graph visualization.
Understand Incidents
Travel back in time to pinpoint incidents and issues. Profiling data provides unique insight and depth into what a process executed over time.
Optimize Performance
Utilize profiling data collected over time to confidently and statistically identify hot paths for optimization.
Save Infrastructure Costs
Many organizations have 20-30% of resources wasted with code paths that could be easily optimized.
Introducing Continuous Profiling for GPUs
Maximize GPU Efficiency: Visualize, Analyze, and Optimize with Precision.

GPUs are a significant investment, and maximizing their utilization is key to cost-effective operations.
Custom-built to handle your unique profiling needs
Polar Signals Cloud employs an exceptional blend of technologies, purpose-built to deliver the profiling toolset essential for today's evolving infrastructure and applications.
Always on Profiler
Our profiling technology is built on top of eBPF, and that means, we are continuously monitoring and collecting performance data from the system, with a very low overhead (<1%).
Zero Instrumentation
With a zero instrumentation setup, deploy immediately and reap the benefits of actionable observability data. We support languages like C, C++, Go, Ruby, Python, Java, Rust, and many more.
Difference Detection
Our difference detection feature easily detects performance regressions, optimizations, or potential issues introduced in the codebase or application over time.
Production Monitoring
Monitor production environments to detect anomalies, capture detailed profiling data, and improve performance during runtime.
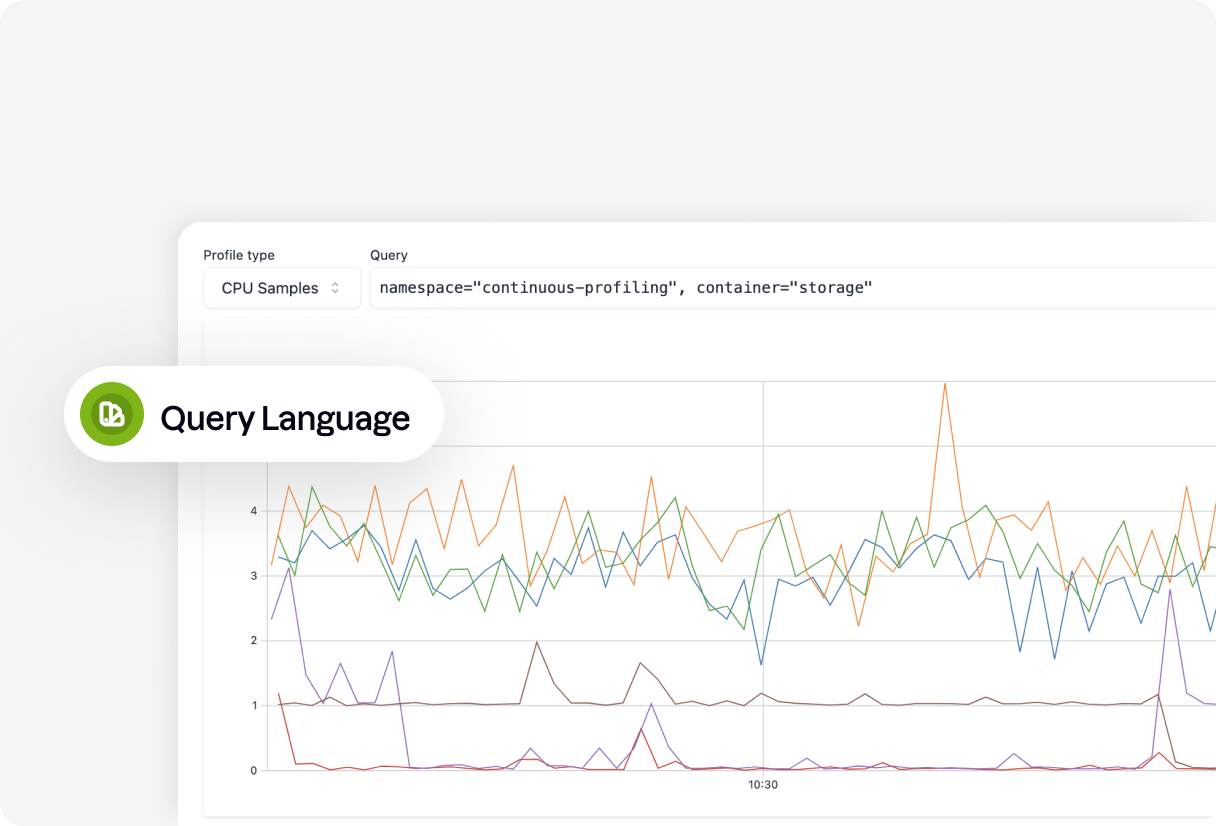
Prometheus-like Query Language
Slice-and-dice continuous profiling data using the selector-based language you already know and love from Prometheus. Add arbitrary dimensions to your data to make it reflect your organization, the tool will not force your organization to change.
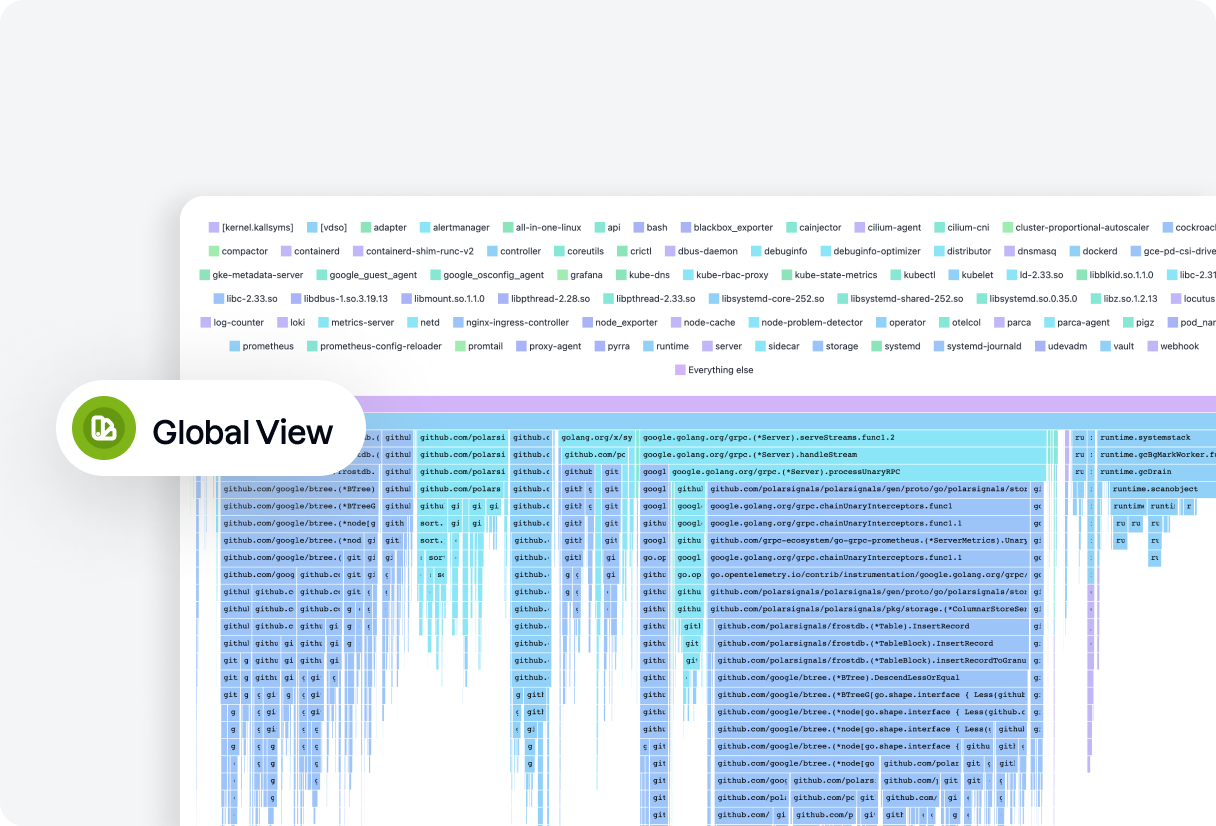
Global View
Polar Signals Cloud allows you to view all profiling data across your entire infrastructure, this enables powerful workflows that allow you to find things to optimize that actually matter and will make a difference.
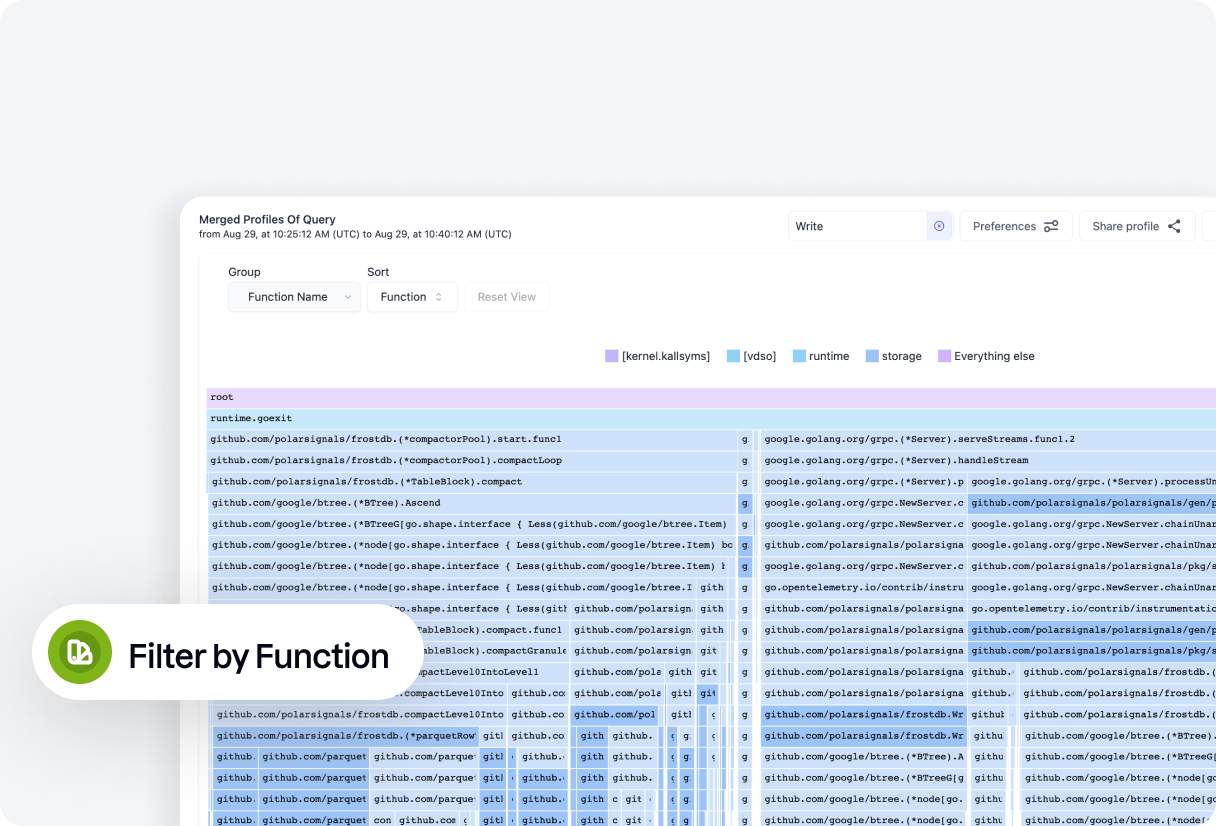
Filter by function
You already know what you want to optimize? Great! Use the filter-by-function functionality, and you have the profiling data to inform your development process available immediately. No manual profiling, or recreating of past scenarios, the data is already there!
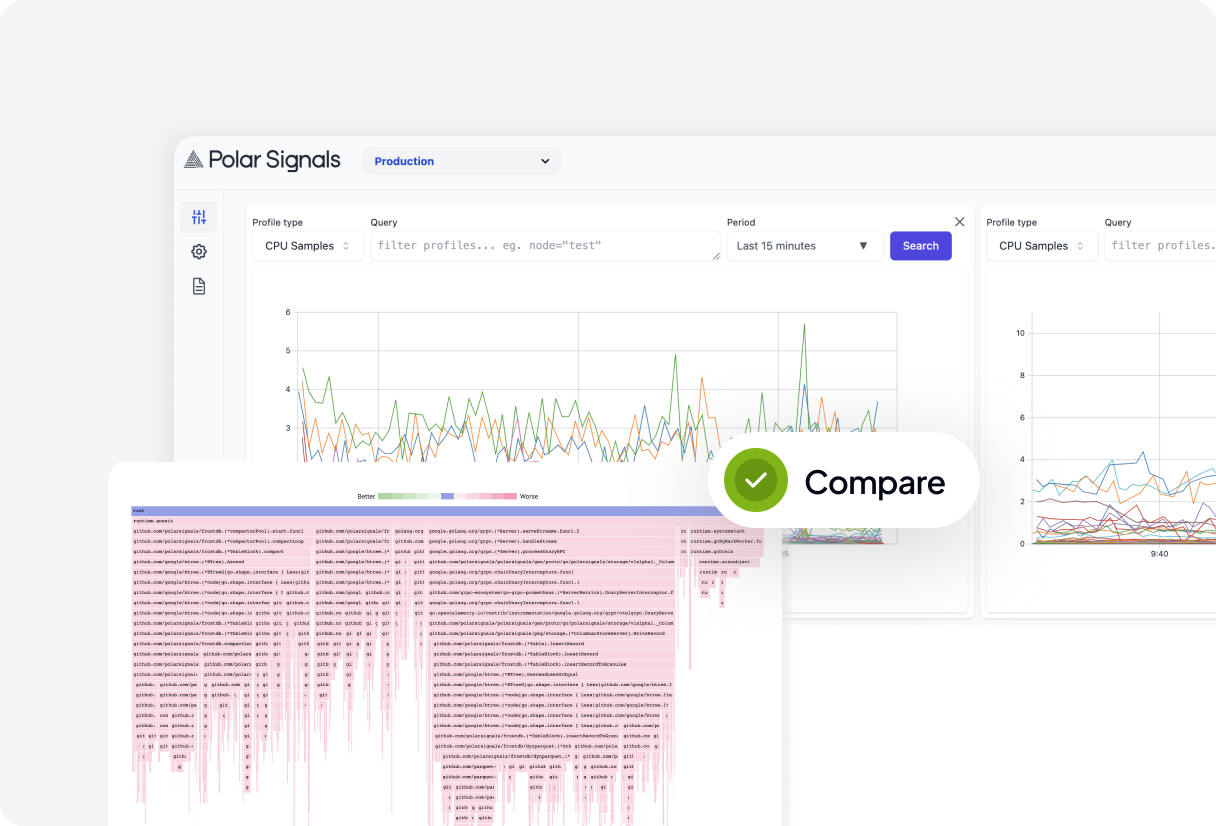
Compare
Polar Signals Cloud allows comparing the result of any two queries against each other. Compare the CPU time of version X with version Y (to understand a performance regression), compare datacenter A with datacenter B, or just understand what code was executing at one point in time of a process vs. another point in time.
Loved by engineers and companies
Harness the power of continuous profiling to uncover hidden performance issues, analyze code execution, and optimize your applications in real-time.

By making the root cause for most performance issues painfully obvious, Polar Signals Cloud lets our engineering teams skip the debate about why so they can focus on the fix.
 Dan GillespieCTO, Indent
![]()
Polar Signals Cloud has become a critical product in our software lifecycle, from informing how and where to write high-performance code in development, to understanding how it behaves in production and using it to troubleshoot performance-related incidents. Nothing else gives us detail down to the process, thread, and line number and as actionable as Polar Signals Cloud can.
 Nikhil BeneschCTO, Materialize
![]()
There's really nothing quite like the magic of Polar Signals Cloud's simplicity. A single agent to deploy, no instrumentation of application code needed and all at practically unmeasurable overhead is a dream come true. We can just focus on getting value out of continuous profiling.
Jeroen SchepensHead of Cloud Infrastructure, Oqton

Within 15 minutes of using Polar Signals we noticed an unexpectedly large (55%) CPU usage by a single workload.
 Xander GarbettSRE, Thought Machine
![]()
Polar Signals’ strategy with eBPF is the only way continuous profiling works with production workloads, anything else has too much overhead. We tried other tools and it was just performance prohibitive for us to use.
 Jimmy ZelinskieCo-Founder, Authzed
![]()
Merging samples is one of the most powerful workflows continuous profiling enables!
 Rob SkillingtonCTO, Chronosphere
![]()
Polar Signals allows us to troubleshoot and identify memory and CPU issues faster than ever before!
 Sandor SzücsPlatform Engineer, Zalando
Simple and Transparent Pricing
Our pricing is based on a usage-based model which means you only pay for the profiling data you send to us.
free trial
A 14 day trial experience to experience Polar Signals Cloud and get acquainted with how useful continuous profiling can be to your infrastructure and application.
pro
$50
per 100 million samples sent per month
A usage-based plan for teams with unlimited access to Polar Signals Cloud. Only pay for what you use with no fixed contract.
What’s included:
Unlimited collaborators
Profile Multiple Languages
Unlimited Organizations
Unlimited Projects
Discord & Slack Support
enterprise
For bigger businesses, looking for Premium Enterprise Support, custom SLA’s, or very large deployments.
All features in Pro Plan plus:
Custom Contracts
Volume Discounts
Premium Enterprise Support
Pricing Calculator
Estimate your usage when using Polar Signals Cloud. On average 1 vCPU produces
6,000,000
samples per month.
3 vCPUs18,000,000 samples/mo
$50/mo
Read more about pricing
Frequently asked questions
Does Polar Signals add any overhead to my application?
Polar Signals adds a negligible overhead to your application. The overhead is typically less than 1% and is dependent on the language and the application. The overhead is due to the collection of the profiling data. The overhead is not dependent on the amount of data sent to Polar Signals Cloud for profiling.
Which languages are supported?
Polar Signals supports Go, C++, C, Java, Node.JS, Python, Ruby, and Rust applications, with additional language support coming soon. You can find a list of all supported languages in the
Can I alert on applications getting worse?
Weekly reporting that identifies workloads that have changed significantly week over week is coming soon. In the meantime, we have
a tool that can export data to a Prometheus-compatible system from where one can alert.
How is the pricing determined?
The pricing is determined based on the amount of data sent to Polar Signals Cloud for profiling. Customers are billed according to the pricing tiers, with each tier representing 100 million samples of data.
What is the basis for calculating the monthly billing?
The monthly billing is calculated based on the total amount of data sent for profiling during the billing period. Customers are billed per 100 million samples, and the number of samples is rounded up to the nearest whole number.
Are there any additional costs or fees associated with using Polar Signals Cloud?
No, there are no additional costs or fees associated with using Polar Signals Cloud. We also do not charge per additional seats. The pricing is transparent and includes all the features and functionalities.
How far back can I query profiled data?
Currently, the data can be queried up to 30 days.
Is there a discount for high-volume data profiling?
How often is the billing cycle?
The billing cycle is monthly, and the start date is dependent on when the subscription begins. At the end of the billing cycle, we calculate the total amount of data sent for profiling and generate the corresponding invoice and charge the credit card on file. If you’d like to change the cycle date, you can reach out to
Does profiling data contain sensitive information?
No, profiling data are just statistics about source code. It may contain function names, filenames, and line numbers, but not code itself, unless users choose to explicitly upload source code for extended functionality.
Is the data in Polar Signals Cloud encrypted at rest?
Yes, the data in Polar Signals Cloud is encrypted at rest.
Get Started
Empower your development team to optimize code, save infrastructure costs, and boost application performance.