@betterdb/mcp





Give your AI assistant deep visibility into your Valkey and Redis databases. The BetterDB MCP server connects Claude Code, Cursor, Windsurf, and other MCP-compatible clients to the BetterDB monitoring platform — letting your AI query real-time metrics, diagnose slow commands, detect anomalies, and investigate incidents without leaving your editor.
See it live in BetterDB Monitor
BetterDB Monitor gives you live dashboards for the AI workloads running on your Valkey:
- AI Cache & Memory - hit rate, cost saved, evictions, and index size across all your caches and memory stores, with history.
- AI Traces - OpenTelemetry waterfalls for each request, correlated with live Valkey state to explain every cache hit and miss.
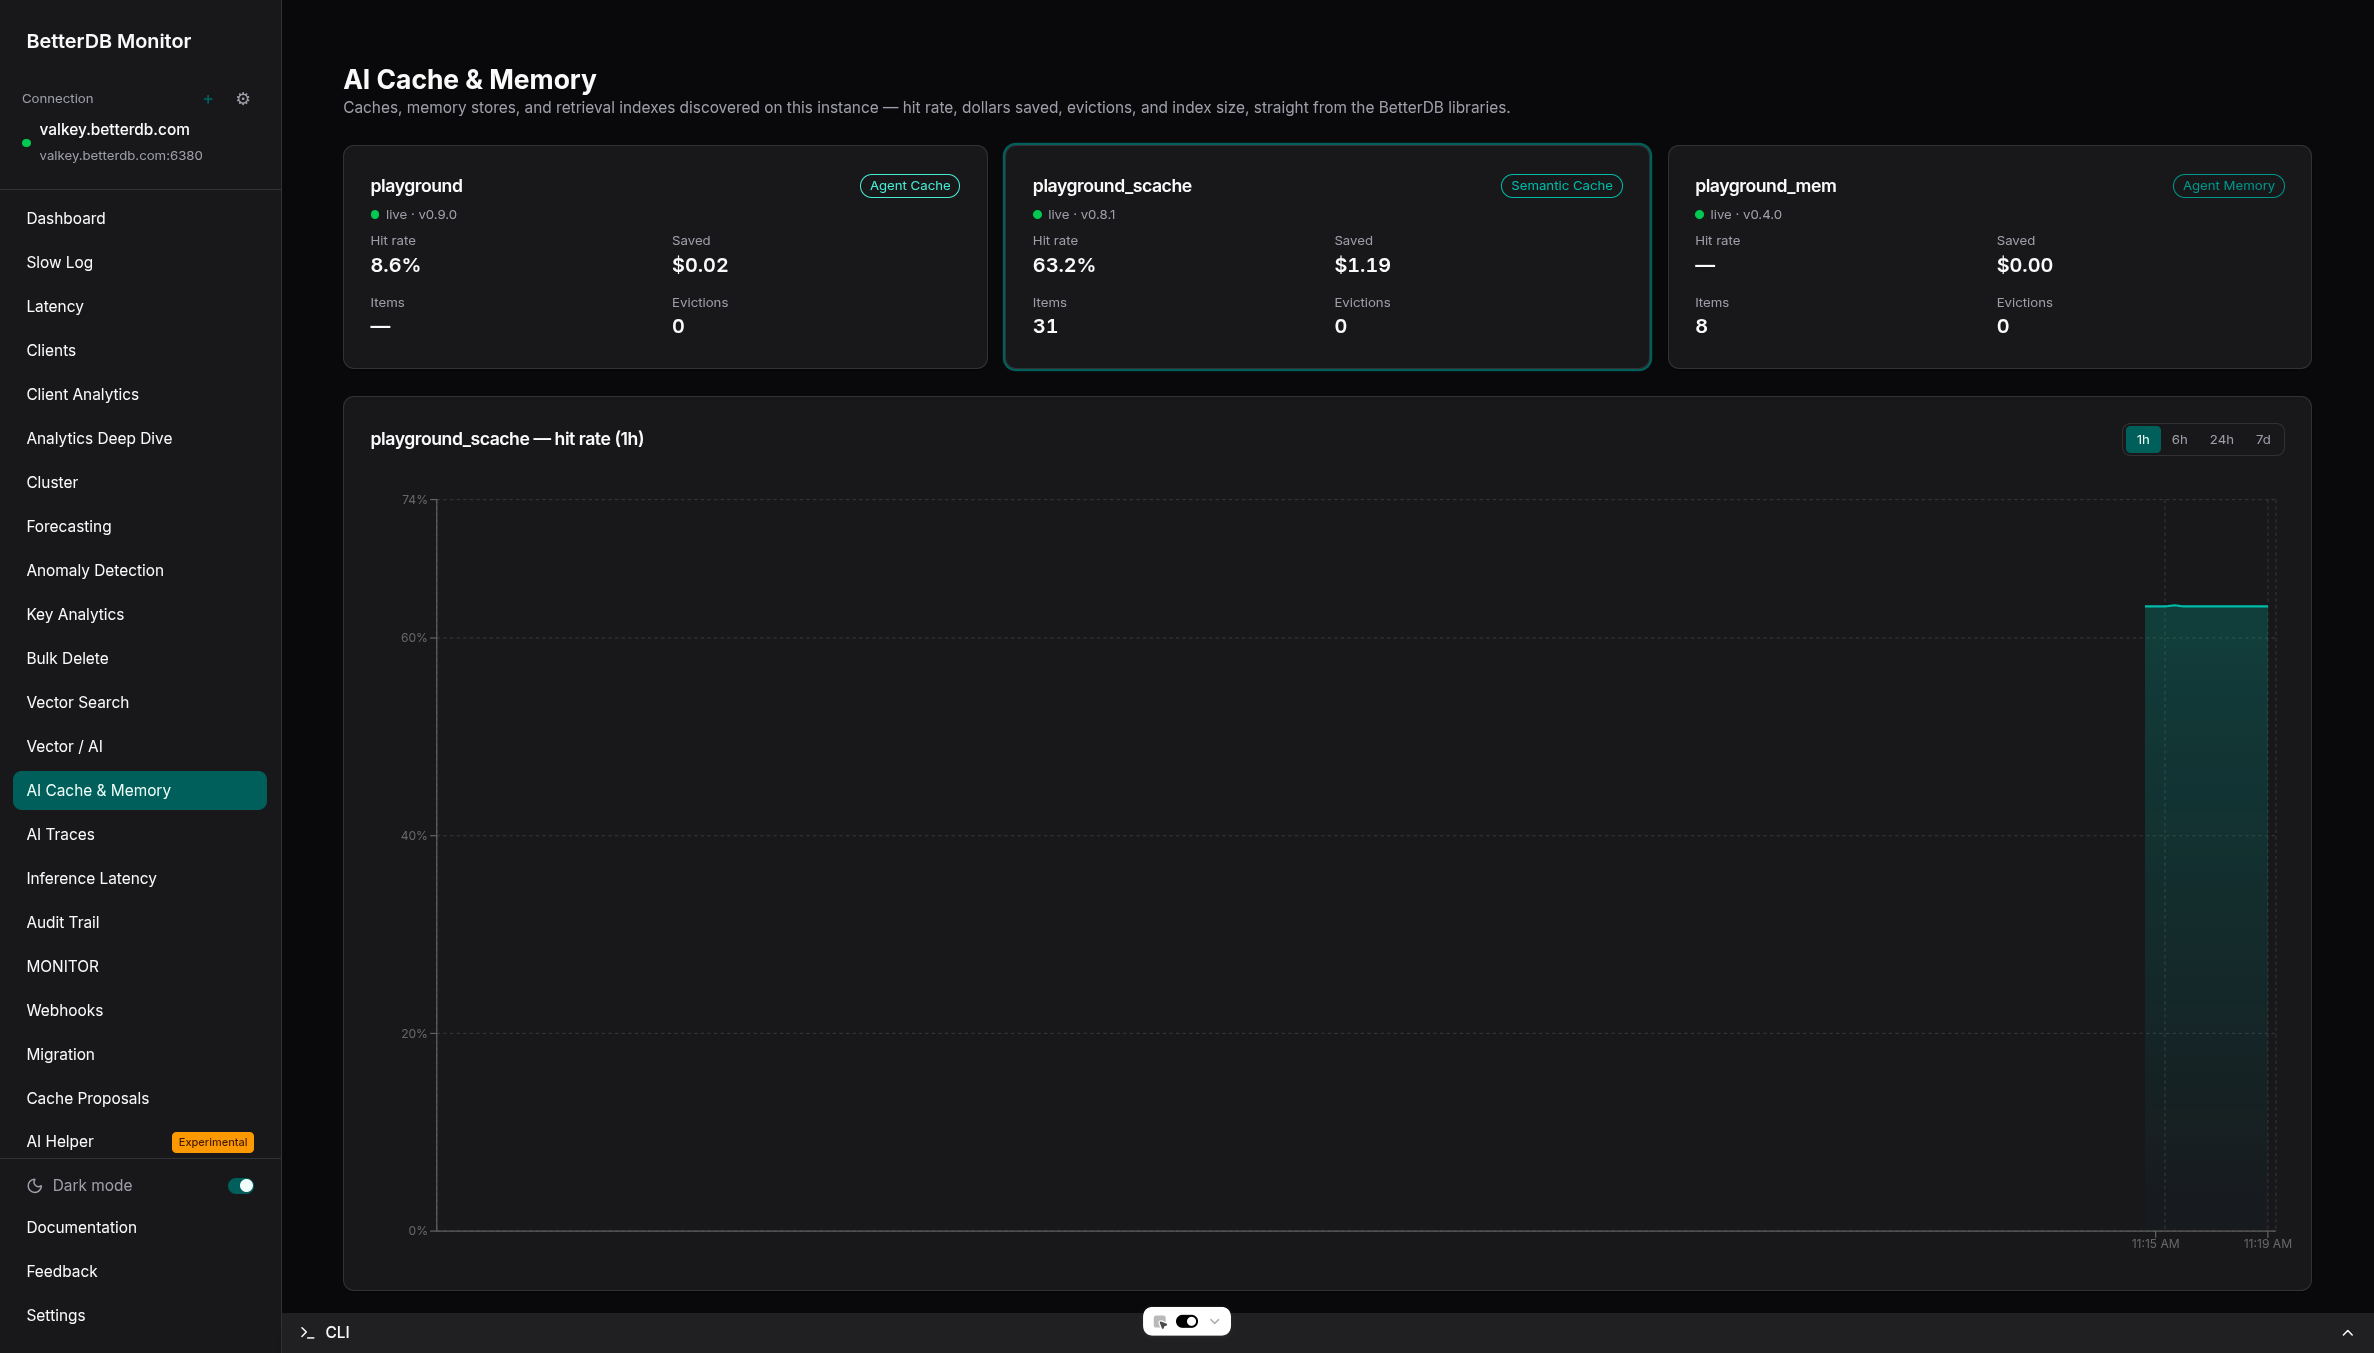
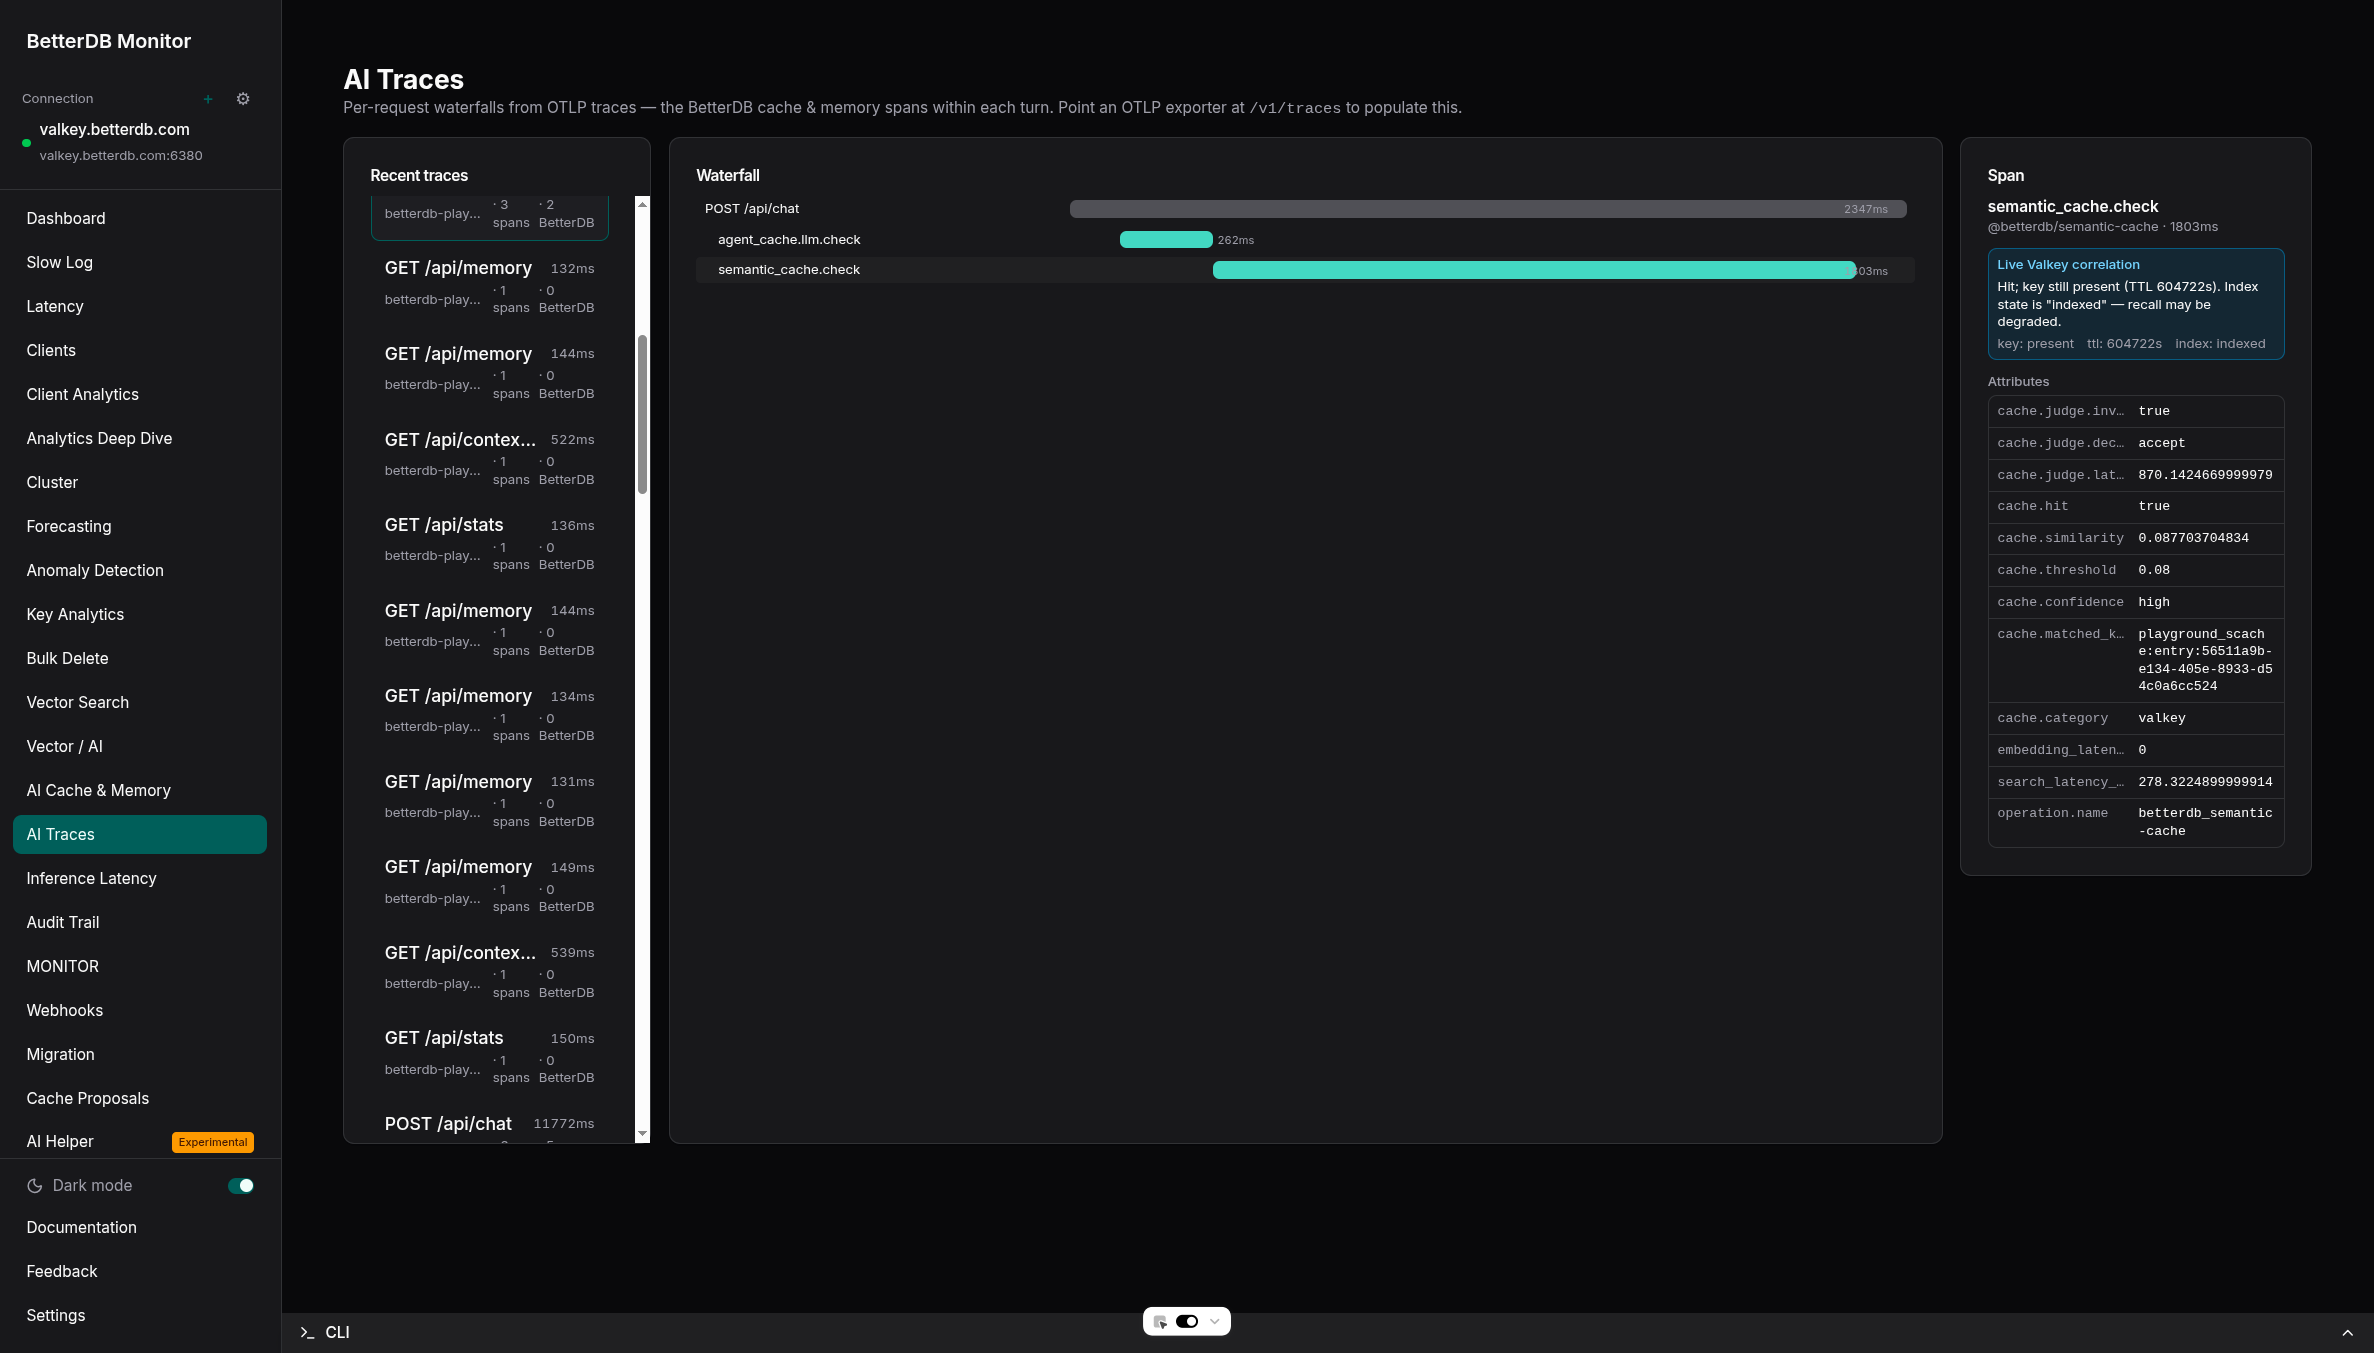
Run it self-hosted (docker run -p 3001:3001 betterdb/monitor), or use BetterDB Cloud - which can also provision a managed, TLS-enabled Valkey instance (Search module included) in one click.
Why BetterDB?
BetterDB is a monitoring and observability platform built for Valkey and Redis providing real-time dashboards, anomaly detection, and operational intelligence for your Valkey and Redis deployments. Unlike tools that only show a live snapshot, BetterDB persists historical metrics, slowlogs, and audit trails — so you can investigate what happened yesterday, not just what's happening now.
Key capabilities exposed through MCP:
- Real-time health checks — memory fragmentation, hit rate, replication lag, connected clients
- Slow command analysis — slowlog and COMMANDLOG (Valkey 8+) with pattern aggregation
- Hot key detection — find cache-busting keys via LFU frequency scores or idle time analysis
- Cluster-wide visibility — per-node stats, aggregated slowlogs, and slot-level metrics across all nodes
- Anomaly detection — Z-score analysis on memory, CPU, hit rate, and other metrics (Pro)
- Client activity tracking — connection counts, command distribution, and buffer usage over time
- ACL audit log — investigate auth failures and access patterns
- Latency event history — track latency trends for specific event types
Quick Start
1. Get a token
In BetterDB, go to Settings → MCP Tokens and generate a new token.
2. Configure your MCP client
Add to your MCP client config (e.g. Claude Code or OpenAI Codex):
{
  "mcpServers": {
    "betterdb": {
      "type": "stdio",
      "command": "npx",
      "args": ["@betterdb/mcp"],
      "env": {
        "BETTERDB_URL": "https://<your-workspace>.app.betterdb.com",
        "BETTERDB_TOKEN": "<your-token>"
      }
    }
  }
}
For local development with an existing monitor (token not required):
{
  "mcpServers": {
    "betterdb": {
      "type": "stdio",
      "command": "npx",
      "args": ["@betterdb/mcp"],
      "env": {
        "BETTERDB_URL": "http://localhost:3001"
      }
    }
  }
}
For zero-config local development (auto-starts and manages a monitor process):
{
  "mcpServers": {
    "betterdb": {
      "type": "stdio",
      "command": "npx",
      "args": ["@betterdb/mcp", "--autostart", "--persist"]
    }
  }
}
3. Start asking questions
Once connected, your AI assistant can query your databases directly:
- "What's the health of my production Valkey instance?"
- "Show me the slowest commands from the last hour"
- "Are there any hot keys causing uneven load?"
- "Which cluster node has the highest memory usage?"
- "Have there been any anomalies in the last 24 hours?"
- "Tune the threshold on my faq-cache — propose a change for me to review"
- "Why is the weather_lookup tool's hit rate so low?"
Configuration
Environment Variables
| Variable | Default | Description |
|---|---|---|
BETTERDB_URL |
http://localhost:3001 |
BetterDB instance URL (port depends on your Docker config) |
BETTERDB_TOKEN |
— | MCP token from Settings (required for cloud, optional for local) |
BETTERDB_INSTANCE_ID |
— | Pre-select a specific instance (skips select_instance) |
CLI Arguments
| Argument | Default | Description |
|---|---|---|
--autostart |
— | Spawn and manage a local BetterDB monitor process on startup |
--persist |
— | Keep the monitor running after the MCP server exits (requires --autostart) |
--port <number> |
3001 |
Port for the auto-started monitor API |
--storage <type> |
sqlite |
Storage backend: sqlite or memory
|
--stop |
— | Stop a previously persisted monitor process and exit |
Available Tools
Instance Tools
| Tool | Description |
|---|---|
list_instances |
List all registered Valkey/Redis instances with connection status |
select_instance |
Select which instance subsequent calls operate on |
get_health |
Synthetic health summary — the best starting point for any investigation |
get_info |
Full INFO stats, optionally filtered by section |
get_slowlog |
Recent slow commands from the slowlog buffer |
get_commandlog |
Recent COMMANDLOG entries (Valkey 8+) |
get_latency |
Latency event history |
get_latency_history |
Detailed history for a specific latency event |
get_memory |
MEMORY DOCTOR assessment and MEMORY STATS breakdown |
get_clients |
Active client list with connection details |
get_hot_keys |
Hot key tracking data from LFU or idle time analysis |
get_slowlog_patterns |
Aggregated slowlog patterns with frequency and avg duration |
get_commandlog_history |
Persisted COMMANDLOG entries with time range filtering |
get_commandlog_patterns |
Aggregated COMMANDLOG patterns |
get_anomalies |
Anomaly detection events (Pro) |
get_client_activity |
Time-bucketed client activity from persisted snapshots |
get_acl_audit |
ACL audit log entries |
get_cluster_nodes |
Cluster node discovery — roles, health, slot ranges |
get_cluster_node_stats |
Per-node performance stats across the cluster |
get_cluster_slowlog |
Aggregated slowlog across all cluster nodes |
get_slot_stats |
Per-slot key counts and CPU usage (Valkey 8+) |
Analytics Tools
| Tool | Description |
|---|---|
get_forecast |
Capacity forecast for a metric (opsPerSec, usedMemory, cpuTotal, memFragmentation) with projected time to ceiling |
get_latency_regressions |
Detected sustained p99 latency regressions vs baseline from the anomaly store (Pro) |
get_largest_keys |
Largest keys by measured memory usage from key analytics snapshots (Pro) |
Vector Search Tools
For deployments running the Search module (valkey-search / RediSearch).
| Tool | Description |
|---|---|
get_vector_indexes |
Per-index health: document count, memory usage, indexing failures, and percent indexed |
get_inference_latency |
FT.SEARCH p50/p95/p99 per vector index plus SLA breach status (SLA fields require Pro) |
AI Observability Tools
For AI components (semantic caches, agent caches, agent-memory stores, retrieval pipelines) and traces ingested via OpenTelemetry.
| Tool | Description |
|---|---|
ai_list_instances |
Superset discovery view of all AI component instances with liveness and latest metrics sample |
ai_instance_history |
Stored metrics time-series for one AI component instance (hit rate, cost saved, evictions, threshold, …) |
list_ai_traces |
List recent AI application traces (LLM calls, cache lookups, memory recalls, retrieval spans) |
get_ai_trace |
Full span waterfall for one trace with timing, parent relationships, and attributes |
correlate_ai_trace |
Join a trace's cache/memory spans with live Valkey state to explain misses or stale recalls |
Connection Management Tools
| Tool | Description |
|---|---|
add_connection |
Add a new Valkey/Redis connection to BetterDB |
test_connection |
Test connection credentials without persisting |
remove_connection |
Remove a connection from BetterDB |
set_default_connection |
Set a connection as the active default |
Monitor Lifecycle Tools
| Tool | Description |
|---|---|
start_monitor |
Start a persistent BetterDB monitor background process |
stop_monitor |
Stop a previously started persistent monitor process |
Cache Intelligence Tools
For deployments running @betterdb/semantic-cache or @betterdb/agent-cache. Caches register themselves in a Valkey-side discovery hash; Monitor exposes them through the tools below.
Read-only:
| Tool | Description |
|---|---|
cache_list |
List all caches registered for the active instance with hit rate and total ops |
cache_health |
Detailed health for one cache; response branches on cache_type (semantic_cache vs agent_cache) |
cache_threshold_recommendation |
Threshold-tuning recommendation for a semantic_cache, derived from the rolling similarity window |
cache_tool_effectiveness |
Per-tool hit rate, cost saved, and TTL recommendation for an agent_cache |
cache_similarity_distribution |
Histogram of recent similarity scores for a semantic_cache (20 buckets, width 0.1) |
cache_recent_changes |
Recent proposals (any status) for a single cache, so agents can avoid re-proposing |
Propose changes (advisory — no Valkey writes until approved):
| Tool | Description |
|---|---|
cache_propose_threshold_adjust |
Propose a similarity-threshold change on a semantic_cache (per-category or global) |
cache_propose_tool_ttl_adjust |
Propose a per-tool TTL change on an agent_cache |
cache_propose_invalidate |
Propose an invalidation; filter shape branches on cache type |
Approve / reject / list:
| Tool | Description |
|---|---|
cache_list_pending_proposals |
List pending proposals on the active instance, optionally filtered by cache_name |
cache_get_proposal |
Fetch a single proposal by id, including its audit trail |
cache_approve_proposal |
Approve a pending proposal; synchronously applies the change to Valkey |
cache_reject_proposal |
Reject a pending proposal with an optional reason |
cache_edit_and_approve_proposal |
Edit a proposal's value (threshold or TTL) and approve in one step; invalidate proposals are not editable |
Requirements
- Node.js 20+
- A running BetterDB instance (cloud or self-hosted), or use
--autostartto have the MCP server manage one automatically
Documentation
Full docs: docs.betterdb.com
License
See LICENSE for details.