Detachable Radeon discrete graphics.
The name may be generic, but the design is anything but. The environmentally-friendly Laptop 16 takes everything great about the Laptop 13.5 and bumps it up a notch with even more upgradeable and customizable components including a removable Radeon RDNA 3 GPU.

Revealed at GDC 2023, The Framework Laptop 16 expands upon the repairability and sustainability aspects of the Framework 13.5 but in a larger 16-inch form factor. It's much more than just a bigger version, however, as the larger screen size has allowed for even more customization and optional parts than the original 13.5-inch design including removable discrete graphics, touchpad spacers, LEDs, and numpad.
Our review unit is the highest-end configuration with the Ryzen 9 7940HS and 100 W Radeon RX 7700S for roughly $2400 USD retail. Lower-end SKUs ship with the Ryzen 7 7840HS and no discrete GPU, but all options come with the same 1600p 165 Hz VRR IPS display. Barebone and DIY kits are also available much like for the Laptop 13.5. Framework says the company worked closely with AMD on the design of the Laptop 16 to imply that we shouldn't be holding our breath for any Intel-Nvidia options anytime soon.
Though the Laptop 16 is wholly capable of gaming because of its specifications, Framework is being careful to avoid calling it a gaming laptop for fear of pigeonholing the model. The Laptop 16 is instead targeting a broader audience consisting of multimedia users, content creators, and gamers alike. Competitors to the Laptop 16 include 16-inch laptops from more traditional makers like the HP Spectre x360 16, upcoming Dell XPS 16, Lenovo ThinkPad Z16, or the Apple MacBook Pro 16.
More Framework reviews:
Processor
AMD Ryzen 9 7940HS 8c/16t 8 x 4 - 5.2 GHz, 79 W PL2 / Short Burst, 54 W PL1 / Sustained, Phoenix-HS (Zen 4)
Memory
32 GB
, ADATA, DDR5-5600, Dual-Channel, 46-45-45-90
Display
16.00 inch 16:10, 2560 x 1600 pixel 189 PPI, glossy: no, 165 Hz
Mainboard
AMD Promontory/Bixby FCH
Soundcard
AMD Zen - Audio Processor - HD Audio Controller
Connections
4 USB 3.1 Gen2, 2 USB4 40 Gbps, USB-C Power Delivery (PD), 3 DisplayPort, 1 Fingerprint Reader
Networking
MediaTek Wi-Fi 6E MT7922 160MHz Wireless LAN Card (a/b/g/n = Wi-Fi 4/ac = Wi-Fi 5/ax = Wi-Fi 6/ Wi-Fi 6E 6 GHz), Bluetooth 5.1
Size
height x width x depth (in mm): 20.95 x 356.58 x 290.2 ( = 0.82 x 14.04 x 11.43 in)
Battery
85 Wh Lithium-Polymer
Operating System
Microsoft Windows 11 Pro
Camera
Webcam: 1080p30
Primary Camera: 2 MPix
Additional features
Speakers: Stereo, Keyboard: Chiclet, Keyboard Light: yes, Expansion Cards, dGPU bay, Numpad, 12 Months Warranty
Weight
2.418 kg ( = 85.29 oz / 5.33 pounds), Power Supply: 487 g ( = 17.18 oz / 1.07 pounds)
Note: The manufacturer may use components from different suppliers including display panels, drives or memory sticks with similar specifications.
The chassis is an evolution of the smaller Laptop 13.5. While materials are largely the same between them, the Laptop 16 feels thicker and more rigid around the base for better first impressions even after accounting for all the new removable parts. Attempting to twist the base or warp the keyboard would result in almost no creaking and just minimal distortions which are already huge improvements over the more fragile Laptop 13.5.
Unfortunately, one attribute has not improved and that is the lid. Much like on the Laptop 13.5, the lid on the Laptop 16 is more susceptible to twisting and warping when compared to other 16-inch alternatives like the HP Spectre x360 16 or Blade 16. The hinges may be decent, but the lid feels like the weakest aspect of the chassis yet again.
Dimensions and weight are different depending on if the dGPU module is attached or if the smaller standard cover module is attached instead. Indeed, the Laptop 16 becomes noticeably heavier and longer than other 16-inch multimedia laptops when its dGPU module is attached. Its design is already quite long at 270 mm with just the standard cover module. If portability is a concern, you can certainly do better with more traditional laptops from Apple or the LG Gram series.
| With Standard Expansion Bay Cover Module | 356.58 x 270.0 x 17.95 mm | 2.1 kg |
| With Discrete Graphics Bay Module | 356.58 x 290.2 x 20.95 mm | 2.4 kg |
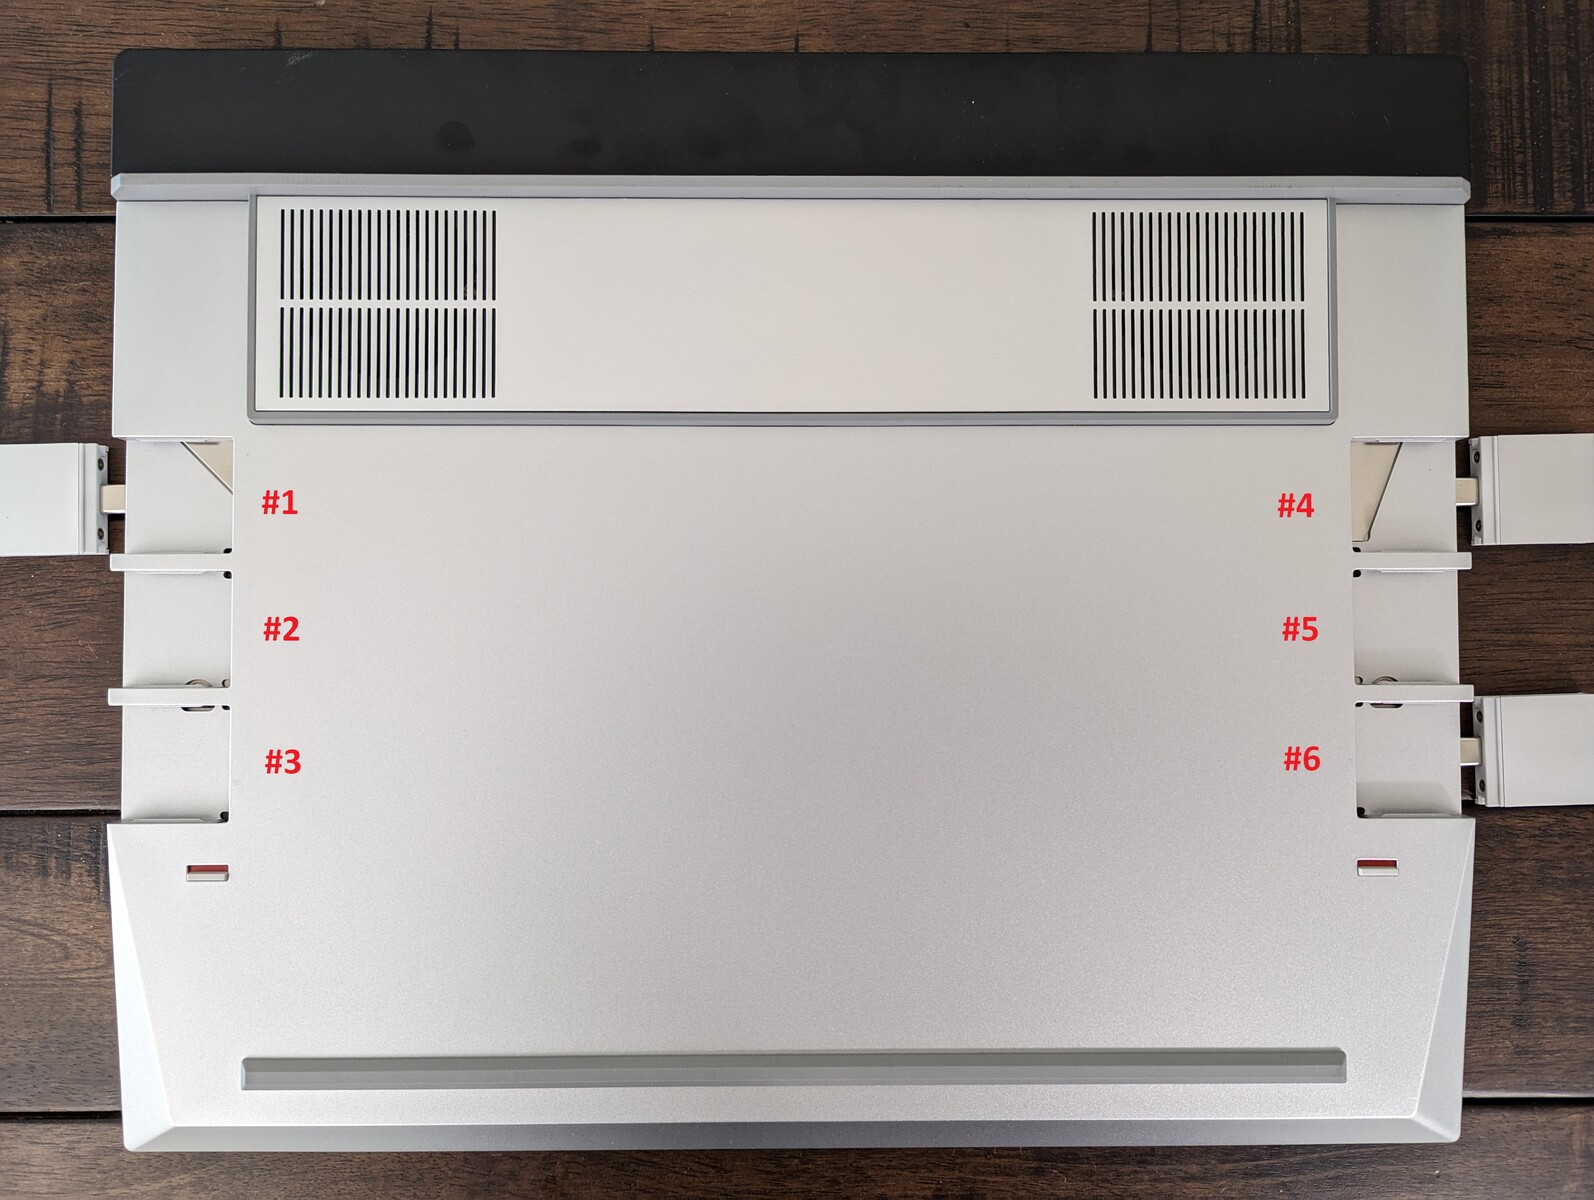
This is the only laptop in recent memory to integrate a total of six USB-C ports and nothing else — not even an audio jack or Kensington lock. All six ports are compatible with Framework's existing lineup of expansion cards and so they function the same way as on the Laptop 13.5.
It's important to note that the six USB-C ports are not created equal as shown by our table below. Only two are USB4, three are compatible with DP, and four are compatible with the USB-C AC adapter. There are no visual indicators to differentiate between the ports.
| Expansion Card Slot # | Interface | DisplayPort Compatible? | 240 W USB-C Charging Compatible? | USB-A High Power Consumption? |
| 1 | USB4 | Y | Y | Y |
| 2 | USB 3.2 | N | Y | N |
| 3 | USB 3.2 | N | N | N |
| 4 | USB4 | Y | Y | Y |
| 5 | USB 3.2 | Y | Y | N |
| 6 | USB 3.2 | N | N | N |
Additionally, there are still no expansion cards for full-size SD readers, WAN, or RJ-45. If such ports are important to you, then you'll have to look at USB adapters or docking stations.
A seventh USB-C port along the rear edge becomes available if the discrete GPU module is installed. This port is compatible with DP but not the AC adapter.
The Laptop 16 utilizes the same MicroSD expansion card reader as found on the Laptop 13.5 for similar read and write rates. At only around 80 MB/s, performance is much slower than the card readers on competing models like the ThinkPad Z16 Gen 2 or MacBook Pro 16.
We do not have access to the SD card reader expansion card for our Laptop 16 and so our data for the Laptop 13.5 is provided below in its place.
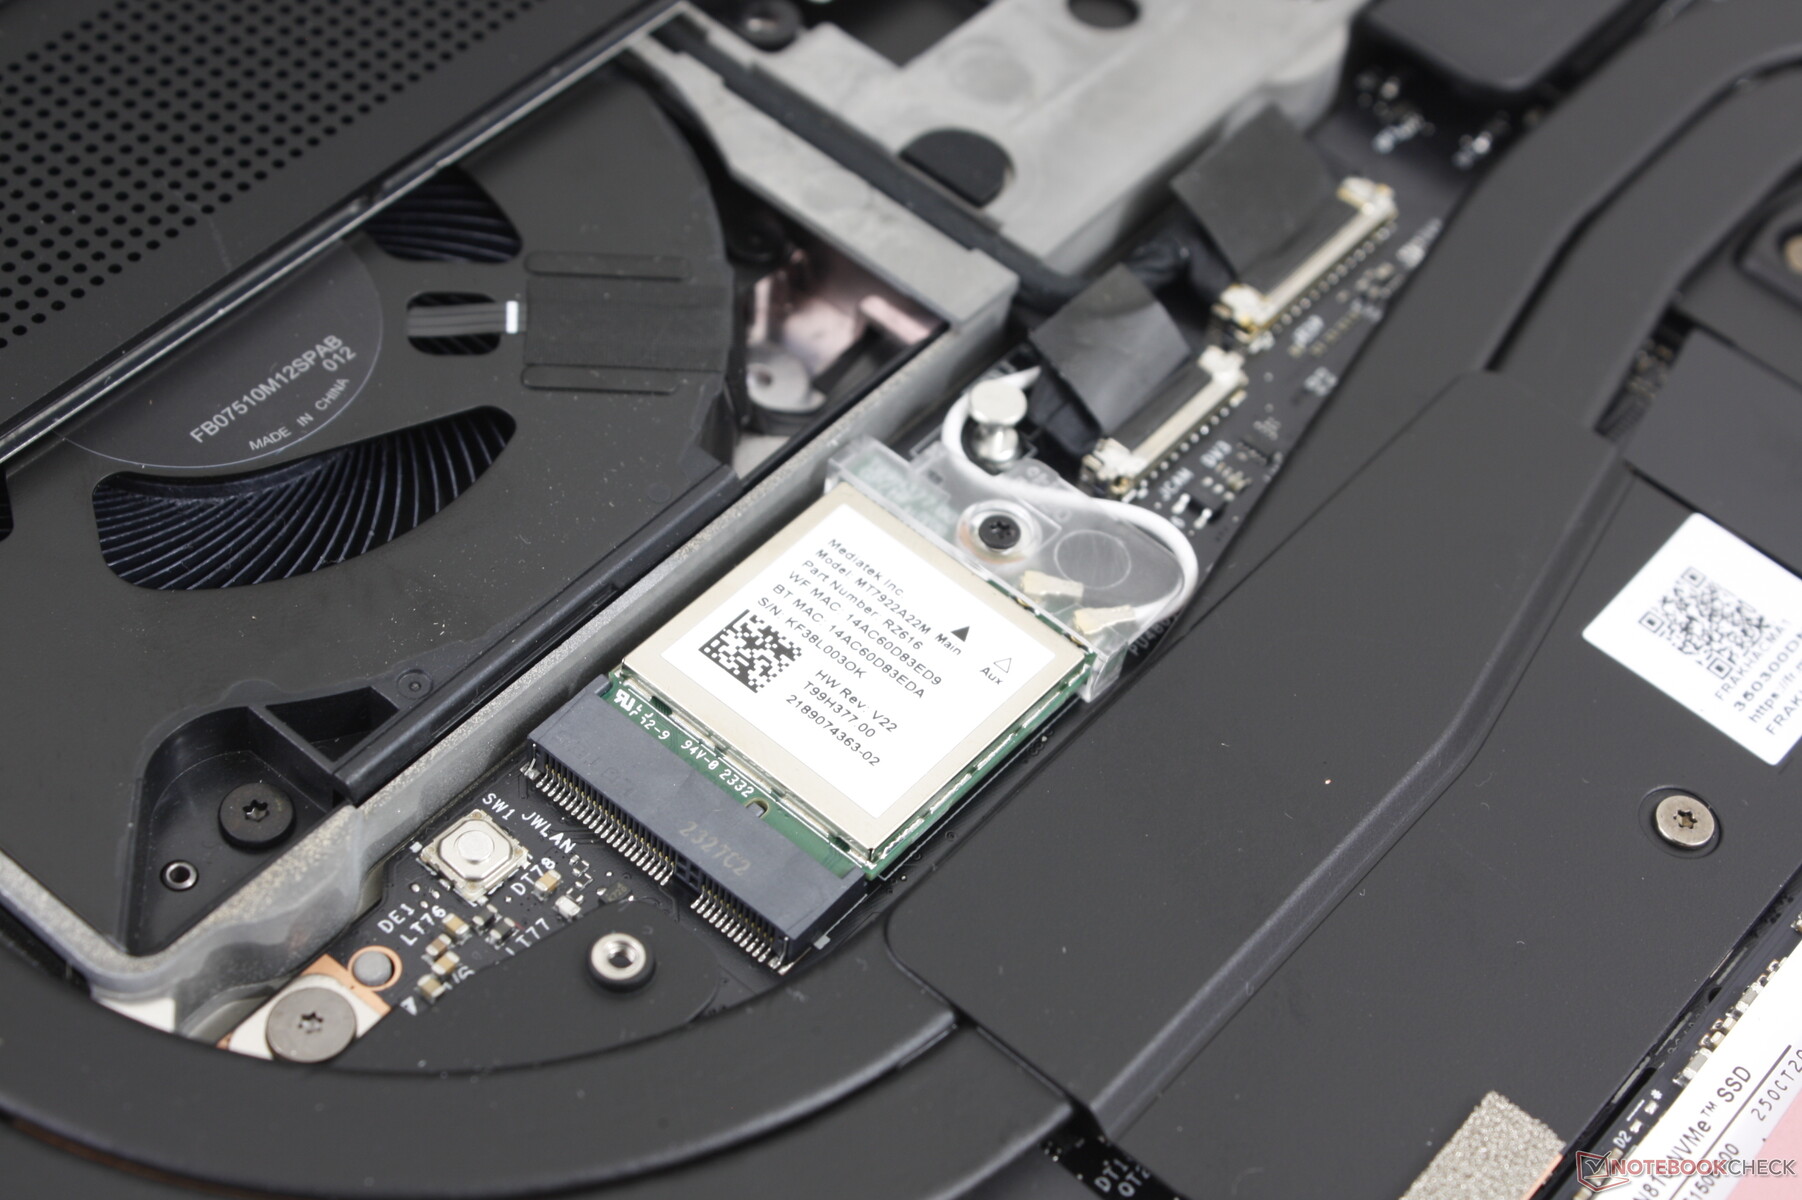
Wi-Fi 6 and 6E are provided by a MediaTek MT7922 instead of the usual AX211 in keeping with the Intel-free design of the model. We experienced steady and reliable connections when paired to our Asus AXE11000 test router.
WAN is unfortunately not supported.
A 2 MP webcam with IR and manual shutter come standard while competitors like the HP Spectre or Elite series have been shipping with 5 MP or higher webcams for well over a year. Hopefully Framework can offer improved webcam options in the future.

6.1 ∆E
8.2 ∆E
12.3 ∆E
11.8 ∆E
12.5 ∆E
10.3 ∆E
8.6 ∆E
5.2 ∆E
7.6 ∆E
1.2 ∆E
7.3 ∆E
7.3 ∆E
3.3 ∆E
6.8 ∆E
5 ∆E
3.4 ∆E
5.2 ∆E
11.6 ∆E
5.3 ∆E
2 ∆E
5.5 ∆E
6.4 ∆E
4.8 ∆E
1.7 ∆E
Unlike your typical laptop, the Laptop 16 is arguably defined by its accessories. The most notable include the removable rear discrete graphics module, LED Matrix modules, and RGB Macropad module. There is only one dGPU to choose from at the moment, but it's likely that more options will be made available in the future.
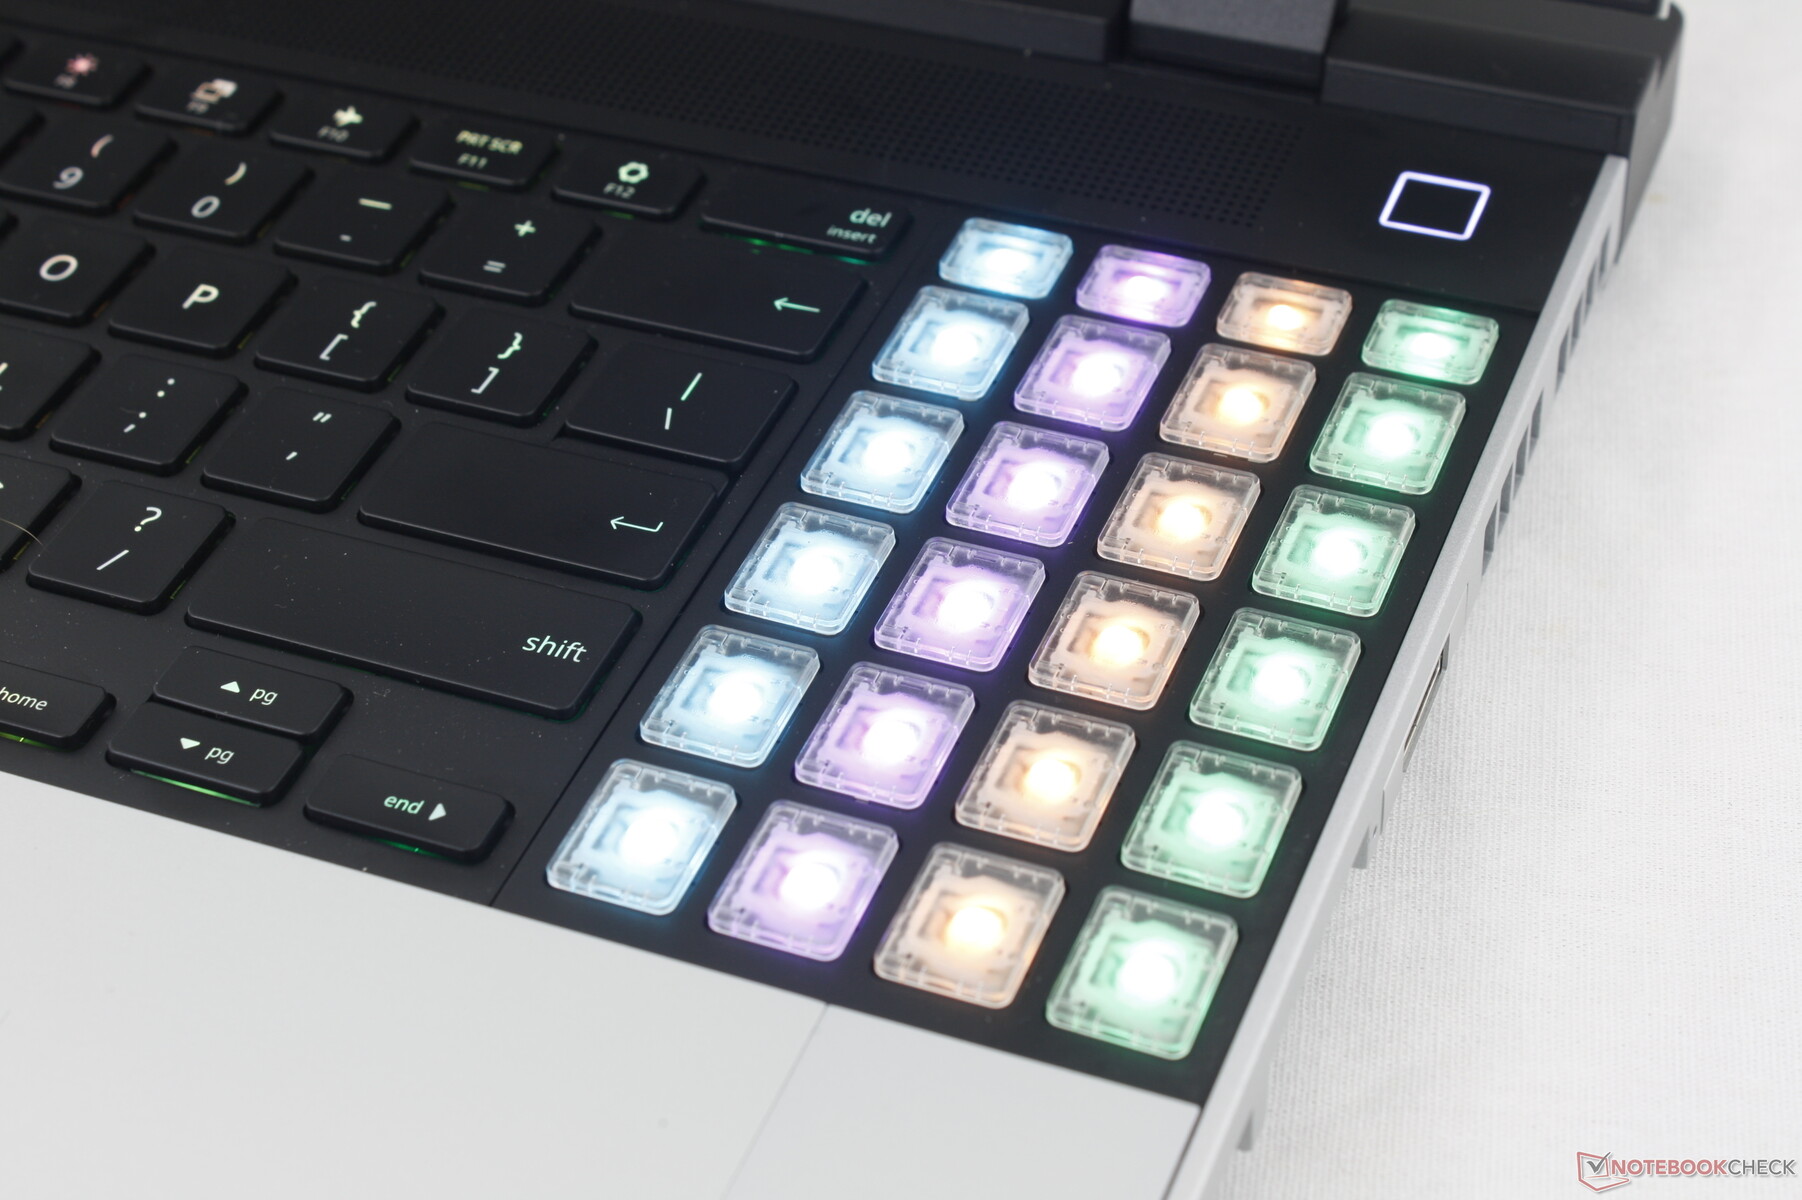
The RGB Macropad is a secondary option to the standard numpad. Its inputs are exactly the same as a regular numpad but the keys are visually different as they are transparent and with RGB backlighting whereas the standard numpad is printed and with only a white backlight. The clear and colorful keys of the Macropad can appeal to hardcore users or gamers who like to customize their key inputs.
As for the LED Matrix modules, these replace the regular spacers and consist of numerous LEDs in a pixel-like grid that can be programmed to show battery life levels, scrolling texts, notifications, or a clock.
Users who have no desire for the dGPU or LED Matrix modules can install standard plate covers in their respective places. These covers ship with all configurations of the Laptop 16.
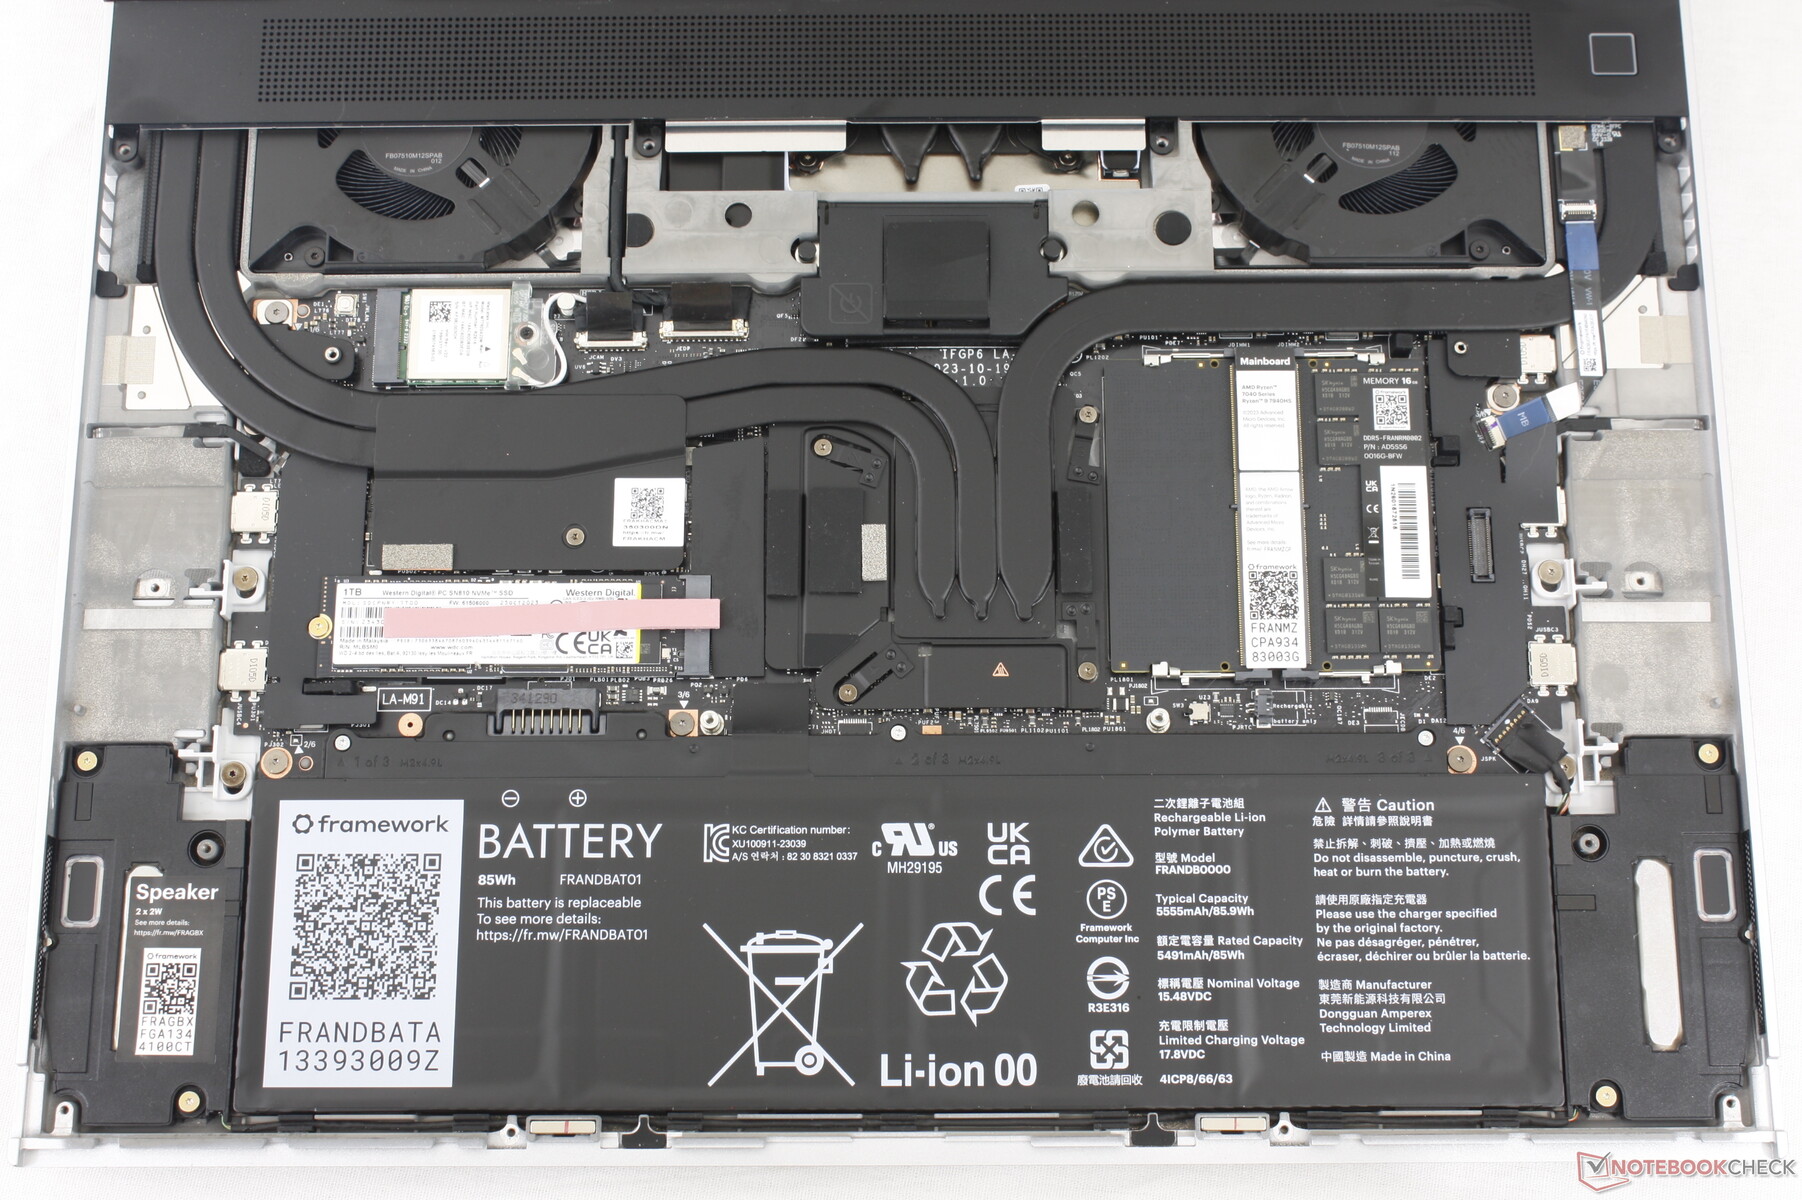
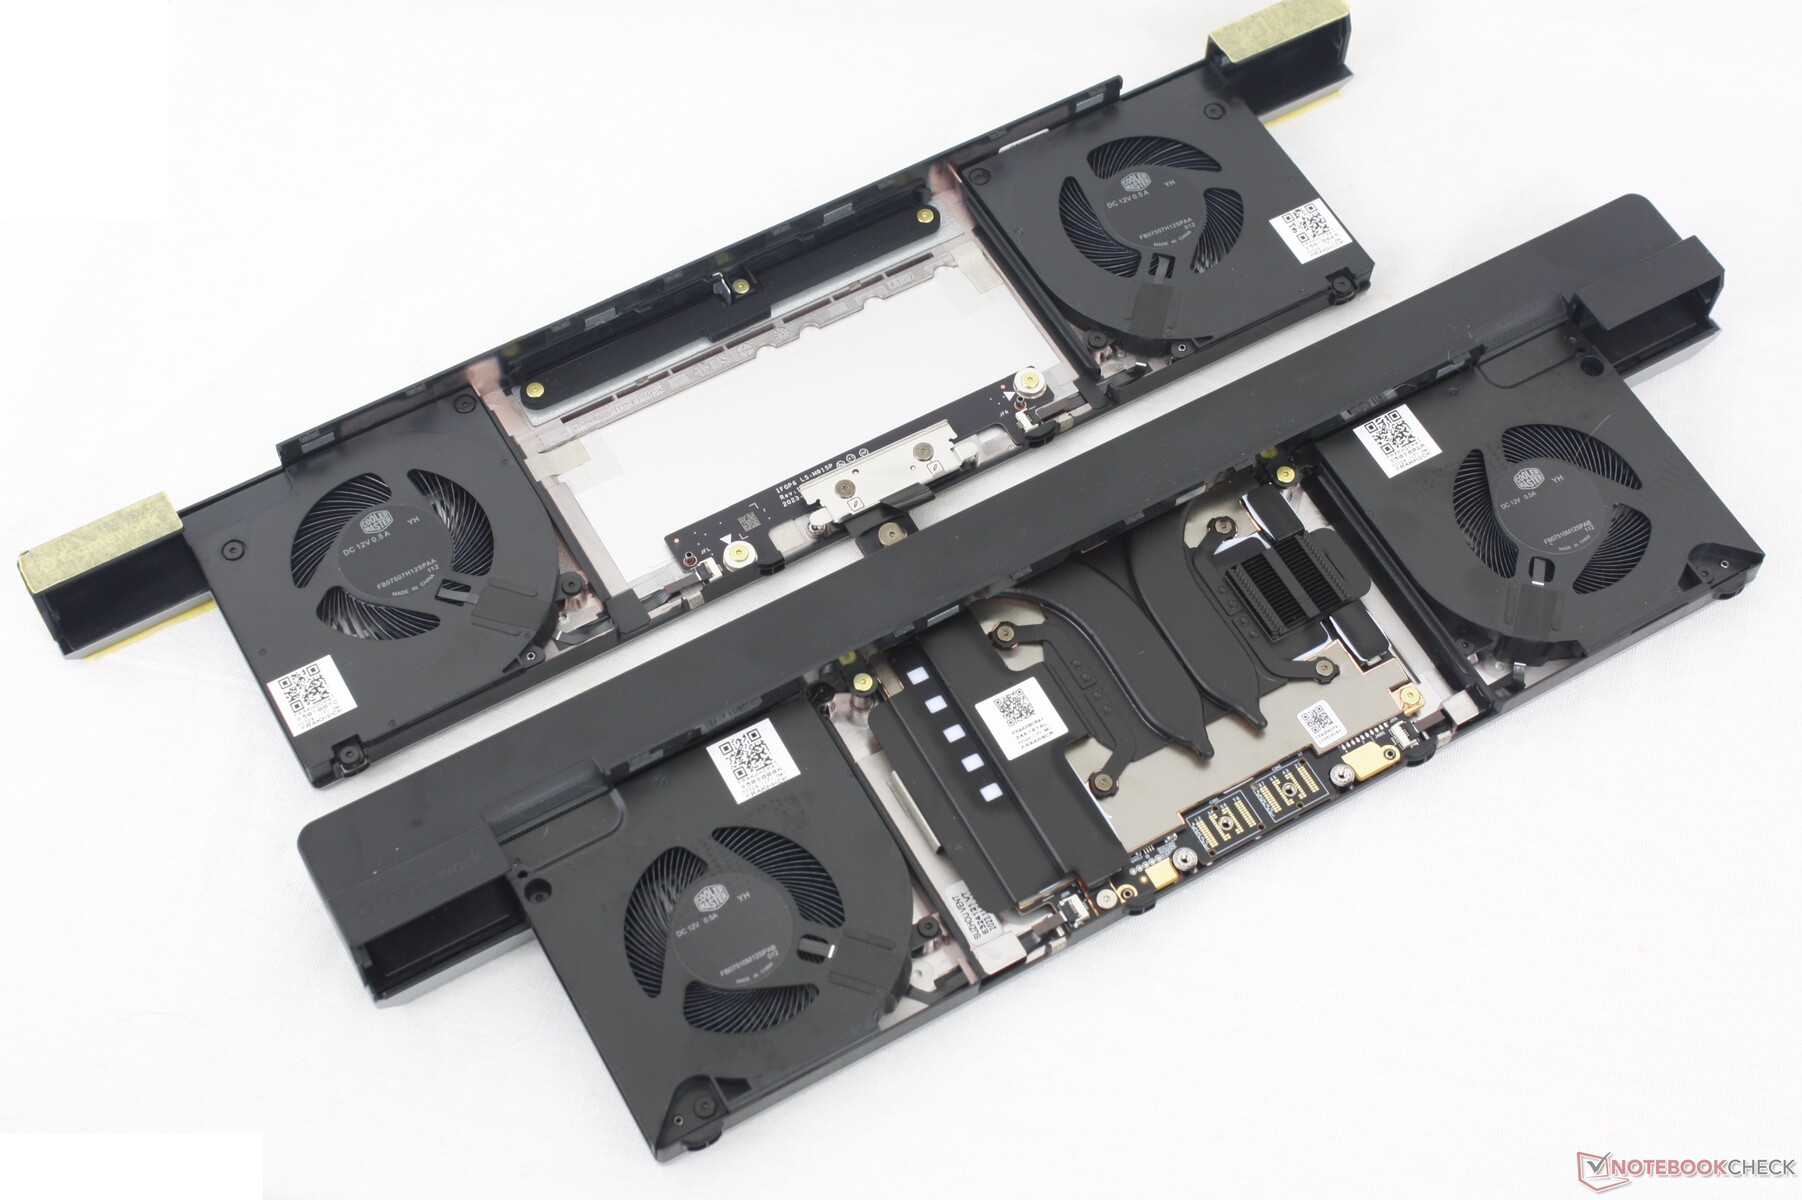
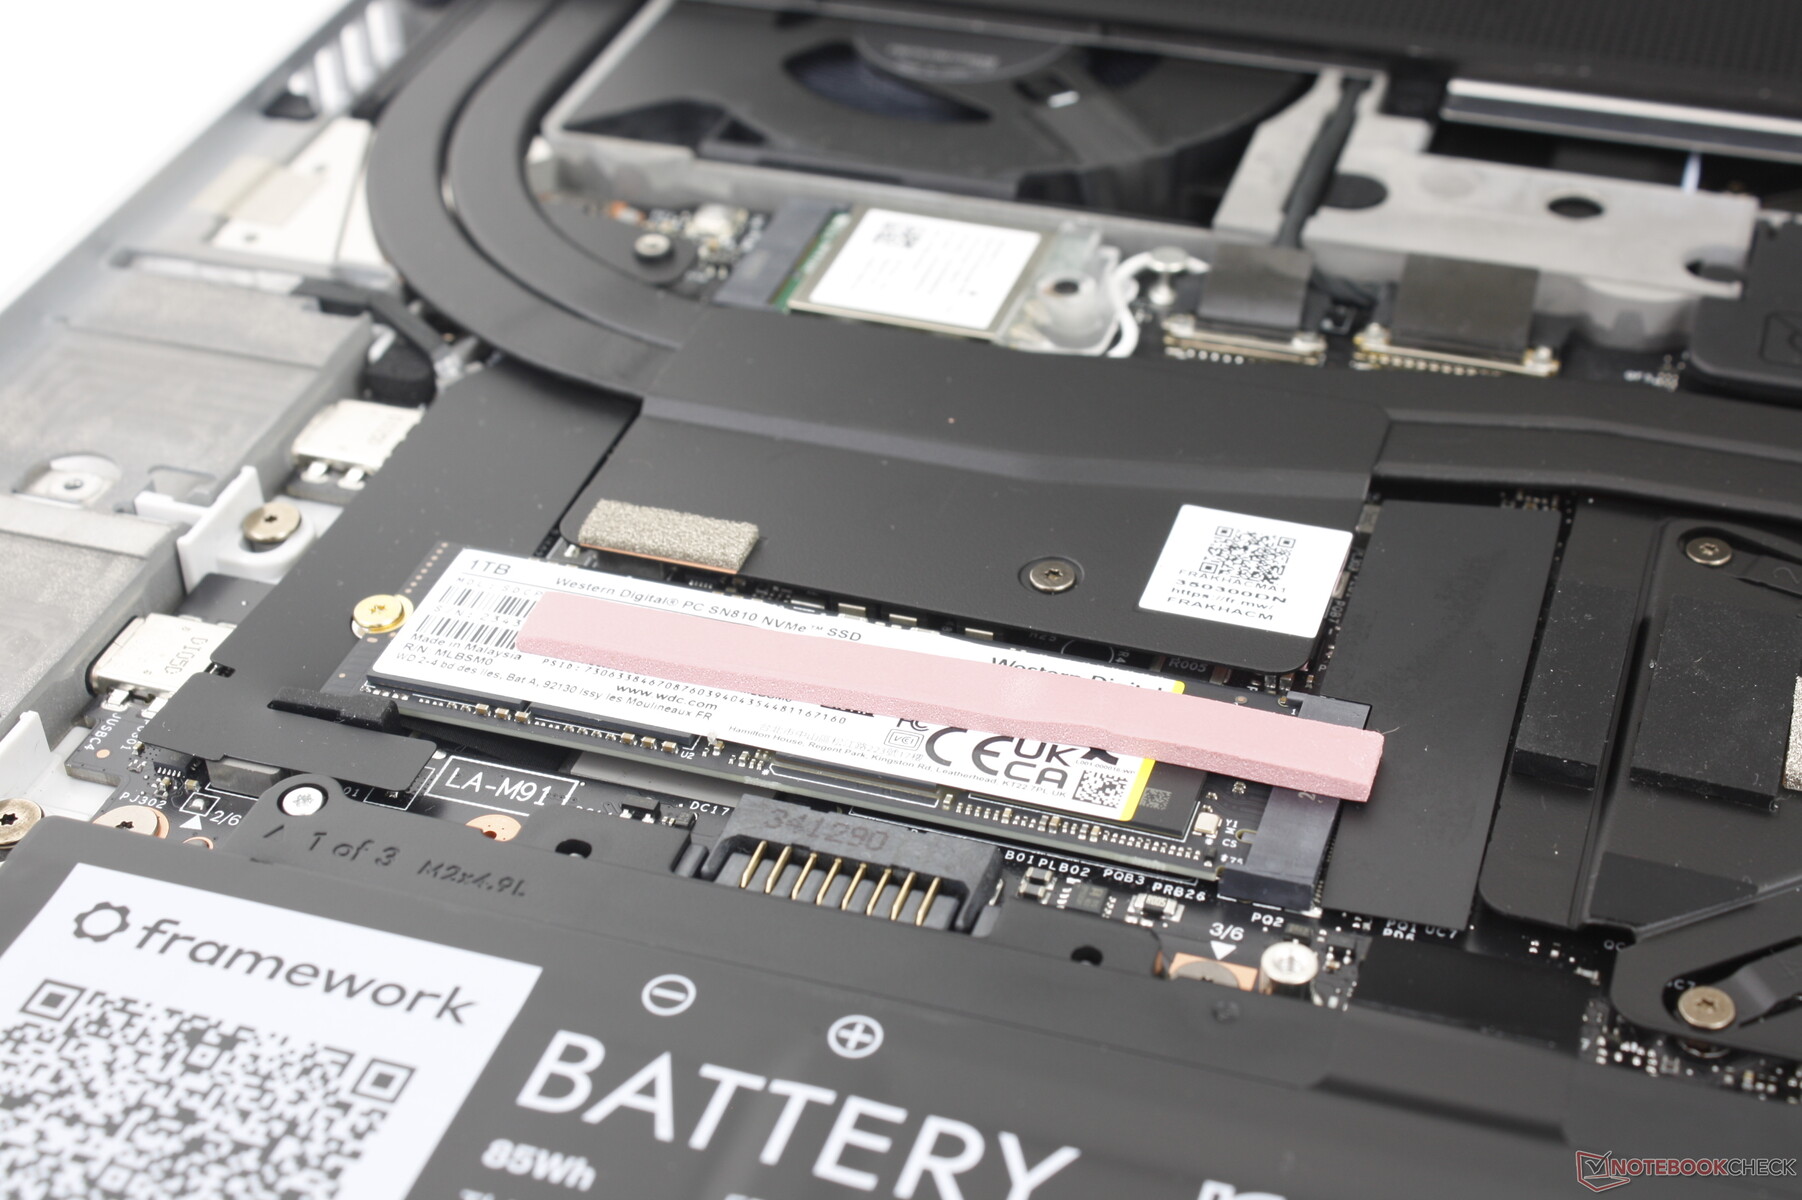
Beyond the accessories, most internal parts are replaceable and can be individually purchased from the manufacturer including the mainboard just like on the Framework 13.5.
Accessing the motherboard is more involved than usual. Whereas most other laptops require you to only remove the bottom panel, the Laptop 16 requires you to remove the keyboard, clickpad, a ribbon cable, 15 Torx screws, and a metal mid-plate to reveal the innards. It's not difficult by any means, but the process is slightly longer when compared to something like a traditional ThinkPad or EliteBook.
Thankfully, Framework offers some of the most detailed and easy-to-follow repair guides we've seen from any laptop manufacturer to make maintenance a breeze. We highly recommend checking out the extensive official support page which covers everything from simple RAM and SSD upgrades to mainboard replacements and dGPU module installation. We don't need to reprint the entire maintenance process, but the procedures have a slightly higher learning curve than the Laptop 13.5 due to the complexities of the new removable dGPU and larger input modules.
While many of the modules are magnetic, a screwdriver is still required for installing the rear dGPU and some modules must be installed in a certain order. The rear module in particular is not plug-and-play as the system must be powered off and the keyboard and clickpad must first be removed. The good news is that you only need to disassemble and reassemble the system once before the maintenance procedures become second nature. Framework even encourages this by shipping the keyboard and clickpad detached which effectively forces the user to learn how some of the modules work before turning on the laptop for the first time.
The use of magnets and latches for the touchpad modules is an intuitive approach to servicing. We're hopeful to see this expanded upon to the point where all modules and upgrades can be tool-less.
The standard one-year limited manufacturer warranty applies if purchased in the US. The protection covers the laptop in addition to its parts and modules.
The per-key RGB keys have 1.5 mm of travel which is common amongst most Ultrabooks. The typing experience doesn't feel hindered by the removable aspect of the keyboard which is exactly what we like to see. Users who prefer laptops with deeper and firmer key travel should try out the HP Spectre.
Oddly, the numpad keys only have a white backlight whereas the main QWERTY keys are RGB lit. Users who prefer to have no numpad at all can instead install spacers to center the QWERTY keyboard or install an RGB macropad with customizable keys. The ability to reposition or center the keyboard to your liking is not something we've seen on any other laptop. The numpad, for example, can be installed to the left or right of the QWERTY keyboard for some truly interesting configurations.
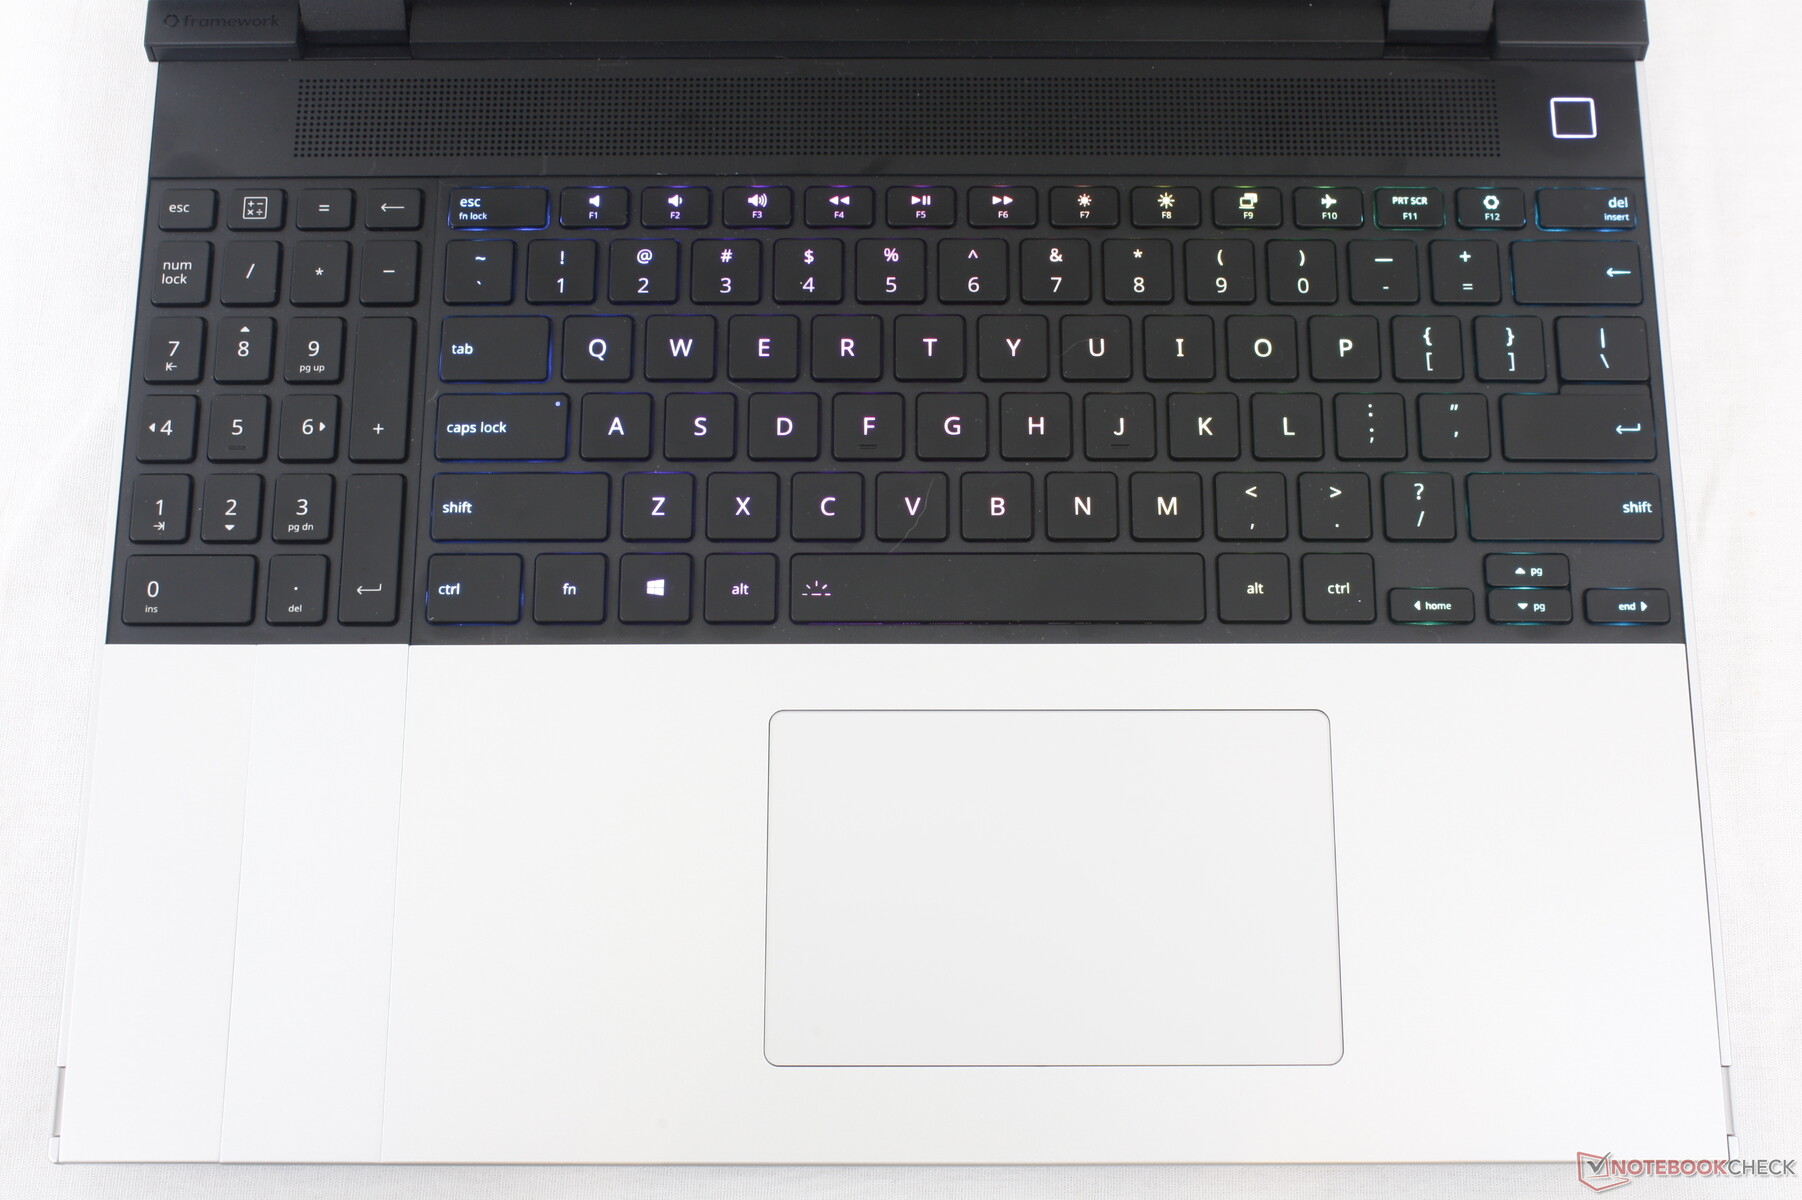
At 12.3 x 7.7 cm, the Precision clickpad is smaller than the one on the MSI Prestige 16 (15 x 9 cm) and about the same size as the one on the Inspiron 16 Plus (11.5 x 8 cm). Traction is smooth on the matte glass surface with just a bit of sticking when gliding at slower speeds for improved accuracy. Clicking also feels good as feedback isn't as spongy as on the Prestige 16, but clatter is slightly louder as a result.
A unique aspect about the clickpad is that it can be shifted left or right on the palm rests depending on how it is installed as shown by the pictures below. This is a neat feature for users who might prefer the clickpad off-centered.
With absolutely no other display options to choose from at the time of writing, we have high expectations for the sole IPS panel that comes with every Laptop 16 configuration. Fortunately, we can safely say that Framework didn't cheap out on the display at all. The 2560 x 1600 panel offers fast response times, DCI-P3 colors, a bright backlight, relatively high contrast ratio, and even a variable 165 Hz refresh rate with FreeSync support. The Laptop 16 is consequently one of the first laptops to ship with the BOE NE160QDM-NZ6 VRR panel.
As an IPS panel, however, it doesn't quite reach the same pitch black contrast ratios or response times as a typical OLED alternative like those on the Asus VivoBook 16 series. It also lacks proper HDR support which is becoming an increasingly common feature on multimedia laptops. For a laptop that boasts end-user upgradeability, it's odd to see no second display option here. Even so, this is still one of the best 16-inch IPS displays we've seen for both editing and gaming purposes.
| 527.7 cd/m² | 506.9 cd/m² | 500.2 cd/m² | ||
| 479.1 cd/m² | 504.8 cd/m² | 459.5 cd/m² | ||
| 485.7 cd/m² | 504.4 cd/m² | 442.4 cd/m² | ||
Distribution of brightness
tested with X-Rite i1Pro 2
Maximum: 527.7 cd/m² (Nits) Average: 490.1 cd/m² Minimum: 26.1 cd/m²
Brightness Distribution: 84 %
Center on Battery: 504.8 cd/m²
Contrast: 1231:1 (Black: 0.41 cd/m²)
ΔE ColorChecker Calman: 1.23 | ∀{0.5-29.43 Ø4.73}
calibrated: 1.1
ΔE Greyscale Calman: 2 | ∀{0.09-98 Ø4.97}
87% AdobeRGB 1998 (Argyll 3D)
99.7% sRGB (Argyll 3D)
97.7% Display P3 (Argyll 3D)
Gamma: 2.22
CCT: 6670 K
| Framework Laptop 16 2560x1600, 16" | MSI Prestige 16 B1MG-001US AU Optronics B160QAN03.R, IPS, 2560x1600, 16" | Lenovo ThinkPad Z16 Gen 2 Samsung ATNA60YV04-0, OLED, 3840x2400, 16" | Apple MacBook Pro 16 2023 M3 Max Mini-LED, 3456x2234, 16" | Dell Inspiron 16 Plus 7630 LG Philips 160WQ2, IPS, 2560x1600, 16" | HP Spectre x360 2-in-1 16-f1075ng AU Optronics AUO50A3, IPS, 3072x1920, 16" | |
|---|---|---|---|---|---|---|
| Display | -1% | 4% | 2% | -15% | -11% | |
| Display P3 Coverage (%) | 97.7 | 96.7 -1% | 99.7 2% | 99.2 2% | 70.1 -28% | 75.6 -23% |
| sRGB Coverage (%) | 99.7 | 99.8 0% | 100 0% | 99.6 0% | 100.2 1% | |
| AdobeRGB 1998 Coverage (%) | 87 | 84.6 -3% | 96.7 11% | 72.3 -17% | 77.2 -11% | |
| Response Times | -219% | 85% | -322% | -127% | -202% | |
| Response Time Grey 50% / Grey 80% * (ms) | 14.6 ?(7.1, 7.5) | 49.4 ?(22.6, 26.8) -238% | 1.86 ?(0.96, 0.9) 87% | 66.9 ?(29.4, 37.5) -358% | 35 ?(15.7, 19.3) -140% | 52 ?(23, 29) -256% |
| Response Time Black / White * (ms) | 11.3 ?(6.1, 5.2) | 33.9 ?(15.6, 18.3) -200% | 1.89 ?(0.89, 1) 83% | 43.6 ?(13.6, 30) -286% | 24.2 ?(10.8, 13.4) -114% | 28 ?(14, 14) -148% |
| PWM Frequency (Hz) | 60 ?(100) | 14877 | ||||
| Screen | -70% | -6% | 15% | -50% | -120% | |
| Brightness middle (cd/m²) | 504.8 | 473.6 -6% | 390.1 -23% | 630 25% | 299.4 -41% | 425 -16% |
| Brightness (cd/m²) | 490 | 456 -7% | 393 -20% | 604 23% | 290 -41% | 406 -17% |
| Brightness Distribution (%) | 84 | 87 4% | 97 15% | 94 12% | 92 10% | 78 -7% |
| Black Level * (cd/m²) | 0.41 | 0.19 54% | 0.21 49% | 0.24 41% | ||
| Contrast (:1) | 1231 | 2493 103% | 1426 16% | 1771 44% | ||
| Colorchecker dE 2000 * | 1.23 | 5.9 -380% | 1.41 -15% | 1.2 2% | 4.25 -246% | 5.8 -372% |
| Colorchecker dE 2000 max. * | 3.74 | 9.37 -151% | 3.43 8% | 2.8 25% | 6.71 -79% | 11.03 -195% |
| Colorchecker dE 2000 calibrated * | 1.1 | 0.89 19% | 0.52 53% | 4.16 -278% | ||
| Greyscale dE 2000 * | 2 | 7.3 -265% | 2 -0% | 1.9 5% | 5.5 -175% | 7.57 -279% |
| Gamma | 2.22 99% | 1.9 116% | 2.22 99% | 2.29 96% | 2.35 94% | 6600 0% |
| CCT | 6670 97% | 7260 90% | 6324 103% | 6812 95% | 6368 102% | |
| Total Average (Program / Settings) | -97% / -77% | 28% / 13% | -102% / -61% | -64% / -54% | -111% / -108% |
* ... smaller is better
The display comes well-calibrated against the sRGB standard even though the panel covers 100% of DCI-P3. Calibrating the display ourselves would not improve its average deltaE values by noticeable margins and so an end-user calibration will not be necessary for most.
Display Response Times
ℹ
Display response times show how fast the screen is able to change from one color to the next. Slow response times can lead to afterimages and can cause moving objects to appear blurry (ghosting). Gamers of fast-paced 3D titles should pay special attention to fast response times.
| ↔ Response Time Black to White | ||
|---|---|---|
| 11.3 ms ... rise ↗ and fall ↘ combined | ↗ 6.1 ms rise | 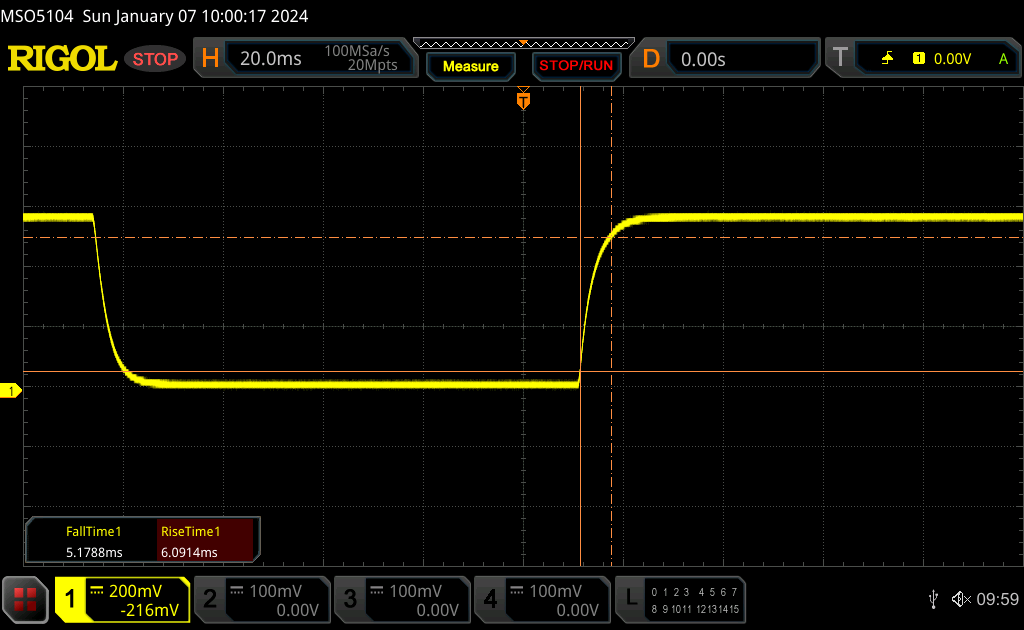 |
| ↘ 5.2 ms fall | ||
| The screen shows good response rates in our tests, but may be too slow for competitive gamers. In comparison, all tested devices range from 0.1 (minimum) to 240 (maximum) ms. » 31 % of all devices are better. This means that the measured response time is better than the average of all tested devices (19.9 ms). | ||
| ↔ Response Time 50% Grey to 80% Grey | ||
| 14.6 ms ... rise ↗ and fall ↘ combined | ↗ 7.1 ms rise | 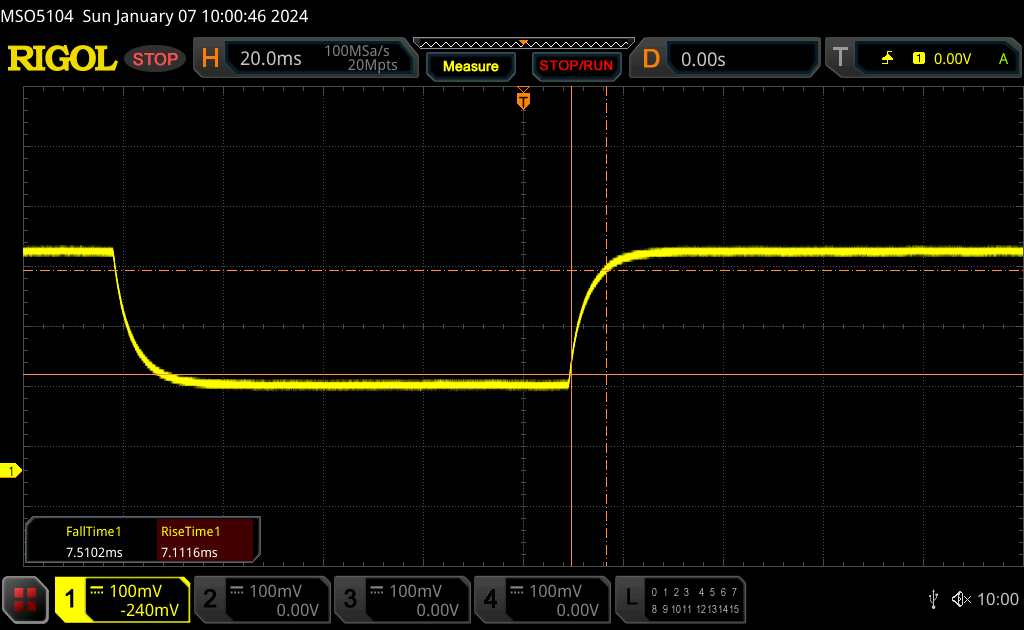 |
| ↘ 7.5 ms fall | ||
| The screen shows good response rates in our tests, but may be too slow for competitive gamers. In comparison, all tested devices range from 0.165 (minimum) to 636 (maximum) ms. » 29 % of all devices are better. This means that the measured response time is better than the average of all tested devices (31.1 ms). | ||
Screen Flickering / PWM (Pulse-Width Modulation)
ℹ
To dim the screen, some notebooks will simply cycle the backlight on and off in rapid succession - a method called Pulse Width Modulation (PWM) . This cycling frequency should ideally be undetectable to the human eye. If said frequency is too low, users with sensitive eyes may experience strain or headaches or even notice the flickering altogether.
| Screen flickering / PWM not detected |  | ||
In comparison: 52 % of all tested devices do not use PWM to dim the display. If PWM was detected, an average of 7794 (minimum: 5 - maximum: 343500) Hz was measured. | |||
At 500 nits, the display is brighter than many other multimedia laptops including even the OLED panels on the ThinkPad Z16 Gen 2 or MSI Stealth 16. The high brightness and matte panel make the screen easier to see under outdoor conditions.

We set Windows to Performance mode and AMD Adrenalin to Default prior to running the benchmarks below. SmartAccess Graphics is AMD's MUX solution to automatically switch between the iGPU and dGPU depending on the application. The problem is that unlike on GeForce-powered laptops, SmartAccess Graphics does not offer a "dGPU-only" or "iGPU-only" mode and so your graphics experience relies wholly on automatic switching. The system must freeze for a couple of seconds whenever it detects a GPU-heavy application which can be annoying when multi-tasking between different windows. Implementing a "dGPU-only" mode would have addressed this issue.
The Ryzen 9 7940HS is commonly found on fast multimedia or gaming laptops like the Asus ROG Zephyrus G14 or TUF Gaming A17. It competes directly with the 13th gen Core i7-13700H and so the two processors are roughly comparable.
Framework offers the Ryzen 7 7840HS on lesser configurations of the Laptop 16. Based on our experience with the Lenovo Legion Slim 7 16APH8, however, the Ryzen 7 7840HS is essentially neck-to-neck with the Ryzen 9 7940HS despite what their price differences and naming convention may suggest. If you don't need that extra 5 percent performance from the Ryzen 9, then you can save yourself hundreds of dollars by going with the Ryzen 7 option.
It's too bad that Framework doesn't offer the Ryzen 9 Pro 7940HS which would have made the Laptop 16 more appealing to professionals.
| CPU Performance rating | |
| Asus Zephyrus Duo 16 GX650PY-NM006W AMD Ryzen 9 7945HX | 83.9 pt |
| Asus Vivobook Pro 16X K6604JV-MX016W Intel Core i9-13980HX | 74.8 pt |
| Alienware m16 R1 AMD AMD Ryzen 9 7845HX | 74.7 pt |
| Apple MacBook Pro 16 2023 M3 Max -5! Apple M3 Max 16-Core | 73 pt |
| Lenovo Legion Pro 5 16ARX8 AMD Ryzen 7 7745HX | 64.7 pt |
| Average AMD Ryzen 9 7940HS | 60 pt |
| Framework Laptop 16 AMD Ryzen 9 7940HS | 59.5 pt |
| Lenovo ThinkPad Z16 Gen 2 AMD Ryzen 9 PRO 7940HS | 59.2 pt |
| MSI Stealth 16 Mercedes-AMG Motorsport A13VG Intel Core i9-13900H | 58.5 pt |
| Dell Inspiron 16 Plus 7630 Intel Core i7-13700H | 56.4 pt |
| Lenovo Legion Slim 7 16APH8 AMD Ryzen 7 7840HS | 56.3 pt |
| MSI Prestige 16 B1MG-001US Intel Core Ultra 7 155H | 53.7 pt |
| HP Spectre x360 2-in-1 16-f1075ng Intel Core i7-12700H | 49.9 pt |
| Acer Swift Edge SFE16-42-R1GM AMD Ryzen 7 7735U | 40.6 pt |
| Cinebench R23 / Multi Core | |
| Asus Zephyrus Duo 16 GX650PY-NM006W AMD Ryzen 9 7945HX | 34521 (32987.6min - 34521.3max) Points +109% |
| Asus Vivobook Pro 16X K6604JV-MX016W Intel Core i9-13980HX | 28963 Points +75% |
| Alienware m16 R1 AMD AMD Ryzen 9 7845HX | 26876 (25414.3min - 26876.4max) Points +63% |
| Apple MacBook Pro 16 2023 M3 Max Apple M3 Max 16-Core | 24024 Points +45% |
| MSI Stealth 16 Mercedes-AMG Motorsport A13VG Intel Core i9-13900H | 19907 Points +21% |
| Lenovo Legion Pro 5 16ARX8 AMD Ryzen 7 7745HX | 18060 (17729.5min - 18059.9max) Points +9% |
| Lenovo ThinkPad Z16 Gen 2 AMD Ryzen 9 PRO 7940HS | 16938 (16164.3min - 16938.4max) Points +3% |
| Average AMD Ryzen 9 7940HS (15556 - 18131, n=12) | 16746 Points +1% |
| Framework Laptop 16 AMD Ryzen 9 7940HS | 16519 (16352.4min - 16518.9max) Points |
| Lenovo Legion Slim 7 16APH8 AMD Ryzen 7 7840HS | 16364 Points -1% |
| Dell Inspiron 16 Plus 7630 Intel Core i7-13700H | 15922 (13533.8min - 15922.1max) Points -4% |
| MSI Prestige 16 B1MG-001US Intel Core Ultra 7 155H | 15013 (14365.6min - 15012.9max) Points -9% |
| HP Spectre x360 2-in-1 16-f1075ng Intel Core i7-12700H | 12071 Points -27% |
| Acer Swift Edge SFE16-42-R1GM AMD Ryzen 7 7735U | 10085 Points -39% |
| Cinebench R23 / Single Core | |
| MSI Stealth 16 Mercedes-AMG Motorsport A13VG Intel Core i9-13900H | 2023 Points +17% |
| Apple MacBook Pro 16 2023 M3 Max Apple M3 Max 16-Core | 1968 Points +14% |
| Asus Zephyrus Duo 16 GX650PY-NM006W AMD Ryzen 9 7945HX | 1940 Points +12% |
| Dell Inspiron 16 Plus 7630 Intel Core i7-13700H | 1874 Points +8% |
| Alienware m16 R1 AMD AMD Ryzen 9 7845HX | 1852 Points +7% |
| Lenovo Legion Pro 5 16ARX8 AMD Ryzen 7 7745HX | 1846 Points +7% |
| Asus Vivobook Pro 16X K6604JV-MX016W Intel Core i9-13980HX | 1825 Points +5% |
| HP Spectre x360 2-in-1 16-f1075ng Intel Core i7-12700H | 1808 Points +4% |
| Lenovo ThinkPad Z16 Gen 2 AMD Ryzen 9 PRO 7940HS | 1794 Points +4% |
| Average AMD Ryzen 9 7940HS (1733 - 1832, n=12) | 1785 Points +3% |
| Lenovo Legion Slim 7 16APH8 AMD Ryzen 7 7840HS | 1754 Points +1% |
| MSI Prestige 16 B1MG-001US Intel Core Ultra 7 155H | 1749 Points +1% |
| Framework Laptop 16 AMD Ryzen 9 7940HS | 1733 Points |
| Acer Swift Edge SFE16-42-R1GM AMD Ryzen 7 7735U | 1490 Points -14% |
| Cinebench R20 / CPU (Multi Core) | |
| Asus Zephyrus Duo 16 GX650PY-NM006W AMD Ryzen 9 7945HX | 13457 Points +110% |
| Asus Vivobook Pro 16X K6604JV-MX016W Intel Core i9-13980HX | 11260 Points +76% |
| Alienware m16 R1 AMD AMD Ryzen 9 7845HX | 10492 Points +64% |
| MSI Stealth 16 Mercedes-AMG Motorsport A13VG Intel Core i9-13900H | 7659 Points +20% |
| Lenovo Legion Pro 5 16ARX8 AMD Ryzen 7 7745HX | 7072 Points +10% |
| Lenovo ThinkPad Z16 Gen 2 AMD Ryzen 9 PRO 7940HS | 6601 Points +3% |
| Average AMD Ryzen 9 7940HS (6277 - 7111, n=12) | 6568 Points +3% |
| Framework Laptop 16 AMD Ryzen 9 7940HS | 6402 Points |
| Lenovo Legion Slim 7 16APH8 AMD Ryzen 7 7840HS | 6379 Points 0% |
| Apple MacBook Pro 16 2023 M3 Max Apple M3 Max 16-Core | 6327 Points -1% |
| Dell Inspiron 16 Plus 7630 Intel Core i7-13700H | 6162 Points -4% |
| MSI Prestige 16 B1MG-001US Intel Core Ultra 7 155H | 5741 Points -10% |
| HP Spectre x360 2-in-1 16-f1075ng Intel Core i7-12700H | 4693 Points -27% |
| Acer Swift Edge SFE16-42-R1GM AMD Ryzen 7 7735U | 3895 Points -39% |
| Cinebench R20 / CPU (Single Core) | |
| MSI Stealth 16 Mercedes-AMG Motorsport A13VG Intel Core i9-13900H | 776 Points +14% |
| Asus Zephyrus Duo 16 GX650PY-NM006W AMD Ryzen 9 7945HX | 756 Points +11% |
| Dell Inspiron 16 Plus 7630 Intel Core i7-13700H | 725 Points +7% |
| Alienware m16 R1 AMD AMD Ryzen 9 7845HX | 719 Points +6% |
| Lenovo Legion Pro 5 16ARX8 AMD Ryzen 7 7745HX | 717 Points +5% |
| Asus Vivobook Pro 16X K6604JV-MX016W Intel Core i9-13980HX | 717 Points +5% |
| Average AMD Ryzen 9 7940HS (679 - 714, n=12) | 698 Points +3% |
| HP Spectre x360 2-in-1 16-f1075ng Intel Core i7-12700H | 697 Points +2% |
| Lenovo ThinkPad Z16 Gen 2 AMD Ryzen 9 PRO 7940HS | 695 Points +2% |
| Framework Laptop 16 AMD Ryzen 9 7940HS | 680 Points |
| Lenovo Legion Slim 7 16APH8 AMD Ryzen 7 7840HS | 672 Points -1% |
| MSI Prestige 16 B1MG-001US Intel Core Ultra 7 155H | 669 Points -2% |
| Acer Swift Edge SFE16-42-R1GM AMD Ryzen 7 7735U | 524 Points -23% |
| Apple MacBook Pro 16 2023 M3 Max Apple M3 Max 16-Core | 497 Points -27% |
| Cinebench R15 / CPU Multi 64Bit | |
| Asus Zephyrus Duo 16 GX650PY-NM006W AMD Ryzen 9 7945HX | 5554 (5255.55min - 5554.01max) Points +109% |
| Asus Vivobook Pro 16X K6604JV-MX016W Intel Core i9-13980HX | 4703 (3529.2min - 4703.12max) Points +77% |
| Alienware m16 R1 AMD AMD Ryzen 9 7845HX | 4320 (4198.59min - 4320.12max) Points +63% |
| Apple MacBook Pro 16 2023 M3 Max Apple M3 Max 16-Core | 3401 (3260min - 3401max) Points +28% |
| MSI Stealth 16 Mercedes-AMG Motorsport A13VG Intel Core i9-13900H | 3026 (1537.87min - 3026.18max) Points +14% |
| Lenovo Legion Pro 5 16ARX8 AMD Ryzen 7 7745HX | 2978 (2861.03min - 2977.96max) Points +12% |
| Lenovo ThinkPad Z16 Gen 2 AMD Ryzen 9 PRO 7940HS | 2718 (2534.21min - 2717.95max) Points +2% |
| Average AMD Ryzen 9 7940HS (2470 - 2848, n=12) | 2660 Points 0% |
| Framework Laptop 16 AMD Ryzen 9 7940HS | 2653 (2587.82min - 2652.52max) Points |
| Lenovo Legion Slim 7 16APH8 AMD Ryzen 7 7840HS | 2564 (2422.77min - 2563.77max) Points -3% |
| Dell Inspiron 16 Plus 7630 Intel Core i7-13700H | 2421 (1806.77min - 2421.45max) Points -9% |
| MSI Prestige 16 B1MG-001US Intel Core Ultra 7 155H | 2362 (2208.24min - 2361.97max) Points -11% |
| HP Spectre x360 2-in-1 16-f1075ng Intel Core i7-12700H | 2080 Points -22% |
| Acer Swift Edge SFE16-42-R1GM AMD Ryzen 7 7735U | 1698 Points -36% |
| Cinebench R15 / CPU Single 64Bit | |
| Asus Zephyrus Duo 16 GX650PY-NM006W AMD Ryzen 9 7945HX | 307 Points +11% |
| Alienware m16 R1 AMD AMD Ryzen 9 7845HX | 295 Points +6% |
| Lenovo Legion Pro 5 16ARX8 AMD Ryzen 7 7745HX | 294 Points +6% |
| Asus Vivobook Pro 16X K6604JV-MX016W Intel Core i9-13980HX | 289 Points +4% |
| Average AMD Ryzen 9 7940HS (258 - 288, n=12) | 281 Points +1% |
| MSI Stealth 16 Mercedes-AMG Motorsport A13VG Intel Core i9-13900H | 280 Points +1% |
| Lenovo ThinkPad Z16 Gen 2 AMD Ryzen 9 PRO 7940HS | 280 Points +1% |
| Framework Laptop 16 AMD Ryzen 9 7940HS | 277 Points |
| Lenovo Legion Slim 7 16APH8 AMD Ryzen 7 7840HS | 273 Points -1% |
| Apple MacBook Pro 16 2023 M3 Max Apple M3 Max 16-Core | 269 Points -3% |
| Dell Inspiron 16 Plus 7630 Intel Core i7-13700H | 265 Points -4% |
| HP Spectre x360 2-in-1 16-f1075ng Intel Core i7-12700H | 262 Points -5% |
| MSI Prestige 16 B1MG-001US Intel Core Ultra 7 155H | 257 Points -7% |
| Acer Swift Edge SFE16-42-R1GM AMD Ryzen 7 7735U | 234 Points -16% |
| Blender / v2.79 BMW27 CPU | |
| Acer Swift Edge SFE16-42-R1GM AMD Ryzen 7 7735U | 308 Seconds * -58% |
| HP Spectre x360 2-in-1 16-f1075ng Intel Core i7-12700H | 273 Seconds * -40% |
| MSI Stealth 16 Mercedes-AMG Motorsport A13VG Intel Core i9-13900H | 231 Seconds * -18% |
| Dell Inspiron 16 Plus 7630 Intel Core i7-13700H | 221 Seconds * -13% |
| Apple MacBook Pro 16 2023 M3 Max Apple M3 Max 16-Core | 215 Seconds * -10% |
| MSI Prestige 16 B1MG-001US Intel Core Ultra 7 155H | 214 Seconds * -10% |
| Lenovo Legion Slim 7 16APH8 AMD Ryzen 7 7840HS | 195 Seconds * -0% |
| Framework Laptop 16 AMD Ryzen 9 7940HS | 195 Seconds * |
| Average AMD Ryzen 9 7940HS (182 - 202, n=11) | 192.5 Seconds * +1% |
| Lenovo ThinkPad Z16 Gen 2 AMD Ryzen 9 PRO 7940HS | 191 Seconds * +2% |
| Lenovo Legion Pro 5 16ARX8 AMD Ryzen 7 7745HX | 174 Seconds * +11% |
| Asus Vivobook Pro 16X K6604JV-MX016W Intel Core i9-13980HX | 136 Seconds * +30% |
| Alienware m16 R1 AMD AMD Ryzen 9 7845HX | 117 Seconds * +40% |
| Asus Zephyrus Duo 16 GX650PY-NM006W AMD Ryzen 9 7945HX | 93 Seconds * +52% |
| 7-Zip 18.03 / 7z b 4 | |
| Asus Zephyrus Duo 16 GX650PY-NM006W AMD Ryzen 9 7945HX | 135927 MIPS +90% |
| Alienware m16 R1 AMD AMD Ryzen 9 7845HX | 106033 MIPS +48% |
| Asus Vivobook Pro 16X K6604JV-MX016W Intel Core i9-13980HX | 104616 MIPS +46% |
| Lenovo Legion Pro 5 16ARX8 AMD Ryzen 7 7745HX | 75557 MIPS +6% |
| Framework Laptop 16 AMD Ryzen 9 7940HS | 71464 MIPS |
| Lenovo Legion Slim 7 16APH8 AMD Ryzen 7 7840HS | 70243 MIPS -2% |
| Average AMD Ryzen 9 7940HS (63459 - 73434, n=12) | 70189 MIPS -2% |
| Lenovo ThinkPad Z16 Gen 2 AMD Ryzen 9 PRO 7940HS | 67813 MIPS -5% |
| MSI Prestige 16 B1MG-001US Intel Core Ultra 7 155H | 64527 MIPS -10% |
| Dell Inspiron 16 Plus 7630 Intel Core i7-13700H | 59433 MIPS -17% |
| MSI Stealth 16 Mercedes-AMG Motorsport A13VG Intel Core i9-13900H | 57625 MIPS -19% |
| Acer Swift Edge SFE16-42-R1GM AMD Ryzen 7 7735U | 48972 MIPS -31% |
| HP Spectre x360 2-in-1 16-f1075ng Intel Core i7-12700H | 46548 MIPS -35% |
| 7-Zip 18.03 / 7z b 4 -mmt1 | |
| Asus Zephyrus Duo 16 GX650PY-NM006W AMD Ryzen 9 7945HX | 7319 MIPS +11% |
| Lenovo Legion Pro 5 16ARX8 AMD Ryzen 7 7745HX | 7244 MIPS +10% |
| Alienware m16 R1 AMD AMD Ryzen 9 7845HX | 7018 MIPS +6% |
| Asus Vivobook Pro 16X K6604JV-MX016W Intel Core i9-13980HX | 6972 MIPS +6% |
| Average AMD Ryzen 9 7940HS (6310 - 6776, n=12) | 6615 MIPS 0% |
| Lenovo Legion Slim 7 16APH8 AMD Ryzen 7 7840HS | 6604 MIPS 0% |
| Framework Laptop 16 AMD Ryzen 9 7940HS | 6599 MIPS |
| MSI Stealth 16 Mercedes-AMG Motorsport A13VG Intel Core i9-13900H | 6305 MIPS -4% |
| Lenovo ThinkPad Z16 Gen 2 AMD Ryzen 9 PRO 7940HS | 6215 MIPS -6% |
| HP Spectre x360 2-in-1 16-f1075ng Intel Core i7-12700H | 5897 MIPS -11% |
| Dell Inspiron 16 Plus 7630 Intel Core i7-13700H | 5703 MIPS -14% |
| Acer Swift Edge SFE16-42-R1GM AMD Ryzen 7 7735U | 5579 MIPS -15% |
| MSI Prestige 16 B1MG-001US Intel Core Ultra 7 155H | 5291 MIPS -20% |
| Geekbench 5.5 / Multi-Core | |
| Apple MacBook Pro 16 2023 M3 Max Apple M3 Max 16-Core | 22816 Points +84% |
| Asus Zephyrus Duo 16 GX650PY-NM006W AMD Ryzen 9 7945HX | 19583 Points +58% |
| Asus Vivobook Pro 16X K6604JV-MX016W Intel Core i9-13980HX | 18475 Points +49% |
| Alienware m16 R1 AMD AMD Ryzen 9 7845HX | 15068 Points +22% |
| Dell Inspiron 16 Plus 7630 Intel Core i7-13700H | 12805 Points +3% |
| MSI Prestige 16 B1MG-001US Intel Core Ultra 7 155H | 12499 Points +1% |
| Framework Laptop 16 AMD Ryzen 9 7940HS | 12379 Points |
| Lenovo Legion Pro 5 16ARX8 AMD Ryzen 7 7745HX | 12378 Points 0% |
| Lenovo ThinkPad Z16 Gen 2 AMD Ryzen 9 PRO 7940HS | 12038 Points -3% |
| Lenovo Legion Slim 7 16APH8 AMD Ryzen 7 7840HS | 11872 Points -4% |
| Average AMD Ryzen 9 7940HS (10089 - 12500, n=13) | 11789 Points -5% |
| MSI Stealth 16 Mercedes-AMG Motorsport A13VG Intel Core i9-13900H | 10600 Points -14% |
| HP Spectre x360 2-in-1 16-f1075ng Intel Core i7-12700H | 8946 Points -28% |
| Acer Swift Edge SFE16-42-R1GM AMD Ryzen 7 7735U | 8203 Points -34% |
| Geekbench 5.5 / Single-Core | |
| Apple MacBook Pro 16 2023 M3 Max Apple M3 Max 16-Core | 2331 Points +19% |
| Asus Zephyrus Duo 16 GX650PY-NM006W AMD Ryzen 9 7945HX | 2132 Points +9% |
| Lenovo Legion Pro 5 16ARX8 AMD Ryzen 7 7745HX | 2040 Points +4% |
| Alienware m16 R1 AMD AMD Ryzen 9 7845HX | 2008 Points +2% |
| Asus Vivobook Pro 16X K6604JV-MX016W Intel Core i9-13980HX | 2001 Points +2% |
| MSI Stealth 16 Mercedes-AMG Motorsport A13VG Intel Core i9-13900H | 1986 Points +1% |
| Average AMD Ryzen 9 7940HS (1823 - 2032, n=13) | 1979 Points +1% |
| Framework Laptop 16 AMD Ryzen 9 7940HS | 1963 Points |
| Lenovo ThinkPad Z16 Gen 2 AMD Ryzen 9 PRO 7940HS | 1956 Points 0% |
| Lenovo Legion Slim 7 16APH8 AMD Ryzen 7 7840HS | 1943 Points -1% |
| Dell Inspiron 16 Plus 7630 Intel Core i7-13700H | 1906 Points -3% |
| HP Spectre x360 2-in-1 16-f1075ng Intel Core i7-12700H | 1754 Points -11% |
| MSI Prestige 16 B1MG-001US Intel Core Ultra 7 155H | 1749 Points -11% |
| Acer Swift Edge SFE16-42-R1GM AMD Ryzen 7 7735U | 1522 Points -22% |
| HWBOT x265 Benchmark v2.2 / 4k Preset | |
| Asus Zephyrus Duo 16 GX650PY-NM006W AMD Ryzen 9 7945HX | 34.8 fps +66% |
| Alienware m16 R1 AMD AMD Ryzen 9 7845HX | 29.7 fps +41% |
| Asus Vivobook Pro 16X K6604JV-MX016W Intel Core i9-13980HX | 27 fps +29% |
| Lenovo Legion Pro 5 16ARX8 AMD Ryzen 7 7745HX | 23.2 fps +10% |
| Framework Laptop 16 AMD Ryzen 9 7940HS | 21 fps |
| Average AMD Ryzen 9 7940HS (18.5 - 22.6, n=11) | 20.9 fps 0% |
| Lenovo ThinkPad Z16 Gen 2 AMD Ryzen 9 PRO 7940HS | 20.4 fps -3% |
| Lenovo Legion Slim 7 16APH8 AMD Ryzen 7 7840HS | 20.1 fps -4% |
| MSI Prestige 16 B1MG-001US Intel Core Ultra 7 155H | 16.9 fps -20% |
| Dell Inspiron 16 Plus 7630 Intel Core i7-13700H | 15.9 fps -24% |
| MSI Stealth 16 Mercedes-AMG Motorsport A13VG Intel Core i9-13900H | 14.7 fps -30% |
| HP Spectre x360 2-in-1 16-f1075ng Intel Core i7-12700H | 13.4 fps -36% |
| Acer Swift Edge SFE16-42-R1GM AMD Ryzen 7 7735U | 12.5 fps -40% |
| LibreOffice / 20 Documents To PDF | |
| Lenovo Legion Slim 7 16APH8 AMD Ryzen 7 7840HS | 68.3 s * -57% |
| Asus Zephyrus Duo 16 GX650PY-NM006W AMD Ryzen 9 7945HX | 60.4 s * -39% |
| Acer Swift Edge SFE16-42-R1GM AMD Ryzen 7 7735U | 59.7 s * -37% |
| MSI Stealth 16 Mercedes-AMG Motorsport A13VG Intel Core i9-13900H | 57.5 s * -32% |
| Asus Vivobook Pro 16X K6604JV-MX016W Intel Core i9-13980HX | 51.4 s * -18% |
| MSI Prestige 16 B1MG-001US Intel Core Ultra 7 155H | 46.9 s * -8% |
| Lenovo ThinkPad Z16 Gen 2 AMD Ryzen 9 PRO 7940HS | 46.1 s * -6% |
| Average AMD Ryzen 9 7940HS (36.9 - 54.8, n=12) | 45.9 s * -5% |
| Dell Inspiron 16 Plus 7630 Intel Core i7-13700H | 45.1 s * -3% |
| Framework Laptop 16 AMD Ryzen 9 7940HS | 43.6 s * |
| HP Spectre x360 2-in-1 16-f1075ng Intel Core i7-12700H | 42 s * +4% |
| Alienware m16 R1 AMD AMD Ryzen 9 7845HX | 39.4 s * +10% |
| Lenovo Legion Pro 5 16ARX8 AMD Ryzen 7 7745HX | 37.9 s * +13% |
| R Benchmark 2.5 / Overall mean | |
| Acer Swift Edge SFE16-42-R1GM AMD Ryzen 7 7735U | 0.51 sec * -14% |
| MSI Prestige 16 B1MG-001US Intel Core Ultra 7 155H | 0.4723 sec * -6% |
| HP Spectre x360 2-in-1 16-f1075ng Intel Core i7-12700H | 0.4632 sec * -4% |
| Lenovo ThinkPad Z16 Gen 2 AMD Ryzen 9 PRO 7940HS | 0.4514 sec * -1% |
| Framework Laptop 16 AMD Ryzen 9 7940HS | 0.4467 sec * |
| Lenovo Legion Slim 7 16APH8 AMD Ryzen 7 7840HS | 0.4431 sec * +1% |
| Dell Inspiron 16 Plus 7630 Intel Core i7-13700H | 0.4338 sec * +3% |
| Average AMD Ryzen 9 7940HS (0.4159 - 0.4467, n=12) | 0.4307 sec * +4% |
| MSI Stealth 16 Mercedes-AMG Motorsport A13VG Intel Core i9-13900H | 0.4303 sec * +4% |
| Alienware m16 R1 AMD AMD Ryzen 9 7845HX | 0.4255 sec * +5% |
| Lenovo Legion Pro 5 16ARX8 AMD Ryzen 7 7745HX | 0.421 sec * +6% |
| Asus Vivobook Pro 16X K6604JV-MX016W Intel Core i9-13980HX | 0.4041 sec * +10% |
| Asus Zephyrus Duo 16 GX650PY-NM006W AMD Ryzen 9 7945HX | 0.3982 sec * +11% |
* ... smaller is better
Cinebench R15 CPU Multi 64Bit
2653 Points
Cinebench R15 OpenGL 64Bit
282 fps
Cinebench R15 Ref. Match 64Bit
97.9 %
Cinebench R15 CPU Single 64Bit
277 Points
Cinebench R20 CPU (Multi Core)
6402 Points
Cinebench R20 CPU (Single Core)
680 Points
Cinebench R23 Single Core
1733 Points
Cinebench R23 Multi Core
16519 Points
Cinebench 2024 CPU Multi Core
953 Points
Cinebench 2024 CPU Single Core
104.5 Points
Help
| Performance rating | |
| Framework Laptop 16 AMD Ryzen 9 7940HS, Radeon RX 7700S | 95.3 pt |
| Average AMD Ryzen 9 7940HS | 93.7 pt |
| Lenovo ThinkPad Z16 Gen 2 AMD Ryzen 9 PRO 7940HS, Radeon RX 6550M | 93.4 pt |
| MSI Prestige 16 B1MG-001US Intel Core Ultra 7 155H, Arc 8-Core | 69.7 pt |
| Dell Inspiron 16 Plus 7630 Intel Core i7-13700H, GeForce RTX 4060 Laptop GPU | 61.2 pt |
| HP Spectre x360 2-in-1 16-f1075ng Intel Core i7-12700H, Iris Xe G7 96EUs | 52.4 pt |
| AIDA64 / FP32 Ray-Trace | |
| Lenovo ThinkPad Z16 Gen 2 AMD Ryzen 9 PRO 7940HS, Radeon RX 6550M | 27411 KRay/s +2% |
| Framework Laptop 16 AMD Ryzen 9 7940HS, Radeon RX 7700S | 26844 KRay/s |
| Average AMD Ryzen 9 7940HS (25226 - 29109, n=10) | 26840 KRay/s 0% |
| MSI Prestige 16 B1MG-001US Intel Core Ultra 7 155H, Arc 8-Core | 15218 KRay/s -43% |
| Dell Inspiron 16 Plus 7630 Intel Core i7-13700H, GeForce RTX 4060 Laptop GPU | 13648 KRay/s -49% |
| HP Spectre x360 2-in-1 16-f1075ng Intel Core i7-12700H, Iris Xe G7 96EUs | 11101 KRay/s -59% |
| AIDA64 / FPU Julia | |
| Lenovo ThinkPad Z16 Gen 2 AMD Ryzen 9 PRO 7940HS, Radeon RX 6550M | 116960 Points +4% |
| Average AMD Ryzen 9 7940HS (106512 - 123214, n=10) | 115052 Points +2% |
| Framework Laptop 16 AMD Ryzen 9 7940HS, Radeon RX 7700S | 112922 Points |
| MSI Prestige 16 B1MG-001US Intel Core Ultra 7 155H, Arc 8-Core | 78381 Points -31% |
| Dell Inspiron 16 Plus 7630 Intel Core i7-13700H, GeForce RTX 4060 Laptop GPU | 68323 Points -39% |
| HP Spectre x360 2-in-1 16-f1075ng Intel Core i7-12700H, Iris Xe G7 96EUs | 56729 Points -50% |
| AIDA64 / CPU SHA3 | |
| Lenovo ThinkPad Z16 Gen 2 AMD Ryzen 9 PRO 7940HS, Radeon RX 6550M | 4944 MB/s 0% |
| Framework Laptop 16 AMD Ryzen 9 7940HS, Radeon RX 7700S | 4927 MB/s |
| Average AMD Ryzen 9 7940HS (4566 - 5119, n=10) | 4880 MB/s -1% |
| MSI Prestige 16 B1MG-001US Intel Core Ultra 7 155H, Arc 8-Core | 3616 MB/s -27% |
| Dell Inspiron 16 Plus 7630 Intel Core i7-13700H, GeForce RTX 4060 Laptop GPU | 3029 MB/s -39% |
| HP Spectre x360 2-in-1 16-f1075ng Intel Core i7-12700H, Iris Xe G7 96EUs | 2646 MB/s -46% |
| AIDA64 / CPU Queen | |
| Lenovo ThinkPad Z16 Gen 2 AMD Ryzen 9 PRO 7940HS, Radeon RX 6550M | 124565 Points +3% |
| Framework Laptop 16 AMD Ryzen 9 7940HS, Radeon RX 7700S | 121264 Points |
| Average AMD Ryzen 9 7940HS (118174 - 124783, n=10) | 120771 Points 0% |
| Dell Inspiron 16 Plus 7630 Intel Core i7-13700H, GeForce RTX 4060 Laptop GPU | 105205 Points -13% |
| MSI Prestige 16 B1MG-001US Intel Core Ultra 7 155H, Arc 8-Core | 93266 Points -23% |
| HP Spectre x360 2-in-1 16-f1075ng Intel Core i7-12700H, Iris Xe G7 96EUs | 90576 Points -25% |
| AIDA64 / FPU SinJulia | |
| Lenovo ThinkPad Z16 Gen 2 AMD Ryzen 9 PRO 7940HS, Radeon RX 6550M | 15304 Points +2% |
| Average AMD Ryzen 9 7940HS (14663 - 15551, n=10) | 15128 Points +1% |
| Framework Laptop 16 AMD Ryzen 9 7940HS, Radeon RX 7700S | 14935 Points |
| MSI Prestige 16 B1MG-001US Intel Core Ultra 7 155H, Arc 8-Core | 10170 Points -32% |
| Dell Inspiron 16 Plus 7630 Intel Core i7-13700H, GeForce RTX 4060 Laptop GPU | 8930 Points -40% |
| HP Spectre x360 2-in-1 16-f1075ng Intel Core i7-12700H, Iris Xe G7 96EUs | 7714 Points -48% |
| AIDA64 / FPU Mandel | |
| Lenovo ThinkPad Z16 Gen 2 AMD Ryzen 9 PRO 7940HS, Radeon RX 6550M | 62357 Points +3% |
| Average AMD Ryzen 9 7940HS (56839 - 66238, n=10) | 61343 Points +1% |
| Framework Laptop 16 AMD Ryzen 9 7940HS, Radeon RX 7700S | 60474 Points |
| MSI Prestige 16 B1MG-001US Intel Core Ultra 7 155H, Arc 8-Core | 38412 Points -36% |
| Dell Inspiron 16 Plus 7630 Intel Core i7-13700H, GeForce RTX 4060 Laptop GPU | 33737 Points -44% |
| HP Spectre x360 2-in-1 16-f1075ng Intel Core i7-12700H, Iris Xe G7 96EUs | 27800 Points -54% |
| AIDA64 / CPU AES | |
| Framework Laptop 16 AMD Ryzen 9 7940HS, Radeon RX 7700S | 169946 MB/s |
| Average AMD Ryzen 9 7940HS (86309 - 171350, n=10) | 128235 MB/s -25% |
| HP Spectre x360 2-in-1 16-f1075ng Intel Core i7-12700H, Iris Xe G7 96EUs | 101332 MB/s -40% |
| Lenovo ThinkPad Z16 Gen 2 AMD Ryzen 9 PRO 7940HS, Radeon RX 6550M | 88705 MB/s -48% |
| MSI Prestige 16 B1MG-001US Intel Core Ultra 7 155H, Arc 8-Core | 76481 MB/s -55% |
| Dell Inspiron 16 Plus 7630 Intel Core i7-13700H, GeForce RTX 4060 Laptop GPU | 63127 MB/s -63% |
| AIDA64 / CPU ZLib | |
| Lenovo ThinkPad Z16 Gen 2 AMD Ryzen 9 PRO 7940HS, Radeon RX 6550M | 1079 MB/s +25% |
| Average AMD Ryzen 9 7940HS (866 - 1152, n=10) | 1063 MB/s +23% |
| MSI Prestige 16 B1MG-001US Intel Core Ultra 7 155H, Arc 8-Core | 1058 MB/s +22% |
| Framework Laptop 16 AMD Ryzen 9 7940HS, Radeon RX 7700S | 866 MB/s |
| Dell Inspiron 16 Plus 7630 Intel Core i7-13700H, GeForce RTX 4060 Laptop GPU | 829 MB/s -4% |
| HP Spectre x360 2-in-1 16-f1075ng Intel Core i7-12700H, Iris Xe G7 96EUs | 752 MB/s -13% |
| AIDA64 / FP64 Ray-Trace | |
| Lenovo ThinkPad Z16 Gen 2 AMD Ryzen 9 PRO 7940HS, Radeon RX 6550M | 14590 KRay/s +3% |
| Average AMD Ryzen 9 7940HS (13175 - 15675, n=10) | 14397 KRay/s +1% |
| Framework Laptop 16 AMD Ryzen 9 7940HS, Radeon RX 7700S | 14231 KRay/s |
| MSI Prestige 16 B1MG-001US Intel Core Ultra 7 155H, Arc 8-Core | 8102 KRay/s -43% |
| Dell Inspiron 16 Plus 7630 Intel Core i7-13700H, GeForce RTX 4060 Laptop GPU | 7318 KRay/s -49% |
| HP Spectre x360 2-in-1 16-f1075ng Intel Core i7-12700H, Iris Xe G7 96EUs | 5896 KRay/s -59% |
| AIDA64 / CPU PhotoWorxx | |
| MSI Prestige 16 B1MG-001US Intel Core Ultra 7 155H, Arc 8-Core | 46208 MPixel/s +13% |
| Framework Laptop 16 AMD Ryzen 9 7940HS, Radeon RX 7700S | 41024 MPixel/s |
| Dell Inspiron 16 Plus 7630 Intel Core i7-13700H, GeForce RTX 4060 Laptop GPU | 37857 MPixel/s -8% |
| Lenovo ThinkPad Z16 Gen 2 AMD Ryzen 9 PRO 7940HS, Radeon RX 6550M | 37800 MPixel/s -8% |
| Average AMD Ryzen 9 7940HS (22477 - 41567, n=10) | 34649 MPixel/s -16% |
| HP Spectre x360 2-in-1 16-f1075ng Intel Core i7-12700H, Iris Xe G7 96EUs | 20213 MPixel/s -51% |
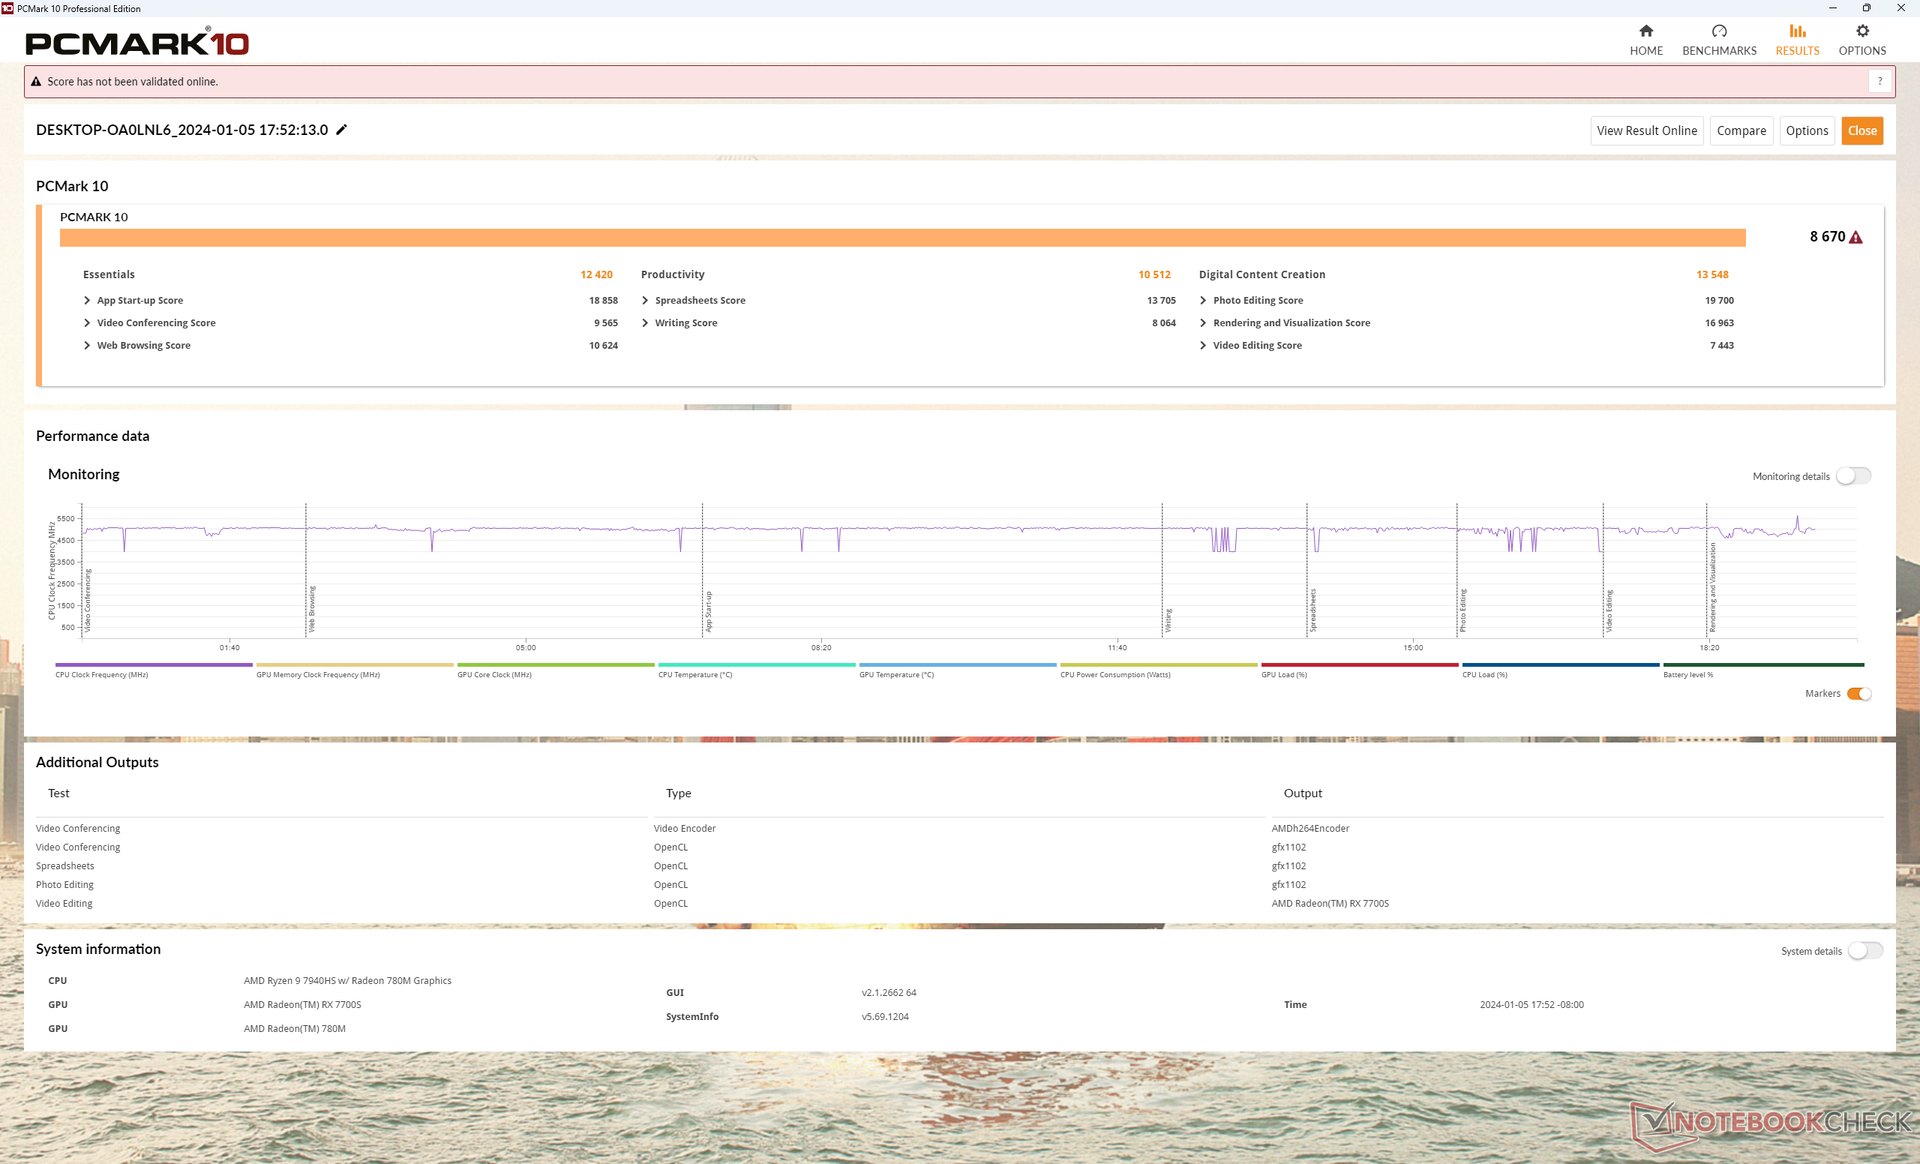
PCMark 10 scores are some of the highest of any 16-inch multimedia laptop owing to the fast Ryzen 9 Zen 4 CPU and associated Radeon graphics. High PCMark scores show that the Framework 16 can be just as speedy as other high-performance laptops when running daily tasks ranging from browsers to graphics editors.
| PCMark 10 / Score | |
| Framework Laptop 16 Radeon RX 7700S, R9 7940HS, WDC PC SN810 1TB | 8670 Points |
| Average AMD Ryzen 9 7940HS, AMD Radeon RX 7700S (n=1) | 8670 Points 0% |
| Lenovo ThinkPad Z16 Gen 2 Radeon RX 6550M, R9 PRO 7940HS, Kioxia XG8 KXG8AZNV1T02 | 7777 Points -10% |
| Dell Inspiron 16 Plus 7630 GeForce RTX 4060 Laptop GPU, i7-13700H, WD PC SN740 SDDPTQD-1T00 | 7661 Points -12% |
| MSI Prestige 16 B1MG-001US Arc 8-Core, Ultra 7 155H, Samsung PM9A1 MZVL22T0HBLB | 7033 Points -19% |
| HP Spectre x360 2-in-1 16-f1075ng Iris Xe G7 96EUs, i7-12700H, SK Hynix PC711 1TB HFS001TDE9X073N | 5904 Points -32% |
| PCMark 10 / Essentials | |
| Framework Laptop 16 Radeon RX 7700S, R9 7940HS, WDC PC SN810 1TB | 12420 Points |
| Average AMD Ryzen 9 7940HS, AMD Radeon RX 7700S (n=1) | 12420 Points 0% |
| Lenovo ThinkPad Z16 Gen 2 Radeon RX 6550M, R9 PRO 7940HS, Kioxia XG8 KXG8AZNV1T02 | 11483 Points -8% |
| Dell Inspiron 16 Plus 7630 GeForce RTX 4060 Laptop GPU, i7-13700H, WD PC SN740 SDDPTQD-1T00 | 11200 Points -10% |
| MSI Prestige 16 B1MG-001US Arc 8-Core, Ultra 7 155H, Samsung PM9A1 MZVL22T0HBLB | 11156 Points -10% |
| HP Spectre x360 2-in-1 16-f1075ng Iris Xe G7 96EUs, i7-12700H, SK Hynix PC711 1TB HFS001TDE9X073N | 10825 Points -13% |
| PCMark 10 / Productivity | |
| Framework Laptop 16 Radeon RX 7700S, R9 7940HS, WDC PC SN810 1TB | 10512 Points |
| Average AMD Ryzen 9 7940HS, AMD Radeon RX 7700S (n=1) | 10512 Points 0% |
| Lenovo ThinkPad Z16 Gen 2 Radeon RX 6550M, R9 PRO 7940HS, Kioxia XG8 KXG8AZNV1T02 | 10046 Points -4% |
| Dell Inspiron 16 Plus 7630 GeForce RTX 4060 Laptop GPU, i7-13700H, WD PC SN740 SDDPTQD-1T00 | 9394 Points -11% |
| MSI Prestige 16 B1MG-001US Arc 8-Core, Ultra 7 155H, Samsung PM9A1 MZVL22T0HBLB | 8705 Points -17% |
| HP Spectre x360 2-in-1 16-f1075ng Iris Xe G7 96EUs, i7-12700H, SK Hynix PC711 1TB HFS001TDE9X073N | 7239 Points -31% |
| PCMark 10 / Digital Content Creation | |
| Framework Laptop 16 Radeon RX 7700S, R9 7940HS, WDC PC SN810 1TB | 13548 Points |
| Average AMD Ryzen 9 7940HS, AMD Radeon RX 7700S (n=1) | 13548 Points 0% |
| Dell Inspiron 16 Plus 7630 GeForce RTX 4060 Laptop GPU, i7-13700H, WD PC SN740 SDDPTQD-1T00 | 11598 Points -14% |
| Lenovo ThinkPad Z16 Gen 2 Radeon RX 6550M, R9 PRO 7940HS, Kioxia XG8 KXG8AZNV1T02 | 11064 Points -18% |
| MSI Prestige 16 B1MG-001US Arc 8-Core, Ultra 7 155H, Samsung PM9A1 MZVL22T0HBLB | 9720 Points -28% |
| HP Spectre x360 2-in-1 16-f1075ng Iris Xe G7 96EUs, i7-12700H, SK Hynix PC711 1TB HFS001TDE9X073N | 7127 Points -47% |
| CrossMark / Overall | |
| Apple MacBook Pro 16 2023 M3 Max M3 Max 40-Core GPU, Apple M3 Max 16-Core, Apple SSD AP8192Z | 2051 Points +23% |
| Dell Inspiron 16 Plus 7630 GeForce RTX 4060 Laptop GPU, i7-13700H, WD PC SN740 SDDPTQD-1T00 | 1849 Points +10% |
| MSI Prestige 16 B1MG-001US Arc 8-Core, Ultra 7 155H, Samsung PM9A1 MZVL22T0HBLB | 1769 Points +6% |
| HP Spectre x360 2-in-1 16-f1075ng Iris Xe G7 96EUs, i7-12700H, SK Hynix PC711 1TB HFS001TDE9X073N | 1701 Points +2% |
| Framework Laptop 16 Radeon RX 7700S, R9 7940HS, WDC PC SN810 1TB | 1674 Points |
| Average AMD Ryzen 9 7940HS, AMD Radeon RX 7700S (n=1) | 1674 Points 0% |
| Lenovo ThinkPad Z16 Gen 2 Radeon RX 6550M, R9 PRO 7940HS, Kioxia XG8 KXG8AZNV1T02 | 1555 Points -7% |
| CrossMark / Productivity | |
| Apple MacBook Pro 16 2023 M3 Max M3 Max 40-Core GPU, Apple M3 Max 16-Core, Apple SSD AP8192Z | 1828 Points +15% |
| Dell Inspiron 16 Plus 7630 GeForce RTX 4060 Laptop GPU, i7-13700H, WD PC SN740 SDDPTQD-1T00 | 1743 Points +10% |
| HP Spectre x360 2-in-1 16-f1075ng Iris Xe G7 96EUs, i7-12700H, SK Hynix PC711 1TB HFS001TDE9X073N | 1717 Points +8% |
| MSI Prestige 16 B1MG-001US Arc 8-Core, Ultra 7 155H, Samsung PM9A1 MZVL22T0HBLB | 1693 Points +7% |
| Framework Laptop 16 Radeon RX 7700S, R9 7940HS, WDC PC SN810 1TB | 1583 Points |
| Average AMD Ryzen 9 7940HS, AMD Radeon RX 7700S (n=1) | 1583 Points 0% |
| Lenovo ThinkPad Z16 Gen 2 Radeon RX 6550M, R9 PRO 7940HS, Kioxia XG8 KXG8AZNV1T02 | 1488 Points -6% |
| CrossMark / Creativity | |
| Apple MacBook Pro 16 2023 M3 Max M3 Max 40-Core GPU, Apple M3 Max 16-Core, Apple SSD AP8192Z | 2564 Points +37% |
| Dell Inspiron 16 Plus 7630 GeForce RTX 4060 Laptop GPU, i7-13700H, WD PC SN740 SDDPTQD-1T00 | 2064 Points +11% |
| MSI Prestige 16 B1MG-001US Arc 8-Core, Ultra 7 155H, Samsung PM9A1 MZVL22T0HBLB | 1928 Points +3% |
| Framework Laptop 16 Radeon RX 7700S, R9 7940HS, WDC PC SN810 1TB | 1866 Points |
| Average AMD Ryzen 9 7940HS, AMD Radeon RX 7700S (n=1) | 1866 Points 0% |
| Lenovo ThinkPad Z16 Gen 2 Radeon RX 6550M, R9 PRO 7940HS, Kioxia XG8 KXG8AZNV1T02 | 1714 Points -8% |
| HP Spectre x360 2-in-1 16-f1075ng Iris Xe G7 96EUs, i7-12700H, SK Hynix PC711 1TB HFS001TDE9X073N | 1655 Points -11% |
| CrossMark / Responsiveness | |
| HP Spectre x360 2-in-1 16-f1075ng Iris Xe G7 96EUs, i7-12700H, SK Hynix PC711 1TB HFS001TDE9X073N | 1799 Points +26% |
| Dell Inspiron 16 Plus 7630 GeForce RTX 4060 Laptop GPU, i7-13700H, WD PC SN740 SDDPTQD-1T00 | 1589 Points +11% |
| MSI Prestige 16 B1MG-001US Arc 8-Core, Ultra 7 155H, Samsung PM9A1 MZVL22T0HBLB | 1556 Points +9% |
| Apple MacBook Pro 16 2023 M3 Max M3 Max 40-Core GPU, Apple M3 Max 16-Core, Apple SSD AP8192Z | 1486 Points +4% |
| Framework Laptop 16 Radeon RX 7700S, R9 7940HS, WDC PC SN810 1TB | 1429 Points |
| Average AMD Ryzen 9 7940HS, AMD Radeon RX 7700S (n=1) | 1429 Points 0% |
| Lenovo ThinkPad Z16 Gen 2 Radeon RX 6550M, R9 PRO 7940HS, Kioxia XG8 KXG8AZNV1T02 | 1325 Points -7% |
| WebXPRT 3 / Overall | |
| Apple MacBook Pro 16 2023 M3 Max M3 Max 40-Core GPU, Apple M3 Max 16-Core, Apple SSD AP8192Z | 426 Points +22% |
| Framework Laptop 16 Radeon RX 7700S, R9 7940HS, WDC PC SN810 1TB | 349 Points |
| Average AMD Ryzen 9 7940HS, AMD Radeon RX 7700S (n=1) | 349 Points 0% |
| Lenovo ThinkPad Z16 Gen 2 Radeon RX 6550M, R9 PRO 7940HS, Kioxia XG8 KXG8AZNV1T02 | 315 Points -10% |
| Dell Inspiron 16 Plus 7630 GeForce RTX 4060 Laptop GPU, i7-13700H, WD PC SN740 SDDPTQD-1T00 | 314 Points -10% |
| MSI Prestige 16 B1MG-001US Arc 8-Core, Ultra 7 155H, Samsung PM9A1 MZVL22T0HBLB | 299 Points -14% |
| HP Spectre x360 2-in-1 16-f1075ng Iris Xe G7 96EUs, i7-12700H, SK Hynix PC711 1TB HFS001TDE9X073N | 271 Points -22% |
| WebXPRT 4 / Overall | |
| Dell Inspiron 16 Plus 7630 GeForce RTX 4060 Laptop GPU, i7-13700H, WD PC SN740 SDDPTQD-1T00 | 274 Points +3% |
| Framework Laptop 16 Radeon RX 7700S, R9 7940HS, WDC PC SN810 1TB | 265 Points |
| Average AMD Ryzen 9 7940HS, AMD Radeon RX 7700S (n=1) | 265 Points 0% |
| MSI Prestige 16 B1MG-001US Arc 8-Core, Ultra 7 155H, Samsung PM9A1 MZVL22T0HBLB | 263 Points -1% |
| Lenovo ThinkPad Z16 Gen 2 Radeon RX 6550M, R9 PRO 7940HS, Kioxia XG8 KXG8AZNV1T02 | 255 Points -4% |
| HP Spectre x360 2-in-1 16-f1075ng Iris Xe G7 96EUs, i7-12700H, SK Hynix PC711 1TB HFS001TDE9X073N | 249 Points -6% |
| Mozilla Kraken 1.1 / Total | |
| Lenovo ThinkPad Z16 Gen 2 Radeon RX 6550M, R9 PRO 7940HS, Kioxia XG8 KXG8AZNV1T02 | 546 ms * -11% |
| MSI Prestige 16 B1MG-001US Arc 8-Core, Ultra 7 155H, Samsung PM9A1 MZVL22T0HBLB | 525 ms * -7% |
| HP Spectre x360 2-in-1 16-f1075ng Iris Xe G7 96EUs, i7-12700H, SK Hynix PC711 1TB HFS001TDE9X073N | 524 ms * -7% |
| Dell Inspiron 16 Plus 7630 GeForce RTX 4060 Laptop GPU, i7-13700H, WD PC SN740 SDDPTQD-1T00 | 500 ms * -2% |
| Framework Laptop 16 Radeon RX 7700S, R9 7940HS, WDC PC SN810 1TB | 490 ms * |
| Average AMD Ryzen 9 7940HS, AMD Radeon RX 7700S (n=1) | 490 ms * -0% |
| Apple MacBook Pro 16 2023 M3 Max M3 Max 40-Core GPU, Apple M3 Max 16-Core, Apple SSD AP8192Z | 391.7 ms * +20% |
* ... smaller is better
| PCMark 10 Score | 8670 points | |
Help | ||
| AIDA64 / Memory Copy | |
| MSI Prestige 16 B1MG-001US Intel Core Ultra 7 155H, Arc 8-Core | 80951 MB/s +3% |
| Framework Laptop 16 AMD Ryzen 9 7940HS, Radeon RX 7700S | 78739 MB/s |
| Lenovo ThinkPad Z16 Gen 2 AMD Ryzen 9 PRO 7940HS, Radeon RX 6550M | 66740 MB/s -15% |
| Average AMD Ryzen 9 7940HS (35327 - 78739, n=10) | 63100 MB/s -20% |
| Dell Inspiron 16 Plus 7630 Intel Core i7-13700H, GeForce RTX 4060 Laptop GPU | 59555 MB/s -24% |
| HP Spectre x360 2-in-1 16-f1075ng Intel Core i7-12700H, Iris Xe G7 96EUs | 40944 MB/s -48% |
| AIDA64 / Memory Read | |
| MSI Prestige 16 B1MG-001US Intel Core Ultra 7 155H, Arc 8-Core | 75886 MB/s +23% |
| Dell Inspiron 16 Plus 7630 Intel Core i7-13700H, GeForce RTX 4060 Laptop GPU | 68066 MB/s +10% |
| Framework Laptop 16 AMD Ryzen 9 7940HS, Radeon RX 7700S | 61735 MB/s |
| Average AMD Ryzen 9 7940HS (30769 - 61836, n=10) | 57322 MB/s -7% |
| Lenovo ThinkPad Z16 Gen 2 AMD Ryzen 9 PRO 7940HS, Radeon RX 6550M | 50398 MB/s -18% |
| HP Spectre x360 2-in-1 16-f1075ng Intel Core i7-12700H, Iris Xe G7 96EUs | 43659 MB/s -29% |
| AIDA64 / Memory Write | |
| Lenovo ThinkPad Z16 Gen 2 AMD Ryzen 9 PRO 7940HS, Radeon RX 6550M | 91516 MB/s +5% |
| Framework Laptop 16 AMD Ryzen 9 7940HS, Radeon RX 7700S | 87033 MB/s |
| Average AMD Ryzen 9 7940HS (42217 - 91567, n=10) | 78417 MB/s -10% |
| MSI Prestige 16 B1MG-001US Intel Core Ultra 7 155H, Arc 8-Core | 75909 MB/s -13% |
| Dell Inspiron 16 Plus 7630 Intel Core i7-13700H, GeForce RTX 4060 Laptop GPU | 59733 MB/s -31% |
| HP Spectre x360 2-in-1 16-f1075ng Intel Core i7-12700H, Iris Xe G7 96EUs | 42999 MB/s -51% |
| AIDA64 / Memory Latency | |
| MSI Prestige 16 B1MG-001US Intel Core Ultra 7 155H, Arc 8-Core | 135.9 ns * -49% |
| Lenovo ThinkPad Z16 Gen 2 AMD Ryzen 9 PRO 7940HS, Radeon RX 6550M | 121.3 ns * -33% |
| Dell Inspiron 16 Plus 7630 Intel Core i7-13700H, GeForce RTX 4060 Laptop GPU | 93.7 ns * -3% |
| Average AMD Ryzen 9 7940HS (87.6 - 111.1, n=10) | 93 ns * -2% |
| Framework Laptop 16 AMD Ryzen 9 7940HS, Radeon RX 7700S | 91.4 ns * |
| HP Spectre x360 2-in-1 16-f1075ng Intel Core i7-12700H, Iris Xe G7 96EUs | 77.8 ns * +15% |
* ... smaller is better
LatencyMon reveals DPC issues when opening multiple browser tabs of our homepage. Additionally, we're able to record 6 dropped frames during a one-minute timespan when playing 4K60 video. Each dropped frame would occur at almost regular intervals to suggest an underlying driver issue potentially related to the AMD GPUs. In our experience, most Intel-based laptops do not suffer from similar issues and are more likely to drop no frames at all when running the same test.
| DPC Latencies / LatencyMon - interrupt to process latency (max), Web, Youtube, Prime95 | |
| Lenovo ThinkPad Z16 Gen 2 Radeon RX 6550M, R9 PRO 7940HS, Kioxia XG8 KXG8AZNV1T02 | 1253.5 μs * -8% |
| Framework Laptop 16 Radeon RX 7700S, R9 7940HS, WDC PC SN810 1TB | 1159 μs * |
| HP Spectre x360 2-in-1 16-f1075ng Iris Xe G7 96EUs, i7-12700H, SK Hynix PC711 1TB HFS001TDE9X073N | 1124.3 μs * +3% |
| Dell Inspiron 16 Plus 7630 GeForce RTX 4060 Laptop GPU, i7-13700H, WD PC SN740 SDDPTQD-1T00 | 1020.2 μs * +12% |
| MSI Prestige 16 B1MG-001US Arc 8-Core, Ultra 7 155H, Samsung PM9A1 MZVL22T0HBLB | 527.2 μs * +55% |
* ... smaller is better
Our test unit ships with the Western Digital SN810 PCIe4 x4 NVMe SSD which is an upgrade from the SN740 that's currently available on the Framework 13.5. The drive would exhibit no issues maintaining a ~7000 MB/s transfer rate for extended periods unlike what we observed on the HP Pavilion Plus 14 equipped with the very same WD SSD. This suggests that the Framework 16 was designed with better SSD cooling in mind to prevent performance throttling.
CDM 5/6 Read Seq Q32T1: 6916 MB/s
CDM 5/6 Write Seq Q32T1: 5188 MB/s
CDM 5/6 Read 4K Q32T1: 552.2 MB/s
CDM 5/6 Write 4K Q32T1: 553.2 MB/s
CDM 5 Read Seq: 3144 MB/s
CDM 5 Write Seq: 3661 MB/s
CDM 5/6 Read 4K: 59.81 MB/s
CDM 5/6 Write 4K: 130.4 MB/s
Sequential Read: 5210.14MB/s
Sequential Write: 3139.42MB/s
Access Time Read: 0.078ms
Access Time Write: 0.074ms
DiskSpd seq_q8t1_read: 6972MB/s
DiskSpd seq_q8t1_write: 5213MB/s
DiskSpd seq_read: 3713MB/s
DiskSpd seq_write: 3984MB/s
DiskSpd 4k_q32t16_read: 1754MB/s
DiskSpd 4k_q32t16_write: 636MB/s
DiskSpd 4k_q1t1_read: 67.2MB/s
DiskSpd 4k_q1t1_write: 167.4MB/s
DiskSpd Loop seq_q8t1_read: 6942MB/s
| Drive Performance rating - Percent | |
| MSI Prestige 16 B1MG-001US Samsung PM9A1 MZVL22T0HBLB | 91.1 pt |
| Average WDC PC SN810 1TB | 74.9 pt |
| Framework Laptop 16 WDC PC SN810 1TB | 66.1 pt |
| HP Spectre x360 2-in-1 16-f1075ng SK Hynix PC711 1TB HFS001TDE9X073N | 64.7 pt |
| Lenovo ThinkPad Z16 Gen 2 Kioxia XG8 KXG8AZNV1T02 | 62.2 pt |
| Dell Inspiron 16 Plus 7630 WD PC SN740 SDDPTQD-1T00 | 61.1 pt |
| DiskSpd | |
| seq read | |
| MSI Prestige 16 B1MG-001US Samsung PM9A1 MZVL22T0HBLB | 4432 (4393.32min - 4432.27max) MB/s +19% |
| Average WDC PC SN810 1TB (3265 - 4224, n=12) | 3731 MB/s 0% |
| Framework Laptop 16 WDC PC SN810 1TB | 3713 (3692.83min - 3713.34max) MB/s |
| Lenovo ThinkPad Z16 Gen 2 Kioxia XG8 KXG8AZNV1T02 | 3654 (3592.99min - 3653.69max) MB/s -2% |
| Dell Inspiron 16 Plus 7630 WD PC SN740 SDDPTQD-1T00 | 3156 (3078.2min - 3156.21max) MB/s -15% |
| HP Spectre x360 2-in-1 16-f1075ng SK Hynix PC711 1TB HFS001TDE9X073N | 2024 (1944.48min - 2024.11max) MB/s -45% |
| seq write | |
| MSI Prestige 16 B1MG-001US Samsung PM9A1 MZVL22T0HBLB | 4432 (4395.44min - 4431.7max) MB/s +11% |
| Framework Laptop 16 WDC PC SN810 1TB | 3984 (3947.47min - 3984.38max) MB/s |
| Lenovo ThinkPad Z16 Gen 2 Kioxia XG8 KXG8AZNV1T02 | 3877 (3771.73min - 3876.79max) MB/s -3% |
| Average WDC PC SN810 1TB (2767 - 5015, n=12) | 3838 MB/s -4% |
| Dell Inspiron 16 Plus 7630 WD PC SN740 SDDPTQD-1T00 | 3503 (3341.99min - 3503.29max) MB/s -12% |
| HP Spectre x360 2-in-1 16-f1075ng SK Hynix PC711 1TB HFS001TDE9X073N | 1548 (1453.93min - 1548.49max) MB/s -61% |
| seq q8 t1 read | |
| MSI Prestige 16 B1MG-001US Samsung PM9A1 MZVL22T0HBLB | 7107 (6650.61min - 7107.46max) MB/s +2% |
| Lenovo ThinkPad Z16 Gen 2 Kioxia XG8 KXG8AZNV1T02 | 7002 (6363.24min - 7002.18max) MB/s 0% |
| Framework Laptop 16 WDC PC SN810 1TB | 6972 (6567.52min - 6972.09max) MB/s |
| Average WDC PC SN810 1TB (6674 - 6984, n=12) | 6884 MB/s -1% |
| Dell Inspiron 16 Plus 7630 WD PC SN740 SDDPTQD-1T00 | 5187 (4478.95min - 5186.89max) MB/s -26% |
| HP Spectre x360 2-in-1 16-f1075ng SK Hynix PC711 1TB HFS001TDE9X073N | 3544 (2906.02min - 3543.98max) MB/s -49% |
| seq q8 t1 write | |
| Lenovo ThinkPad Z16 Gen 2 Kioxia XG8 KXG8AZNV1T02 | 5602 (5479.75min - 5601.7max) MB/s +7% |
| MSI Prestige 16 B1MG-001US Samsung PM9A1 MZVL22T0HBLB | 5249 (5168.16min - 5248.53max) MB/s +1% |
| Framework Laptop 16 WDC PC SN810 1TB | 5213 (5149.53min - 5212.74max) MB/s |
| Average WDC PC SN810 1TB (4454 - 5412, n=12) | 5121 MB/s -2% |
| Dell Inspiron 16 Plus 7630 WD PC SN740 SDDPTQD-1T00 | 4824 (4712.92min - 4824.08max) MB/s -7% |
| HP Spectre x360 2-in-1 16-f1075ng SK Hynix PC711 1TB HFS001TDE9X073N | 3250 (3167.12min - 3250.17max) MB/s -38% |
| 4k q1 t1 read | |
| MSI Prestige 16 B1MG-001US Samsung PM9A1 MZVL22T0HBLB | 81.5 (81.19min - 81.46max) MB/s +21% |
| Dell Inspiron 16 Plus 7630 WD PC SN740 SDDPTQD-1T00 | 73.2 (70.67min - 73.2max) MB/s +9% |
| Average WDC PC SN810 1TB (52.4 - 88, n=12) | 71.3 MB/s +6% |
| Framework Laptop 16 WDC PC SN810 1TB | 67.2 (66.93min - 67.19max) MB/s |
| HP Spectre x360 2-in-1 16-f1075ng SK Hynix PC711 1TB HFS001TDE9X073N | 60.8 (53.24min - 60.81max) MB/s -10% |
| Lenovo ThinkPad Z16 Gen 2 Kioxia XG8 KXG8AZNV1T02 | 57.1 (56.78min - 57.07max) MB/s -15% |
| 4k q1 t1 write | |
| MSI Prestige 16 B1MG-001US Samsung PM9A1 MZVL22T0HBLB | 202 (200.14min - 201.86max) MB/s +21% |
| Average WDC PC SN810 1TB (85 - 305, n=12) | 175.9 MB/s +5% |
| Framework Laptop 16 WDC PC SN810 1TB | 167.4 (166.73min - 167.4max) MB/s |
| Dell Inspiron 16 Plus 7630 WD PC SN740 SDDPTQD-1T00 | 158.8 (155.42min - 158.82max) MB/s -5% |
| Lenovo ThinkPad Z16 Gen 2 Kioxia XG8 KXG8AZNV1T02 | 151.4 (148.6min - 151.39max) MB/s -10% |
| HP Spectre x360 2-in-1 16-f1075ng SK Hynix PC711 1TB HFS001TDE9X073N | 133.3 (120.98min - 133.34max) MB/s -20% |
| 4k q32 t16 read | |
| MSI Prestige 16 B1MG-001US Samsung PM9A1 MZVL22T0HBLB | 3839 (3251.93min - 3838.52max) MB/s +119% |
| Framework Laptop 16 WDC PC SN810 1TB | 1754 (1748.82min - 1754.02max) MB/s |
| Average WDC PC SN810 1TB (417 - 4245, n=12) | 1460 MB/s -17% |
| Lenovo ThinkPad Z16 Gen 2 Kioxia XG8 KXG8AZNV1T02 | 1105 (1023.06min - 1104.63max) MB/s -37% |
| Dell Inspiron 16 Plus 7630 WD PC SN740 SDDPTQD-1T00 | 725 (704.24min - 724.66max) MB/s -59% |
| HP Spectre x360 2-in-1 16-f1075ng SK Hynix PC711 1TB HFS001TDE9X073N | 715 (657.06min - 714.84max) MB/s -59% |
| 4k q32 t16 write | |
| MSI Prestige 16 B1MG-001US Samsung PM9A1 MZVL22T0HBLB | 3063 (2744.16min - 3062.6max) MB/s +382% |
| Average WDC PC SN810 1TB (162.3 - 2907, n=12) | 859 MB/s +35% |
| Framework Laptop 16 WDC PC SN810 1TB | 636 (609.51min - 636.01max) MB/s |
| Dell Inspiron 16 Plus 7630 WD PC SN740 SDDPTQD-1T00 | 513 (490.37min - 513.26max) MB/s -19% |
| Lenovo ThinkPad Z16 Gen 2 Kioxia XG8 KXG8AZNV1T02 | 458 (428.82min - 457.64max) MB/s -28% |
| HP Spectre x360 2-in-1 16-f1075ng SK Hynix PC711 1TB HFS001TDE9X073N | 389 (250.92min - 389.12max) MB/s -39% |
| AS SSD | |
| Score Total | |
| MSI Prestige 16 B1MG-001US Samsung PM9A1 MZVL22T0HBLB | 7524 Points +42% |
| HP Spectre x360 2-in-1 16-f1075ng SK Hynix PC711 1TB HFS001TDE9X073N | 6585 Points +25% |
| Average WDC PC SN810 1TB (4112 - 8556, n=12) | 5834 Points +10% |
| Framework Laptop 16 WDC PC SN810 1TB | 5283 Points |
| Lenovo ThinkPad Z16 Gen 2 Kioxia XG8 KXG8AZNV1T02 | 4894 Points -7% |
| Dell Inspiron 16 Plus 7630 WD PC SN740 SDDPTQD-1T00 | 4383 Points -17% |
| Score Read | |
| MSI Prestige 16 B1MG-001US Samsung PM9A1 MZVL22T0HBLB | 2677 Points +75% |
| HP Spectre x360 2-in-1 16-f1075ng SK Hynix PC711 1TB HFS001TDE9X073N | 2260 Points +47% |
| Average WDC PC SN810 1TB (1211 - 3482, n=12) | 1974 Points +29% |
| Framework Laptop 16 WDC PC SN810 1TB | 1534 Points |
| Lenovo ThinkPad Z16 Gen 2 Kioxia XG8 KXG8AZNV1T02 | 1487 Points -3% |
| Dell Inspiron 16 Plus 7630 WD PC SN740 SDDPTQD-1T00 | 1459 Points -5% |
| Score Write | |
| MSI Prestige 16 B1MG-001US Samsung PM9A1 MZVL22T0HBLB | 3528 Points +15% |
| HP Spectre x360 2-in-1 16-f1075ng SK Hynix PC711 1TB HFS001TDE9X073N | 3170 Points +4% |
| Framework Laptop 16 WDC PC SN810 1TB | 3058 Points |
| Average WDC PC SN810 1TB (2416 - 3341, n=12) | 2940 Points -4% |
| Lenovo ThinkPad Z16 Gen 2 Kioxia XG8 KXG8AZNV1T02 | 2751 Points -10% |
| Dell Inspiron 16 Plus 7630 WD PC SN740 SDDPTQD-1T00 | 2233 Points -27% |
| Seq Read | |
| MSI Prestige 16 B1MG-001US Samsung PM9A1 MZVL22T0HBLB | 5528.24 MB/s +6% |
| Framework Laptop 16 WDC PC SN810 1TB | 5210.14 MB/s |
| Average WDC PC SN810 1TB (3823 - 5642, n=12) | 5185 MB/s 0% |
| Lenovo ThinkPad Z16 Gen 2 Kioxia XG8 KXG8AZNV1T02 | 4846.38 MB/s -7% |
| Dell Inspiron 16 Plus 7630 WD PC SN740 SDDPTQD-1T00 | 4349.04 MB/s -17% |
| HP Spectre x360 2-in-1 16-f1075ng SK Hynix PC711 1TB HFS001TDE9X073N | 2728.52 MB/s -48% |
| Seq Write | |
| MSI Prestige 16 B1MG-001US Samsung PM9A1 MZVL22T0HBLB | 4449.45 MB/s +42% |
| Average WDC PC SN810 1TB (2229 - 4795, n=12) | 3152 MB/s 0% |
| Framework Laptop 16 WDC PC SN810 1TB | 3139.42 MB/s |
| Dell Inspiron 16 Plus 7630 WD PC SN740 SDDPTQD-1T00 | 2904.62 MB/s -7% |
| HP Spectre x360 2-in-1 16-f1075ng SK Hynix PC711 1TB HFS001TDE9X073N | 2630.48 MB/s -16% |
| Lenovo ThinkPad Z16 Gen 2 Kioxia XG8 KXG8AZNV1T02 | 2533.8 MB/s -19% |
| 4K Read | |
| MSI Prestige 16 B1MG-001US Samsung PM9A1 MZVL22T0HBLB | 69.33 MB/s +26% |
| Average WDC PC SN810 1TB (53 - 81.9, n=12) | 67.8 MB/s +23% |
| Dell Inspiron 16 Plus 7630 WD PC SN740 SDDPTQD-1T00 | 65.43 MB/s +19% |
| HP Spectre x360 2-in-1 16-f1075ng SK Hynix PC711 1TB HFS001TDE9X073N | 61.52 MB/s +12% |
| Framework Laptop 16 WDC PC SN810 1TB | 55.09 MB/s |
| Lenovo ThinkPad Z16 Gen 2 Kioxia XG8 KXG8AZNV1T02 | 54.93 MB/s 0% |
| 4K Write | |
| HP Spectre x360 2-in-1 16-f1075ng SK Hynix PC711 1TB HFS001TDE9X073N | 239.47 MB/s +58% |
| Dell Inspiron 16 Plus 7630 WD PC SN740 SDDPTQD-1T00 | 225.06 MB/s +48% |
| Average WDC PC SN810 1TB (139 - 303, n=12) | 212 MB/s +40% |
| MSI Prestige 16 B1MG-001US Samsung PM9A1 MZVL22T0HBLB | 178.71 MB/s +18% |
| Lenovo ThinkPad Z16 Gen 2 Kioxia XG8 KXG8AZNV1T02 | 168.76 MB/s +11% |
| Framework Laptop 16 WDC PC SN810 1TB | 151.65 MB/s |
| 4K-64 Read | |
| MSI Prestige 16 B1MG-001US Samsung PM9A1 MZVL22T0HBLB | 2054.46 MB/s +115% |
| HP Spectre x360 2-in-1 16-f1075ng SK Hynix PC711 1TB HFS001TDE9X073N | 1925.49 MB/s +101% |
| Average WDC PC SN810 1TB (624 - 2855, n=12) | 1388 MB/s +45% |
| Dell Inspiron 16 Plus 7630 WD PC SN740 SDDPTQD-1T00 | 959.03 MB/s 0% |
| Framework Laptop 16 WDC PC SN810 1TB | 957.67 MB/s |
| Lenovo ThinkPad Z16 Gen 2 Kioxia XG8 KXG8AZNV1T02 | 947.86 MB/s -1% |
| 4K-64 Write | |
| MSI Prestige 16 B1MG-001US Samsung PM9A1 MZVL22T0HBLB | 2904.81 MB/s +12% |
| HP Spectre x360 2-in-1 16-f1075ng SK Hynix PC711 1TB HFS001TDE9X073N | 2667.24 MB/s +3% |
| Framework Laptop 16 WDC PC SN810 1TB | 2592.65 MB/s |
| Average WDC PC SN810 1TB (2017 - 2749, n=12) | 2413 MB/s -7% |
| Lenovo ThinkPad Z16 Gen 2 Kioxia XG8 KXG8AZNV1T02 | 2329.29 MB/s -10% |
| Dell Inspiron 16 Plus 7630 WD PC SN740 SDDPTQD-1T00 | 1717.85 MB/s -34% |
| Access Time Read | |
| Lenovo ThinkPad Z16 Gen 2 Kioxia XG8 KXG8AZNV1T02 | 0.08 ms * -3% |
| Framework Laptop 16 WDC PC SN810 1TB | 0.078 ms * |
| Average WDC PC SN810 1TB (0.023 - 0.09, n=12) | 0.0595 ms * +24% |
| Dell Inspiron 16 Plus 7630 WD PC SN740 SDDPTQD-1T00 | 0.057 ms * +27% |
| HP Spectre x360 2-in-1 16-f1075ng SK Hynix PC711 1TB HFS001TDE9X073N | 0.041 ms * +47% |
| MSI Prestige 16 B1MG-001US Samsung PM9A1 MZVL22T0HBLB | 0.037 ms * +53% |
| Access Time Write | |
| Framework Laptop 16 WDC PC SN810 1TB | 0.074 ms * |
| Dell Inspiron 16 Plus 7630 WD PC SN740 SDDPTQD-1T00 | 0.07 ms * +5% |
| Lenovo ThinkPad Z16 Gen 2 Kioxia XG8 KXG8AZNV1T02 | 0.07 ms * +5% |
| MSI Prestige 16 B1MG-001US Samsung PM9A1 MZVL22T0HBLB | 0.068 ms * +8% |
| Average WDC PC SN810 1TB (0.012 - 0.074, n=12) | 0.02892 ms * +61% |
| HP Spectre x360 2-in-1 16-f1075ng SK Hynix PC711 1TB HFS001TDE9X073N | 0.018 ms * +76% |
* ... smaller is better
The RDNA 3 Radeon RX 7700S directly succeeds last year's RDNA 2 Radeon RX 6700S. The newer architecture, however, hasn't improved performance by all that much unless if the game supports DX12; 3DMark Fire Strike results are almost identical between the two GPUs whereas Time Spy results are 20 to 25 percent faster than before. Bigger gains can be seen in RT performance as this was a weak spot with the older RDNA 2 architecture. Overall performance is most comparable to a laptop with GeForce RTX 4060 graphics like the Lenovo Legion Slim 7 16.
Even with the dGPU removed, the Radeon RX 780M iGPU is still more than capable of powering through multimedia tasks. The AMD GPU remains one of the fastest iGPU solutions available even though it was recently surpassed by the Intel Arc series.
Running on Windows Balanced mode instead of Performance mode does not appear to impact performance as shown by our Fire Strike results table below. Running on battery power would reduce performance by about 15 percent.
| Power Profile | Graphics Score | Physics Score | Combined Score |
| Performance | 24246 | 29487 | 10294 |
| Balanced | 24125 (-0%) | 29101 (-0%) | 10389 (-0%) |
| Battery Mode | 20380 (-16%) | 25009 (-15%) | 6769 (-34%) |
| 3DMark Performance rating - Percent | |
| Asus Zephyrus Duo 16 GX650PY-NM006W NVIDIA GeForce RTX 4090 Laptop GPU, AMD Ryzen 9 7945HX | 99.2 pt |
| Alienware m18 R1 AMD -1! AMD Radeon RX 7900M, AMD Ryzen 9 7945HX | 95.2 pt |
| Alienware m16 R1 AMD NVIDIA GeForce RTX 4080 Laptop GPU, AMD Ryzen 9 7845HX | 92.9 pt |
| MSI Stealth 16 Mercedes-AMG Motorsport A13VG -2! NVIDIA GeForce RTX 4070 Laptop GPU, Intel Core i9-13900H | 58.7 pt |
| Lenovo Legion Slim 7 16APH8 -1! NVIDIA GeForce RTX 4060 Laptop GPU, AMD Ryzen 7 7840HS | 51.3 pt |
| Framework Laptop 16 AMD Radeon RX 7700S, AMD Ryzen 9 7940HS | 48.7 pt |
| Average AMD Radeon RX 7700S | 48.7 pt |
| Asus ROG Zephyrus G14 GA402RJ -1! AMD Radeon RX 6700S, AMD Ryzen 7 6800HS | 43.6 pt |
| Dell Inspiron 16 Plus 7630 NVIDIA GeForce RTX 4060 Laptop GPU, Intel Core i7-13700H | 41.6 pt |
| Lenovo ThinkPad Z16 Gen 2 -1! AMD Radeon RX 6550M, AMD Ryzen 9 PRO 7940HS | 24.8 pt |
| MSI Prestige 16 B1MG-001US -2! Intel Arc 8-Core iGPU, Intel Core Ultra 7 155H | 19 pt |
| Acer Swift Edge SFE16-42-R1GM -2! AMD Radeon 680M, AMD Ryzen 7 7735U | 13.5 pt |
| Acer Swift Edge SFE16 Ryzen 7 7840U -1! AMD Radeon 780M, AMD Ryzen 7 7840U | 13 pt |
| HP Spectre x360 2-in-1 16-f1075ng -2! Intel Iris Xe Graphics G7 96EUs, Intel Core i7-12700H | 9 pt |
| 3DMark | |
| 1920x1080 Fire Strike Graphics | |
| Alienware m18 R1 AMD AMD Radeon RX 7900M, AMD Ryzen 9 7945HX | 50241 Points +107% |
| Asus Zephyrus Duo 16 GX650PY-NM006W NVIDIA GeForce RTX 4090 Laptop GPU, AMD Ryzen 9 7945HX | 47798 Points +97% |
| Alienware m16 R1 AMD NVIDIA GeForce RTX 4080 Laptop GPU, AMD Ryzen 9 7845HX | 44782 Points +85% |
| MSI Stealth 16 Mercedes-AMG Motorsport A13VG NVIDIA GeForce RTX 4070 Laptop GPU, Intel Core i9-13900H | 28723 Points +18% |
| Lenovo Legion Slim 7 16APH8 NVIDIA GeForce RTX 4060 Laptop GPU, AMD Ryzen 7 7840HS | 26480 Points +9% |
| Framework Laptop 16 AMD Radeon RX 7700S, AMD Ryzen 9 7940HS | 24246 Points |
| Average AMD Radeon RX 7700S (n=1) | 24246 Points 0% |
| Asus ROG Zephyrus G14 GA402RJ AMD Radeon RX 6700S, AMD Ryzen 7 6800HS | 24135 Points 0% |
| Dell Inspiron 16 Plus 7630 NVIDIA GeForce RTX 4060 Laptop GPU, Intel Core i7-13700H | 21600 Points -11% |
| Lenovo ThinkPad Z16 Gen 2 AMD Radeon RX 6550M, AMD Ryzen 9 PRO 7940HS | 14696 Points -39% |
| MSI Prestige 16 B1MG-001US Intel Arc 8-Core iGPU, Intel Core Ultra 7 155H | 8796 Points -64% |
| Acer Swift Edge SFE16 Ryzen 7 7840U AMD Radeon 780M, AMD Ryzen 7 7840U | 7156 Points -70% |
| Acer Swift Edge SFE16-42-R1GM AMD Radeon 680M, AMD Ryzen 7 7735U | 6777 Points -72% |
| HP Spectre x360 2-in-1 16-f1075ng Intel Iris Xe Graphics G7 96EUs, Intel Core i7-12700H | 4629 Points -81% |
| 2560x1440 Time Spy Graphics | |
| Asus Zephyrus Duo 16 GX650PY-NM006W NVIDIA GeForce RTX 4090 Laptop GPU, AMD Ryzen 9 7945HX | 20033 Points +96% |
| Alienware m18 R1 AMD AMD Radeon RX 7900M, AMD Ryzen 9 7945HX | 19434 Points +90% |
| Alienware m16 R1 AMD NVIDIA GeForce RTX 4080 Laptop GPU, AMD Ryzen 9 7845HX | 19365 Points +90% |
| MSI Stealth 16 Mercedes-AMG Motorsport A13VG NVIDIA GeForce RTX 4070 Laptop GPU, Intel Core i9-13900H | 11717 Points +15% |
| Framework Laptop 16 AMD Radeon RX 7700S, AMD Ryzen 9 7940HS | 10206 Points |
| Average AMD Radeon RX 7700S (n=1) | 10206 Points 0% |
| Lenovo Legion Slim 7 16APH8 NVIDIA GeForce RTX 4060 Laptop GPU, AMD Ryzen 7 7840HS | 9783 Points -4% |
| Asus ROG Zephyrus G14 GA402RJ AMD Radeon RX 6700S, AMD Ryzen 7 6800HS | 8316 Points -19% |
| Dell Inspiron 16 Plus 7630 NVIDIA GeForce RTX 4060 Laptop GPU, Intel Core i7-13700H | 7877 Points -23% |
| Lenovo ThinkPad Z16 Gen 2 AMD Radeon RX 6550M, AMD Ryzen 9 PRO 7940HS | 4546 Points -55% |
| MSI Prestige 16 B1MG-001US Intel Arc 8-Core iGPU, Intel Core Ultra 7 155H | 3511 Points -66% |
| Acer Swift Edge SFE16 Ryzen 7 7840U AMD Radeon 780M, AMD Ryzen 7 7840U | 2363 Points -77% |
| Acer Swift Edge SFE16-42-R1GM AMD Radeon 680M, AMD Ryzen 7 7735U | 2276 Points -78% |
| HP Spectre x360 2-in-1 16-f1075ng Intel Iris Xe Graphics G7 96EUs, Intel Core i7-12700H | 1444 Points -86% |
| 2560x1440 Time Spy Score | |
| Asus Zephyrus Duo 16 GX650PY-NM006W NVIDIA GeForce RTX 4090 Laptop GPU, AMD Ryzen 9 7945HX | 18602 Points +81% |
| Alienware m18 R1 AMD AMD Radeon RX 7900M, AMD Ryzen 9 7945HX | 18114 Points +76% |
| Alienware m16 R1 AMD NVIDIA GeForce RTX 4080 Laptop GPU, AMD Ryzen 9 7845HX | 17719 Points +72% |
| MSI Stealth 16 Mercedes-AMG Motorsport A13VG NVIDIA GeForce RTX 4070 Laptop GPU, Intel Core i9-13900H | 11694 Points +14% |
| Framework Laptop 16 AMD Radeon RX 7700S, AMD Ryzen 9 7940HS | 10294 Points |
| Average AMD Radeon RX 7700S (n=1) | 10294 Points 0% |
| Lenovo Legion Slim 7 16APH8 NVIDIA GeForce RTX 4060 Laptop GPU, AMD Ryzen 7 7840HS | 10032 Points -3% |
| Asus ROG Zephyrus G14 GA402RJ AMD Radeon RX 6700S, AMD Ryzen 7 6800HS | 8547 Points -17% |
| Dell Inspiron 16 Plus 7630 NVIDIA GeForce RTX 4060 Laptop GPU, Intel Core i7-13700H | 8240 Points -20% |
| Lenovo ThinkPad Z16 Gen 2 AMD Radeon RX 6550M, AMD Ryzen 9 PRO 7940HS | 4955 Points -52% |
| MSI Prestige 16 B1MG-001US Intel Arc 8-Core iGPU, Intel Core Ultra 7 155H | 3906 Points -62% |
| Acer Swift Edge SFE16 Ryzen 7 7840U AMD Radeon 780M, AMD Ryzen 7 7840U | 2613 Points -75% |
| Acer Swift Edge SFE16-42-R1GM AMD Radeon 680M, AMD Ryzen 7 7735U | 2532 Points -75% |
| HP Spectre x360 2-in-1 16-f1075ng Intel Iris Xe Graphics G7 96EUs, Intel Core i7-12700H | 1645 Points -84% |
| 2560x1440 Speed Way Score | |
| Asus Zephyrus Duo 16 GX650PY-NM006W NVIDIA GeForce RTX 4090 Laptop GPU, AMD Ryzen 9 7945HX | 5208 Points +179% |
| Alienware m16 R1 AMD NVIDIA GeForce RTX 4080 Laptop GPU, AMD Ryzen 9 7845HX | 4739 Points +154% |
| Dell Inspiron 16 Plus 7630 NVIDIA GeForce RTX 4060 Laptop GPU, Intel Core i7-13700H | 2041 Points +9% |
| Framework Laptop 16 AMD Radeon RX 7700S, AMD Ryzen 9 7940HS | 1869 Points |
| Average AMD Radeon RX 7700S (n=1) | 1869 Points 0% |
| Acer Swift Edge SFE16 Ryzen 7 7840U AMD Radeon 780M, AMD Ryzen 7 7840U | 329 Points -82% |
| 2560x1440 Port Royal Graphics | |
| Asus Zephyrus Duo 16 GX650PY-NM006W NVIDIA GeForce RTX 4090 Laptop GPU, AMD Ryzen 9 7945HX | 12649 Points +144% |
| Alienware m16 R1 AMD NVIDIA GeForce RTX 4080 Laptop GPU, AMD Ryzen 9 7845HX | 11979 Points +131% |
| Alienware m18 R1 AMD AMD Radeon RX 7900M, AMD Ryzen 9 7945HX | 10814 Points +109% |
| MSI Stealth 16 Mercedes-AMG Motorsport A13VG NVIDIA GeForce RTX 4070 Laptop GPU, Intel Core i9-13900H | 7121 Points +37% |
| Lenovo Legion Slim 7 16APH8 NVIDIA GeForce RTX 4060 Laptop GPU, AMD Ryzen 7 7840HS | 5528 Points +7% |
| Framework Laptop 16 AMD Radeon RX 7700S, AMD Ryzen 9 7940HS | 5184 Points |
| Average AMD Radeon RX 7700S (n=1) | 5184 Points 0% |
| Dell Inspiron 16 Plus 7630 NVIDIA GeForce RTX 4060 Laptop GPU, Intel Core i7-13700H | 4806 Points -7% |
| Asus ROG Zephyrus G14 GA402RJ AMD Radeon RX 6700S, AMD Ryzen 7 6800HS | 3803 Points -27% |
| Lenovo ThinkPad Z16 Gen 2 AMD Radeon RX 6550M, AMD Ryzen 9 PRO 7940HS | 1572 Points -70% |
| 3DMark 11 - 1280x720 Performance GPU | |
| Asus Zephyrus Duo 16 GX650PY-NM006W NVIDIA GeForce RTX 4090 Laptop GPU, AMD Ryzen 9 7945HX | 62240 Points +64% |
| Alienware m18 R1 AMD AMD Radeon RX 7900M, AMD Ryzen 9 7945HX | 59943 Points +58% |
| Alienware m16 R1 AMD NVIDIA GeForce RTX 4080 Laptop GPU, AMD Ryzen 9 7845HX | 56373 Points +49% |
| Framework Laptop 16 AMD Radeon RX 7700S, AMD Ryzen 9 7940HS | 37918 Points |
| Average AMD Radeon RX 7700S (n=1) | 37918 Points 0% |
| Lenovo Legion Slim 7 16APH8 NVIDIA GeForce RTX 4060 Laptop GPU, AMD Ryzen 7 7840HS | 35602 Points -6% |
| Asus ROG Zephyrus G14 GA402RJ AMD Radeon RX 6700S, AMD Ryzen 7 6800HS | 32662 Points -14% |
| Dell Inspiron 16 Plus 7630 NVIDIA GeForce RTX 4060 Laptop GPU, Intel Core i7-13700H | 28621 Points -25% |
| Lenovo ThinkPad Z16 Gen 2 AMD Radeon RX 6550M, AMD Ryzen 9 PRO 7940HS | 20506 Points -46% |
| MSI Prestige 16 B1MG-001US Intel Arc 8-Core iGPU, Intel Core Ultra 7 155H | 12520 Points -67% |
| Acer Swift Edge SFE16 Ryzen 7 7840U AMD Radeon 780M, AMD Ryzen 7 7840U | 11636 Points -69% |
| Acer Swift Edge SFE16-42-R1GM AMD Radeon 680M, AMD Ryzen 7 7735U | 9702 Points -74% |
| HP Spectre x360 2-in-1 16-f1075ng Intel Iris Xe Graphics G7 96EUs, Intel Core i7-12700H | 6582 Points -83% |
| 3DMark 11 Performance | 32427 points | |
| 3DMark Fire Strike Score | 21865 points | |
| 3DMark Time Spy Score | 10294 points | |
Help | ||
| Blender | |
| v3.3 Classroom METAL | |
| Apple MacBook Pro 16 2023 M3 Max Apple M3 Max 40-Core GPU, Apple M3 Max 16-Core | 32 Seconds * |
| v3.3 Classroom HIP/AMD | |
| Acer Swift Edge SFE16-42-R1GM AMD Radeon 680M, AMD Ryzen 7 7735U | 347 Seconds * |
| v3.3 Classroom OPTIX/RTX | |
| Dell Inspiron 16 Plus 7630 NVIDIA GeForce RTX 4060 Laptop GPU, Intel Core i7-13700H | 27 Seconds * |
| Lenovo Legion Slim 7 16APH8 NVIDIA GeForce RTX 4060 Laptop GPU, AMD Ryzen 7 7840HS | 24 Seconds * |
| MSI Stealth 16 Mercedes-AMG Motorsport A13VG NVIDIA GeForce RTX 4070 Laptop GPU, Intel Core i9-13900H | 23 Seconds * |
| Alienware m16 R1 AMD NVIDIA GeForce RTX 4080 Laptop GPU, AMD Ryzen 9 7845HX | 16 Seconds * |
| Asus Zephyrus Duo 16 GX650PY-NM006W NVIDIA GeForce RTX 4090 Laptop GPU, AMD Ryzen 9 7945HX | 13 Seconds * |
| v3.3 Classroom CUDA | |
| Dell Inspiron 16 Plus 7630 NVIDIA GeForce RTX 4060 Laptop GPU, Intel Core i7-13700H | 49 Seconds * |
| Lenovo Legion Slim 7 16APH8 NVIDIA GeForce RTX 4060 Laptop GPU, AMD Ryzen 7 7840HS | 44 Seconds * |
| MSI Stealth 16 Mercedes-AMG Motorsport A13VG NVIDIA GeForce RTX 4070 Laptop GPU, Intel Core i9-13900H | 36 Seconds * |
| Alienware m16 R1 AMD NVIDIA GeForce RTX 4080 Laptop GPU, AMD Ryzen 9 7845HX | 23 Seconds * |
| Asus Zephyrus Duo 16 GX650PY-NM006W NVIDIA GeForce RTX 4090 Laptop GPU, AMD Ryzen 9 7945HX | 20 Seconds * |
| v3.3 Classroom CPU | |
| Acer Swift Edge SFE16-42-R1GM AMD Radeon 680M, AMD Ryzen 7 7735U | 540 Seconds * -74% |
| HP Spectre x360 2-in-1 16-f1075ng Intel Iris Xe Graphics G7 96EUs, Intel Core i7-12700H | 487 Seconds * -57% |
| Dell Inspiron 16 Plus 7630 NVIDIA GeForce RTX 4060 Laptop GPU, Intel Core i7-13700H | 400 Seconds * -29% |
| MSI Stealth 16 Mercedes-AMG Motorsport A13VG NVIDIA GeForce RTX 4070 Laptop GPU, Intel Core i9-13900H | 399 Seconds * -28% |
| MSI Prestige 16 B1MG-001US Intel Arc 8-Core iGPU, Intel Core Ultra 7 155H | 374 Seconds * -20% |
| Lenovo Legion Slim 7 16APH8 NVIDIA GeForce RTX 4060 Laptop GPU, AMD Ryzen 7 7840HS | 315 Seconds * -1% |
| Framework Laptop 16 AMD Radeon RX 7700S, AMD Ryzen 9 7940HS | 311 Seconds * |
| Lenovo ThinkPad Z16 Gen 2 AMD Radeon RX 6550M, AMD Ryzen 9 PRO 7940HS | 305 Seconds * +2% |
| Apple MacBook Pro 16 2023 M3 Max Apple M3 Max 40-Core GPU, Apple M3 Max 16-Core | 194 Seconds * +38% |
| Alienware m16 R1 AMD NVIDIA GeForce RTX 4080 Laptop GPU, AMD Ryzen 9 7845HX | 185 Seconds * +41% |
| Asus Zephyrus Duo 16 GX650PY-NM006W NVIDIA GeForce RTX 4090 Laptop GPU, AMD Ryzen 9 7945HX | 147 Seconds * +53% |
| Alienware m18 R1 AMD AMD Radeon RX 7900M, AMD Ryzen 9 7945HX | 138 Seconds * +56% |
* ... smaller is better
Gaming performance from the 100 W Radeon RX 7700S is about 10 to 30 percent behind the mobile GeForce RTX 4060 depending on the TDP. For example, performance is much closer to the 60 W RTX 4060 in the Dell Inspiron 16 Plus 7630 while the 140 W RTX 4060 would outperform our Radeon by wider margins. Thus, expect gaming performance to be in between the mobile RTX 4050 and mobile RTX 4060.
Performance would also be just slightly faster than last year's Radeon RX 6700S in most tested titles. The biggest gains can be seen when RT is enabled just as predicted by 3DMark. F1 22, for example, would run 30 to 40 percent faster than before when its RT settings are active compared to the more minor 5 to 15 percent gains when RT settings are off.
| Performance rating - Percent | |
| Asus Zephyrus Duo 16 GX650PY-NM006W AMD Ryzen 9 7945HX, NVIDIA GeForce RTX 4090 Laptop GPU | 98.9 pt |
| Alienware m16 R1 AMD -1! AMD Ryzen 9 7845HX, NVIDIA GeForce RTX 4080 Laptop GPU | 96.3 pt |
| Alienware m18 R1 AMD AMD Ryzen 9 7945HX, AMD Radeon RX 7900M | 85.2 pt |
| MSI Stealth 16 Mercedes-AMG Motorsport A13VG Intel Core i9-13900H, NVIDIA GeForce RTX 4070 Laptop GPU | 67.2 pt |
| Lenovo Legion Slim 7 16APH8 -1! AMD Ryzen 7 7840HS, NVIDIA GeForce RTX 4060 Laptop GPU | 65.4 pt |
| Dell Inspiron 16 Plus 7630 -1! Intel Core i7-13700H, NVIDIA GeForce RTX 4060 Laptop GPU | 64.6 pt |
| Framework Laptop 16 AMD Ryzen 9 7940HS, AMD Radeon RX 7700S | 55.7 pt |
| Asus ROG Zephyrus G14 GA402RJ AMD Ryzen 7 6800HS, AMD Radeon RX 6700S | 49 pt |
| Apple MacBook Pro 16 2023 M3 Max -4! Apple M3 Max 16-Core, Apple M3 Max 40-Core GPU | 39.1 pt |
| Lenovo ThinkPad Z16 Gen 2 -1! AMD Ryzen 9 PRO 7940HS, AMD Radeon RX 6550M | 33.2 pt |
| MSI Prestige 16 B1MG-001US -1! Intel Core Ultra 7 155H, Intel Arc 8-Core iGPU | 23.1 pt |
| Acer Swift Edge SFE16 Ryzen 7 7840U AMD Ryzen 7 7840U, AMD Radeon 780M | 18.5 pt |
| Acer Swift Edge SFE16-42-R1GM AMD Ryzen 7 7735U, AMD Radeon 680M | 17.8 pt |
| HP Spectre x360 2-in-1 16-f1075ng Intel Core i7-12700H, Intel Iris Xe Graphics G7 96EUs | 14.8 pt |
| The Witcher 3 - 1920x1080 Ultra Graphics & Postprocessing (HBAO+) | |
| Asus Zephyrus Duo 16 GX650PY-NM006W AMD Ryzen 9 7945HX, NVIDIA GeForce RTX 4090 Laptop GPU | 178.6 (172min, 173P1) fps +113% |
| Alienware m16 R1 AMD AMD Ryzen 9 7845HX, NVIDIA GeForce RTX 4080 Laptop GPU | 169.7 (161min) fps +102% |
| Alienware m18 R1 AMD AMD Ryzen 9 7945HX, AMD Radeon RX 7900M | 167.7 (134min) fps +100% |
| MSI Stealth 16 Mercedes-AMG Motorsport A13VG Intel Core i9-13900H, NVIDIA GeForce RTX 4070 Laptop GPU | 110 fps +31% |
| Lenovo Legion Slim 7 16APH8 AMD Ryzen 7 7840HS, NVIDIA GeForce RTX 4060 Laptop GPU | 98 fps +17% |
| Dell Inspiron 16 Plus 7630 Intel Core i7-13700H, NVIDIA GeForce RTX 4060 Laptop GPU | 90.9 (85min) fps +8% |
| Asus ROG Zephyrus G14 GA402RJ AMD Ryzen 7 6800HS, AMD Radeon RX 6700S | 84.3 (69min) fps 0% |
| Framework Laptop 16 AMD Ryzen 9 7940HS, AMD Radeon RX 7700S | 84 (79min) fps |
| Apple MacBook Pro 16 2023 M3 Max Apple M3 Max 16-Core, Apple M3 Max 40-Core GPU | 69 fps -18% |
| Lenovo ThinkPad Z16 Gen 2 AMD Ryzen 9 PRO 7940HS, AMD Radeon RX 6550M | 49.4 (42min) fps -41% |
| MSI Prestige 16 B1MG-001US Intel Core Ultra 7 155H, Intel Arc 8-Core iGPU | 25.2 (22min) fps -70% |
| Acer Swift Edge SFE16 Ryzen 7 7840U AMD Ryzen 7 7840U, AMD Radeon 780M | 20.4 (18min) fps -76% |
| Acer Swift Edge SFE16-42-R1GM AMD Ryzen 7 7735U, AMD Radeon 680M | 20.3 fps -76% |
| HP Spectre x360 2-in-1 16-f1075ng Intel Core i7-12700H, Intel Iris Xe Graphics G7 96EUs | 12.8 (4.76min, 5.9P0.1, 7.32P1) fps -85% |
| GTA V - 1920x1080 Highest AA:4xMSAA + FX AF:16x | |
| Asus Zephyrus Duo 16 GX650PY-NM006W AMD Ryzen 9 7945HX, NVIDIA GeForce RTX 4090 Laptop GPU | 134 (7.27min, 90.9P1) fps +40% |
| Alienware m18 R1 AMD AMD Ryzen 9 7945HX, AMD Radeon RX 7900M | 105 (4.76min, 62.5P1) fps +10% |
| Lenovo Legion Slim 7 16APH8 AMD Ryzen 7 7840HS, NVIDIA GeForce RTX 4060 Laptop GPU | 103.2 (16.4min, 71.4P1) fps +8% |
| MSI Stealth 16 Mercedes-AMG Motorsport A13VG Intel Core i9-13900H, NVIDIA GeForce RTX 4070 Laptop GPU | 100.3 (24.9min, 71.4P1) fps +5% |
| Framework Laptop 16 AMD Ryzen 9 7940HS, AMD Radeon RX 7700S | 95.8 (13min, 58.8P1) fps |
| Asus ROG Zephyrus G14 GA402RJ AMD Ryzen 7 6800HS, AMD Radeon RX 6700S | 81.3 (9.16min, 55.6P1) fps -15% |
| Apple MacBook Pro 16 2023 M3 Max Apple M3 Max 16-Core, Apple M3 Max 40-Core GPU | 53 fps -45% |
| Acer Swift Edge SFE16 Ryzen 7 7840U AMD Ryzen 7 7840U, AMD Radeon 780M | 21 (3.16min, 14.5P1) fps -78% |
| Acer Swift Edge SFE16-42-R1GM AMD Ryzen 7 7735U, AMD Radeon 680M | 19.4 (3.62min, 14.1P1) fps -80% |
| HP Spectre x360 2-in-1 16-f1075ng Intel Core i7-12700H, Intel Iris Xe Graphics G7 96EUs | 7.07 (3.18min, 4.26P1) fps -93% |
| Final Fantasy XV Benchmark - 1920x1080 High Quality | |
| Asus Zephyrus Duo 16 GX650PY-NM006W AMD Ryzen 9 7945HX, NVIDIA GeForce RTX 4090 Laptop GPU | 169.6 fps +127% |
| Alienware m16 R1 AMD AMD Ryzen 9 7845HX, NVIDIA GeForce RTX 4080 Laptop GPU | 167.6 fps +124% |
| Alienware m18 R1 AMD AMD Ryzen 9 7945HX, AMD Radeon RX 7900M | 152.8 fps +104% |
| MSI Stealth 16 Mercedes-AMG Motorsport A13VG Intel Core i9-13900H, NVIDIA GeForce RTX 4070 Laptop GPU | 101.4 fps +36% |
| Dell Inspiron 16 Plus 7630 Intel Core i7-13700H, NVIDIA GeForce RTX 4060 Laptop GPU | 88.9 fps +19% |
| Asus ROG Zephyrus G14 GA402RJ AMD Ryzen 7 6800HS, AMD Radeon RX 6700S | 78.6 fps +5% |
| Framework Laptop 16 AMD Ryzen 9 7940HS, AMD Radeon RX 7700S | 74.8 fps |
| Lenovo ThinkPad Z16 Gen 2 AMD Ryzen 9 PRO 7940HS, AMD Radeon RX 6550M | 47.8 fps -36% |
| MSI Prestige 16 B1MG-001US Intel Core Ultra 7 155H, Intel Arc 8-Core iGPU | 24.6 fps -67% |
| Acer Swift Edge SFE16 Ryzen 7 7840U AMD Ryzen 7 7840U, AMD Radeon 780M | 21.2 fps -72% |
| Acer Swift Edge SFE16-42-R1GM AMD Ryzen 7 7735U, AMD Radeon 680M | 19.3 fps -74% |
| HP Spectre x360 2-in-1 16-f1075ng Intel Core i7-12700H, Intel Iris Xe Graphics G7 96EUs | 14.6 fps -80% |
| Strange Brigade - 1920x1080 ultra AA:ultra AF:16 | |
| Alienware m16 R1 AMD AMD Ryzen 9 7845HX, NVIDIA GeForce RTX 4080 Laptop GPU | 357 (82.8min, 253P1) fps +148% |
| Alienware m18 R1 AMD AMD Ryzen 9 7945HX, AMD Radeon RX 7900M | 344 (145.8min, 227P1) fps +139% |
| Asus Zephyrus Duo 16 GX650PY-NM006W AMD Ryzen 9 7945HX, NVIDIA GeForce RTX 4090 Laptop GPU | 333 (38min, 227P1) fps +131% |
| MSI Stealth 16 Mercedes-AMG Motorsport A13VG Intel Core i9-13900H, NVIDIA GeForce RTX 4070 Laptop GPU | 190.6 (88.3min, 142.9P1) fps +32% |
| Lenovo Legion Slim 7 16APH8 AMD Ryzen 7 7840HS, NVIDIA GeForce RTX 4060 Laptop GPU | 180.8 (22.8min, 134P1) fps +26% |
| Dell Inspiron 16 Plus 7630 Intel Core i7-13700H, NVIDIA GeForce RTX 4060 Laptop GPU | 161 (79.8min, 120.7P1) fps +12% |
| Asus ROG Zephyrus G14 GA402RJ AMD Ryzen 7 6800HS, AMD Radeon RX 6700S | 157.3 (108.2min, 113.2P1) fps +9% |
| Framework Laptop 16 AMD Ryzen 9 7940HS, AMD Radeon RX 7700S | 143.9 (84.9min, 104.3P1) fps |
| Lenovo ThinkPad Z16 Gen 2 AMD Ryzen 9 PRO 7940HS, AMD Radeon RX 6550M | 88.4 (66.9min, 70.8P1) fps -39% |
| MSI Prestige 16 B1MG-001US Intel Core Ultra 7 155H, Intel Arc 8-Core iGPU | 46.1 (5min, 20.8P1) fps -68% |
| Acer Swift Edge SFE16 Ryzen 7 7840U AMD Ryzen 7 7840U, AMD Radeon 780M | 41.3 (7.5min, 9.37P1) fps -71% |
| Acer Swift Edge SFE16-42-R1GM AMD Ryzen 7 7735U, AMD Radeon 680M | 36.4 (6.6min, 8.1P1) fps -75% |
| HP Spectre x360 2-in-1 16-f1075ng Intel Core i7-12700H, Intel Iris Xe Graphics G7 96EUs | 23.7 (7.7min, 9.06P1) fps -84% |
| Dota 2 Reborn - 1920x1080 ultra (3/3) best looking | |
| Asus Zephyrus Duo 16 GX650PY-NM006W AMD Ryzen 9 7945HX, NVIDIA GeForce RTX 4090 Laptop GPU | 179.7 (153.7min) fps +31% |
| Alienware m16 R1 AMD AMD Ryzen 9 7845HX, NVIDIA GeForce RTX 4080 Laptop GPU | 164.7 (138.5min) fps +20% |
| Alienware m18 R1 AMD AMD Ryzen 9 7945HX, AMD Radeon RX 7900M | 146.2 (121.3min) fps +7% |
| Dell Inspiron 16 Plus 7630 Intel Core i7-13700H, NVIDIA GeForce RTX 4060 Laptop GPU | 146.1 (126.2min) fps +7% |
| Framework Laptop 16 AMD Ryzen 9 7940HS, AMD Radeon RX 7700S | 136.8 (116min) fps |
| Lenovo Legion Slim 7 16APH8 AMD Ryzen 7 7840HS, NVIDIA GeForce RTX 4060 Laptop GPU | 134.7 (118.5min) fps -2% |
| MSI Stealth 16 Mercedes-AMG Motorsport A13VG Intel Core i9-13900H, NVIDIA GeForce RTX 4070 Laptop GPU | 126.9 (109.4min) fps -7% |
| Asus ROG Zephyrus G14 GA402RJ AMD Ryzen 7 6800HS, AMD Radeon RX 6700S | 103 (86.9min) fps -25% |
| Lenovo ThinkPad Z16 Gen 2 AMD Ryzen 9 PRO 7940HS, AMD Radeon RX 6550M | 103 (86.2min) fps -25% |
| MSI Prestige 16 B1MG-001US Intel Core Ultra 7 155H, Intel Arc 8-Core iGPU | 75.6 (49.1min) fps -45% |
| Acer Swift Edge SFE16 Ryzen 7 7840U AMD Ryzen 7 7840U, AMD Radeon 780M | 61.4 (52min) fps -55% |
| Acer Swift Edge SFE16-42-R1GM AMD Ryzen 7 7735U, AMD Radeon 680M | 61 (52.3min) fps -55% |
| HP Spectre x360 2-in-1 16-f1075ng Intel Core i7-12700H, Intel Iris Xe Graphics G7 96EUs | 48.8 (44.1min) fps -64% |
| X-Plane 11.11 - 1920x1080 high (fps_test=3) | |
| Asus Zephyrus Duo 16 GX650PY-NM006W AMD Ryzen 9 7945HX, NVIDIA GeForce RTX 4090 Laptop GPU | 117.8 fps +81% |
| Alienware m16 R1 AMD AMD Ryzen 9 7845HX, NVIDIA GeForce RTX 4080 Laptop GPU | 113.1 fps +74% |
| Dell Inspiron 16 Plus 7630 Intel Core i7-13700H, NVIDIA GeForce RTX 4060 Laptop GPU | 109.7 fps +69% |
| MSI Stealth 16 Mercedes-AMG Motorsport A13VG Intel Core i9-13900H, NVIDIA GeForce RTX 4070 Laptop GPU | 98 fps +51% |
| Alienware m18 R1 AMD AMD Ryzen 9 7945HX, AMD Radeon RX 7900M | 83.7 fps +29% |
| Lenovo Legion Slim 7 16APH8 AMD Ryzen 7 7840HS, NVIDIA GeForce RTX 4060 Laptop GPU | 81.6 fps +26% |
| Framework Laptop 16 AMD Ryzen 9 7940HS, AMD Radeon RX 7700S | 65 fps |
| Asus ROG Zephyrus G14 GA402RJ AMD Ryzen 7 6800HS, AMD Radeon RX 6700S | 45.2 fps -30% |
| HP Spectre x360 2-in-1 16-f1075ng Intel Core i7-12700H, Intel Iris Xe Graphics G7 96EUs | 40.1 fps -38% |
| MSI Prestige 16 B1MG-001US Intel Core Ultra 7 155H, Intel Arc 8-Core iGPU | 37.8 fps -42% |
| Lenovo ThinkPad Z16 Gen 2 AMD Ryzen 9 PRO 7940HS, AMD Radeon RX 6550M | 33 fps -49% |
| Acer Swift Edge SFE16 Ryzen 7 7840U AMD Ryzen 7 7840U, AMD Radeon 780M | 30.3 fps -53% |
| Acer Swift Edge SFE16-42-R1GM AMD Ryzen 7 7735U, AMD Radeon 680M | 30.2 fps -54% |
| Baldur's Gate 3 | |
| 1920x1080 High Preset AA:T | |
| Alienware m18 R1 AMD AMD Ryzen 9 7945HX, AMD Radeon RX 7900M | 152.4 fps +99% |
| Lenovo Legion Slim 7 16APH8 AMD Ryzen 7 7840HS, NVIDIA GeForce RTX 4060 Laptop GPU | 84.8 (24.5min, 32.2P0.1, 65.5P1) fps +11% |
| Framework Laptop 16 AMD Ryzen 9 7940HS, AMD Radeon RX 7700S | 76.4 fps |
| Average AMD Radeon RX 7700S (n=1) | 76.4 fps 0% |
| Lenovo ThinkPad Z16 Gen 2 AMD Ryzen 9 PRO 7940HS, AMD Radeon RX 6550M | 44.7 fps -41% |
| MSI Prestige 16 B1MG-001US Intel Core Ultra 7 155H, Intel Arc 8-Core iGPU | 24.1 fps -68% |
| 1920x1080 Ultra Preset AA:T | |
| Alienware m18 R1 AMD AMD Ryzen 9 7945HX, AMD Radeon RX 7900M | 152.6 fps +107% |
| Lenovo Legion Slim 7 16APH8 AMD Ryzen 7 7840HS, NVIDIA GeForce RTX 4060 Laptop GPU | 82.6 (21.9min, 32.5P0.1, 59.4P1) fps +12% |
| Framework Laptop 16 AMD Ryzen 9 7940HS, AMD Radeon RX 7700S | 73.6 fps |
| Average AMD Radeon RX 7700S (n=1) | 73.6 fps 0% |
| Lenovo ThinkPad Z16 Gen 2 AMD Ryzen 9 PRO 7940HS, AMD Radeon RX 6550M | 43 fps -42% |
| MSI Prestige 16 B1MG-001US Intel Core Ultra 7 155H, Intel Arc 8-Core iGPU | 23.4 fps -68% |
| 2560x1440 Ultra Preset AA:T | |
| Alienware m18 R1 AMD AMD Ryzen 9 7945HX, AMD Radeon RX 7900M | 118.5 fps +132% |
| Lenovo Legion Slim 7 16APH8 AMD Ryzen 7 7840HS, NVIDIA GeForce RTX 4060 Laptop GPU | 55.8 (23.7min, 27P0.1, 38.9P1) fps +9% |
| Framework Laptop 16 AMD Ryzen 9 7940HS, AMD Radeon RX 7700S | 51.1 fps |
| Average AMD Radeon RX 7700S (n=1) | 51.1 fps 0% |
| Lenovo ThinkPad Z16 Gen 2 AMD Ryzen 9 PRO 7940HS, AMD Radeon RX 6550M | 29 fps -43% |
| 3840x2160 Ultra Preset AA:T | |
| Alienware m18 R1 AMD AMD Ryzen 9 7945HX, AMD Radeon RX 7900M | 65.8 fps +166% |
| Framework Laptop 16 AMD Ryzen 9 7940HS, AMD Radeon RX 7700S | 24.7 fps |
| Average AMD Radeon RX 7700S (n=1) | 24.7 fps 0% |
| F1 22 | |
| 1920x1080 High Preset AA:T AF:16x | |
| Alienware m18 R1 AMD AMD Ryzen 9 7945HX, AMD Radeon RX 7900M | 296 (178min, 58P1) fps +76% |
| Alienware m16 R1 AMD AMD Ryzen 9 7845HX, NVIDIA GeForce RTX 4080 Laptop GPU | 285 (194min, 152P1) fps +70% |
| Asus Zephyrus Duo 16 GX650PY-NM006W AMD Ryzen 9 7945HX, NVIDIA GeForce RTX 4090 Laptop GPU | 265 (193min, 148P1) fps +58% |
| Framework Laptop 16 AMD Ryzen 9 7940HS, AMD Radeon RX 7700S | 168 (142min, 123P1) fps |
| Average AMD Radeon RX 7700S (n=1) | 168 fps 0% |
| Asus ROG Zephyrus G14 GA402RJ AMD Ryzen 7 6800HS, AMD Radeon RX 6700S | 161 (140min) fps -4% |
| Dell Inspiron 16 Plus 7630 Intel Core i7-13700H, NVIDIA GeForce RTX 4060 Laptop GPU | 148.4 (129min, 89P1) fps -12% |
| Lenovo ThinkPad Z16 Gen 2 AMD Ryzen 9 PRO 7940HS, AMD Radeon RX 6550M | 87.5 (71min, 69P1) fps -48% |
| MSI Prestige 16 B1MG-001US Intel Core Ultra 7 155H, Intel Arc 8-Core iGPU | 53.3 (38min, 38P1) fps -68% |
| Acer Swift Edge SFE16 Ryzen 7 7840U AMD Ryzen 7 7840U, AMD Radeon 780M | 42.6 (31min, 27P1) fps -75% |
| Acer Swift Edge SFE16-42-R1GM AMD Ryzen 7 7735U, AMD Radeon 680M | 36.9 (26min, 24P1) fps -78% |
| HP Spectre x360 2-in-1 16-f1075ng Intel Core i7-12700H, Intel Iris Xe Graphics G7 96EUs | 27.2 (23min, 21P1) fps -84% |
| 1920x1080 Ultra High Preset AA:T AF:16x | |
| Alienware m16 R1 AMD AMD Ryzen 9 7845HX, NVIDIA GeForce RTX 4080 Laptop GPU | 124.2 (106min, 80P1) fps +160% |
| Asus Zephyrus Duo 16 GX650PY-NM006W AMD Ryzen 9 7945HX, NVIDIA GeForce RTX 4090 Laptop GPU | 114.3 (92min, 71P1) fps +140% |
| Alienware m18 R1 AMD AMD Ryzen 9 7945HX, AMD Radeon RX 7900M | 102.8 (73min, 73P1) fps +116% |
| Dell Inspiron 16 Plus 7630 Intel Core i7-13700H, NVIDIA GeForce RTX 4060 Laptop GPU | 53.8 (46min, 45P1) fps +13% |
| Framework Laptop 16 AMD Ryzen 9 7940HS, AMD Radeon RX 7700S | 47.7 (32min, 34P1) fps |
| Average AMD Radeon RX 7700S (n=1) | 47.7 fps 0% |
| Asus ROG Zephyrus G14 GA402RJ AMD Ryzen 7 6800HS, AMD Radeon RX 6700S | 37 (27min) fps -22% |
| HP Spectre x360 2-in-1 16-f1075ng Intel Core i7-12700H, Intel Iris Xe Graphics G7 96EUs | 21.5 (18min, 17P1) fps -55% |
| Lenovo ThinkPad Z16 Gen 2 AMD Ryzen 9 PRO 7940HS, AMD Radeon RX 6550M | 19.3 (13min, 13P1) fps -60% |
| MSI Prestige 16 B1MG-001US Intel Core Ultra 7 155H, Intel Arc 8-Core iGPU | 15.3 (9min, 12P1) fps -68% |
| Acer Swift Edge SFE16 Ryzen 7 7840U AMD Ryzen 7 7840U, AMD Radeon 780M | 9.92 (7min, 7P1) fps -79% |
| Acer Swift Edge SFE16-42-R1GM AMD Ryzen 7 7735U, AMD Radeon 680M | 7.85 (5P1) fps -84% |
| 2560x1440 Ultra High Preset AA:T AF:16x | |
| Asus Zephyrus Duo 16 GX650PY-NM006W AMD Ryzen 9 7945HX, NVIDIA GeForce RTX 4090 Laptop GPU | 80.3 (70min, 58P1) fps +169% |
| Alienware m16 R1 AMD AMD Ryzen 9 7845HX, NVIDIA GeForce RTX 4080 Laptop GPU | 78.1 (67min, 65P1) fps +161% |
| Alienware m18 R1 AMD AMD Ryzen 9 7945HX, AMD Radeon RX 7900M | 69.3 (37min, 49P1) fps +132% |
| Dell Inspiron 16 Plus 7630 Intel Core i7-13700H, NVIDIA GeForce RTX 4060 Laptop GPU | 34.1 (28min, 28P1) fps +14% |
| Framework Laptop 16 AMD Ryzen 9 7940HS, AMD Radeon RX 7700S | 29.9 (20min, 21P1) fps |
| Average AMD Radeon RX 7700S (n=1) | 29.9 fps 0% |
| Asus ROG Zephyrus G14 GA402RJ AMD Ryzen 7 6800HS, AMD Radeon RX 6700S | 21 (16min) fps -30% |
| HP Spectre x360 2-in-1 16-f1075ng Intel Core i7-12700H, Intel Iris Xe Graphics G7 96EUs | 15 (12min, 12P1) fps -50% |
| Lenovo ThinkPad Z16 Gen 2 AMD Ryzen 9 PRO 7940HS, AMD Radeon RX 6550M | 11.3 (7min, 7P1) fps -62% |
| 3840x2160 Ultra High Preset AA:T AF:16x | |
| Alienware m16 R1 AMD AMD Ryzen 9 7845HX, NVIDIA GeForce RTX 4080 Laptop GPU | 39.5 (34min, 33P1) fps +250% |
| Alienware m18 R1 AMD AMD Ryzen 9 7945HX, AMD Radeon RX 7900M | 36.1 (24min, 25P1) fps +219% |
| Framework Laptop 16 AMD Ryzen 9 7940HS, AMD Radeon RX 7700S | 11.3 (8min, 8P1) fps |
| Average AMD Radeon RX 7700S (n=1) | 11.3 fps 0% |
| The Witcher 3 | |
| 1920x1080 High Graphics & Postprocessing (Nvidia HairWorks Off) | |
| Asus Zephyrus Duo 16 GX650PY-NM006W AMD Ryzen 9 7945HX, NVIDIA GeForce RTX 4090 Laptop GPU | 361 fps +145% |
| Alienware m16 R1 AMD AMD Ryzen 9 7845HX, NVIDIA GeForce RTX 4080 Laptop GPU | 349.3 (321min) fps +137% |
| MSI Stealth 16 Mercedes-AMG Motorsport A13VG Intel Core i9-13900H, NVIDIA GeForce RTX 4070 Laptop GPU | 205 (157min) fps +39% |
| Dell Inspiron 16 Plus 7630 Intel Core i7-13700H, NVIDIA GeForce RTX 4060 Laptop GPU | 169.5 (158min) fps +15% |
| Framework Laptop 16 AMD Ryzen 9 7940HS, AMD Radeon RX 7700S | 147.1 (136min) fps |
| Average AMD Radeon RX 7700S (n=1) | 147.1 fps 0% |
| Asus ROG Zephyrus G14 GA402RJ AMD Ryzen 7 6800HS, AMD Radeon RX 6700S | 144 (124min) fps -2% |
| Apple MacBook Pro 16 2023 M3 Max Apple M3 Max 16-Core, Apple M3 Max 40-Core GPU | 87 fps -41% |
| Lenovo ThinkPad Z16 Gen 2 AMD Ryzen 9 PRO 7940HS, AMD Radeon RX 6550M | 83.2 (78min) fps -43% |
| MSI Prestige 16 B1MG-001US Intel Core Ultra 7 155H, Intel Arc 8-Core iGPU | 54.1 (48min) fps -63% |
| Acer Swift Edge SFE16 Ryzen 7 7840U AMD Ryzen 7 7840U, AMD Radeon 780M | 36.1 (27min) fps -75% |
| Acer Swift Edge SFE16-42-R1GM AMD Ryzen 7 7735U, AMD Radeon 680M | 32.7 fps -78% |
| HP Spectre x360 2-in-1 16-f1075ng Intel Core i7-12700H, Intel Iris Xe Graphics G7 96EUs | 25.6 (12.6min, 13.1P0.1, 15.9P1) fps -83% |
| 1920x1080 Ultra Graphics & Postprocessing (HBAO+) | |
| Asus Zephyrus Duo 16 GX650PY-NM006W AMD Ryzen 9 7945HX, NVIDIA GeForce RTX 4090 Laptop GPU | 178.6 (172min, 173P1) fps +113% |
| Alienware m16 R1 AMD AMD Ryzen 9 7845HX, NVIDIA GeForce RTX 4080 Laptop GPU | 169.7 (161min) fps +102% |
| Alienware m18 R1 AMD AMD Ryzen 9 7945HX, AMD Radeon RX 7900M | 167.7 (134min) fps +100% |
| MSI Stealth 16 Mercedes-AMG Motorsport A13VG Intel Core i9-13900H, NVIDIA GeForce RTX 4070 Laptop GPU | 110 fps +31% |
| Lenovo Legion Slim 7 16APH8 AMD Ryzen 7 7840HS, NVIDIA GeForce RTX 4060 Laptop GPU | 98 fps +17% |
| Dell Inspiron 16 Plus 7630 Intel Core i7-13700H, NVIDIA GeForce RTX 4060 Laptop GPU | 90.9 (85min) fps +8% |
| Asus ROG Zephyrus G14 GA402RJ AMD Ryzen 7 6800HS, AMD Radeon RX 6700S | 84.3 (69min) fps 0% |
| Framework Laptop 16 AMD Ryzen 9 7940HS, AMD Radeon RX 7700S | 84 (79min) fps |
| Average AMD Radeon RX 7700S (n=1) | 84 fps 0% |
| Apple MacBook Pro 16 2023 M3 Max Apple M3 Max 16-Core, Apple M3 Max 40-Core GPU | 69 fps -18% |
| Lenovo ThinkPad Z16 Gen 2 AMD Ryzen 9 PRO 7940HS, AMD Radeon RX 6550M | 49.4 (42min) fps -41% |
| MSI Prestige 16 B1MG-001US Intel Core Ultra 7 155H, Intel Arc 8-Core iGPU | 25.2 (22min) fps -70% |
| Acer Swift Edge SFE16 Ryzen 7 7840U AMD Ryzen 7 7840U, AMD Radeon 780M | 20.4 (18min) fps -76% |
| Acer Swift Edge SFE16-42-R1GM AMD Ryzen 7 7735U, AMD Radeon 680M | 20.3 fps -76% |
| HP Spectre x360 2-in-1 16-f1075ng Intel Core i7-12700H, Intel Iris Xe Graphics G7 96EUs | 12.8 (4.76min, 5.9P0.1, 7.32P1) fps -85% |
| 3840x2160 High Graphics & Postprocessing (Nvidia HairWorks Off) | |
| Alienware m16 R1 AMD AMD Ryzen 9 7845HX, NVIDIA GeForce RTX 4080 Laptop GPU | 121.5 (112min) fps +183% |
| Alienware m18 R1 AMD AMD Ryzen 9 7945HX, AMD Radeon RX 7900M | 116 (107min) fps +170% |
| Framework Laptop 16 AMD Ryzen 9 7940HS, AMD Radeon RX 7700S | 43 (38min) fps |
| Average AMD Radeon RX 7700S (n=1) | 43 fps 0% |
| Dota 2 Reborn | |
| 3840x2160 ultra (3/3) best looking | |
| Alienware m16 R1 AMD AMD Ryzen 9 7845HX, NVIDIA GeForce RTX 4080 Laptop GPU | 161 (135.2min) fps +89% |
| Alienware m18 R1 AMD AMD Ryzen 9 7945HX, AMD Radeon RX 7900M | 122.5 (105.6min) fps +44% |
| Framework Laptop 16 AMD Ryzen 9 7940HS, AMD Radeon RX 7700S | 85.3 (77.8min) fps |
| Average AMD Radeon RX 7700S (n=1) | 85.3 fps 0% |
| 1920x1080 ultra (3/3) best looking | |
| Asus Zephyrus Duo 16 GX650PY-NM006W AMD Ryzen 9 7945HX, NVIDIA GeForce RTX 4090 Laptop GPU | 179.7 (153.7min) fps +31% |
| Alienware m16 R1 AMD AMD Ryzen 9 7845HX, NVIDIA GeForce RTX 4080 Laptop GPU | 164.7 (138.5min) fps +20% |
| Alienware m18 R1 AMD AMD Ryzen 9 7945HX, AMD Radeon RX 7900M | 146.2 (121.3min) fps +7% |
| Dell Inspiron 16 Plus 7630 Intel Core i7-13700H, NVIDIA GeForce RTX 4060 Laptop GPU | 146.1 (126.2min) fps +7% |
| Framework Laptop 16 AMD Ryzen 9 7940HS, AMD Radeon RX 7700S | 136.8 (116min) fps |
| Average AMD Radeon RX 7700S (n=1) | 136.8 fps 0% |
| Lenovo Legion Slim 7 16APH8 AMD Ryzen 7 7840HS, NVIDIA GeForce RTX 4060 Laptop GPU | 134.7 (118.5min) fps -2% |
| MSI Stealth 16 Mercedes-AMG Motorsport A13VG Intel Core i9-13900H, NVIDIA GeForce RTX 4070 Laptop GPU | 126.9 (109.4min) fps -7% |
| Asus ROG Zephyrus G14 GA402RJ AMD Ryzen 7 6800HS, AMD Radeon RX 6700S | 103 (86.9min) fps -25% |
| Lenovo ThinkPad Z16 Gen 2 AMD Ryzen 9 PRO 7940HS, AMD Radeon RX 6550M | 103 (86.2min) fps -25% |
| MSI Prestige 16 B1MG-001US Intel Core Ultra 7 155H, Intel Arc 8-Core iGPU | 75.6 (49.1min) fps -45% |
| Acer Swift Edge SFE16 Ryzen 7 7840U AMD Ryzen 7 7840U, AMD Radeon 780M | 61.4 (52min) fps -55% |
| Acer Swift Edge SFE16-42-R1GM AMD Ryzen 7 7735U, AMD Radeon 680M | 61 (52.3min) fps -55% |
| HP Spectre x360 2-in-1 16-f1075ng Intel Core i7-12700H, Intel Iris Xe Graphics G7 96EUs | 48.8 (44.1min) fps -64% |
| 1920x1080 high (2/3) | |
| Asus Zephyrus Duo 16 GX650PY-NM006W AMD Ryzen 9 7945HX, NVIDIA GeForce RTX 4090 Laptop GPU | 196.1 (167.3min) fps +25% |
| Alienware m16 R1 AMD AMD Ryzen 9 7845HX, NVIDIA GeForce RTX 4080 Laptop GPU | 180.4 (144.4min) fps +15% |
| Alienware m18 R1 AMD AMD Ryzen 9 7945HX, AMD Radeon RX 7900M | 162.8 (140.2min) fps +4% |
| Dell Inspiron 16 Plus 7630 Intel Core i7-13700H, NVIDIA GeForce RTX 4060 Laptop GPU | 157.9 (135min) fps +1% |
| Framework Laptop 16 AMD Ryzen 9 7940HS, AMD Radeon RX 7700S | 156.5 (129.7min) fps |
| Average AMD Radeon RX 7700S (n=1) | 156.5 fps 0% |
| Lenovo Legion Slim 7 16APH8 AMD Ryzen 7 7840HS, NVIDIA GeForce RTX 4060 Laptop GPU | 140.6 (123.7min) fps -10% |
| MSI Stealth 16 Mercedes-AMG Motorsport A13VG Intel Core i9-13900H, NVIDIA GeForce RTX 4070 Laptop GPU | 135.9 (117.6min) fps -13% |
| Asus ROG Zephyrus G14 GA402RJ AMD Ryzen 7 6800HS, AMD Radeon RX 6700S | 114.7 (96.5min) fps -27% |
| Lenovo ThinkPad Z16 Gen 2 AMD Ryzen 9 PRO 7940HS, AMD Radeon RX 6550M | 112.3 (96.6min) fps -28% |
| MSI Prestige 16 B1MG-001US Intel Core Ultra 7 155H, Intel Arc 8-Core iGPU | 79.1 (49.9min) fps -49% |
| Acer Swift Edge SFE16-42-R1GM AMD Ryzen 7 7735U, AMD Radeon 680M | 69.7 (60min) fps -55% |
| Acer Swift Edge SFE16 Ryzen 7 7840U AMD Ryzen 7 7840U, AMD Radeon 780M | 66.8 (55.4min) fps -57% |
| HP Spectre x360 2-in-1 16-f1075ng Intel Core i7-12700H, Intel Iris Xe Graphics G7 96EUs | 53 (48.5min) fps -66% |
| Final Fantasy XV Benchmark | |
| 1920x1080 High Quality | |
| Asus Zephyrus Duo 16 GX650PY-NM006W AMD Ryzen 9 7945HX, NVIDIA GeForce RTX 4090 Laptop GPU | 169.6 fps +127% |
| Alienware m16 R1 AMD AMD Ryzen 9 7845HX, NVIDIA GeForce RTX 4080 Laptop GPU | 167.6 fps +124% |
| Alienware m18 R1 AMD AMD Ryzen 9 7945HX, AMD Radeon RX 7900M | 152.8 fps +104% |
| MSI Stealth 16 Mercedes-AMG Motorsport A13VG Intel Core i9-13900H, NVIDIA GeForce RTX 4070 Laptop GPU | 101.4 fps +36% |
| Dell Inspiron 16 Plus 7630 Intel Core i7-13700H, NVIDIA GeForce RTX 4060 Laptop GPU | 88.9 fps +19% |
| Asus ROG Zephyrus G14 GA402RJ AMD Ryzen 7 6800HS, AMD Radeon RX 6700S | 78.6 fps +5% |
| Framework Laptop 16 AMD Ryzen 9 7940HS, AMD Radeon RX 7700S | 74.8 fps |
| Average AMD Radeon RX 7700S (n=1) | 74.8 fps 0% |
| Lenovo ThinkPad Z16 Gen 2 AMD Ryzen 9 PRO 7940HS, AMD Radeon RX 6550M | 47.8 fps -36% |
| MSI Prestige 16 B1MG-001US Intel Core Ultra 7 155H, Intel Arc 8-Core iGPU | 24.6 fps -67% |
| Acer Swift Edge SFE16 Ryzen 7 7840U AMD Ryzen 7 7840U, AMD Radeon 780M | 21.2 fps -72% |
| Acer Swift Edge SFE16-42-R1GM AMD Ryzen 7 7735U, AMD Radeon 680M | 19.3 fps -74% |
| HP Spectre x360 2-in-1 16-f1075ng Intel Core i7-12700H, Intel Iris Xe Graphics G7 96EUs | 14.6 fps -80% |
| 2560x1440 High Quality | |
| Asus Zephyrus Duo 16 GX650PY-NM006W AMD Ryzen 9 7945HX, NVIDIA GeForce RTX 4090 Laptop GPU | 142.1 fps +161% |
| Alienware m16 R1 AMD AMD Ryzen 9 7845HX, NVIDIA GeForce RTX 4080 Laptop GPU | 131.6 fps +141% |
| Alienware m18 R1 AMD AMD Ryzen 9 7945HX, AMD Radeon RX 7900M | 114.6 fps +110% |
| MSI Stealth 16 Mercedes-AMG Motorsport A13VG Intel Core i9-13900H, NVIDIA GeForce RTX 4070 Laptop GPU | 74.1 fps +36% |
| Dell Inspiron 16 Plus 7630 Intel Core i7-13700H, NVIDIA GeForce RTX 4060 Laptop GPU | 64.4 fps +18% |
| Framework Laptop 16 AMD Ryzen 9 7940HS, AMD Radeon RX 7700S | 54.5 fps |
| Average AMD Radeon RX 7700S (n=1) | 54.5 fps 0% |
| Lenovo ThinkPad Z16 Gen 2 AMD Ryzen 9 PRO 7940HS, AMD Radeon RX 6550M | 31.2 fps -43% |
| HP Spectre x360 2-in-1 16-f1075ng Intel Core i7-12700H, Intel Iris Xe Graphics G7 96EUs | 10.3 fps -81% |
| 3840x2160 High Quality | |
| Alienware m16 R1 AMD AMD Ryzen 9 7845HX, NVIDIA GeForce RTX 4080 Laptop GPU | 76.1 fps +162% |
| Alienware m18 R1 AMD AMD Ryzen 9 7945HX, AMD Radeon RX 7900M | 69.3 fps +139% |
| Framework Laptop 16 AMD Ryzen 9 7940HS, AMD Radeon RX 7700S | 29 fps |
| Average AMD Radeon RX 7700S (n=1) | 29 fps 0% |
| X-Plane 11.11 | |
| 1920x1080 med (fps_test=2) | |
| Asus Zephyrus Duo 16 GX650PY-NM006W AMD Ryzen 9 7945HX, NVIDIA GeForce RTX 4090 Laptop GPU | 155.7 fps +96% |
| Alienware m16 R1 AMD AMD Ryzen 9 7845HX, NVIDIA GeForce RTX 4080 Laptop GPU | 149 fps +88% |
| Dell Inspiron 16 Plus 7630 Intel Core i7-13700H, NVIDIA GeForce RTX 4060 Laptop GPU | 135.7 fps +71% |
| MSI Stealth 16 Mercedes-AMG Motorsport A13VG Intel Core i9-13900H, NVIDIA GeForce RTX 4070 Laptop GPU | 118.1 fps +49% |
| Lenovo Legion Slim 7 16APH8 AMD Ryzen 7 7840HS, NVIDIA GeForce RTX 4060 Laptop GPU | 103.5 fps +31% |
| Framework Laptop 16 AMD Ryzen 9 7940HS, AMD Radeon RX 7700S | 79.3 fps |
| Average AMD Radeon RX 7700S (n=1) | 79.3 fps 0% |
| Asus ROG Zephyrus G14 GA402RJ AMD Ryzen 7 6800HS, AMD Radeon RX 6700S | 51.7 fps -35% |
| MSI Prestige 16 B1MG-001US Intel Core Ultra 7 155H, Intel Arc 8-Core iGPU | 46.7 fps -41% |
| HP Spectre x360 2-in-1 16-f1075ng Intel Core i7-12700H, Intel Iris Xe Graphics G7 96EUs | 44.4 fps -44% |
| Lenovo ThinkPad Z16 Gen 2 AMD Ryzen 9 PRO 7940HS, AMD Radeon RX 6550M | 41.2 fps -48% |
| Acer Swift Edge SFE16 Ryzen 7 7840U AMD Ryzen 7 7840U, AMD Radeon 780M | 37 fps -53% |
| Acer Swift Edge SFE16-42-R1GM AMD Ryzen 7 7735U, AMD Radeon 680M | 36.6 fps -54% |
| 1920x1080 high (fps_test=3) | |
| Asus Zephyrus Duo 16 GX650PY-NM006W AMD Ryzen 9 7945HX, NVIDIA GeForce RTX 4090 Laptop GPU | 117.8 fps +81% |
| Alienware m16 R1 AMD AMD Ryzen 9 7845HX, NVIDIA GeForce RTX 4080 Laptop GPU | 113.1 fps +74% |
| Dell Inspiron 16 Plus 7630 Intel Core i7-13700H, NVIDIA GeForce RTX 4060 Laptop GPU | 109.7 fps +69% |
| MSI Stealth 16 Mercedes-AMG Motorsport A13VG Intel Core i9-13900H, NVIDIA GeForce RTX 4070 Laptop GPU | 98 fps +51% |
| Alienware m18 R1 AMD AMD Ryzen 9 7945HX, AMD Radeon RX 7900M | 83.7 fps +29% |
| Lenovo Legion Slim 7 16APH8 AMD Ryzen 7 7840HS, NVIDIA GeForce RTX 4060 Laptop GPU | 81.6 fps +26% |
| Framework Laptop 16 AMD Ryzen 9 7940HS, AMD Radeon RX 7700S | 65 fps |
| Average AMD Radeon RX 7700S (n=1) | 65 fps 0% |
| Asus ROG Zephyrus G14 GA402RJ AMD Ryzen 7 6800HS, AMD Radeon RX 6700S | 45.2 fps -30% |
| HP Spectre x360 2-in-1 16-f1075ng Intel Core i7-12700H, Intel Iris Xe Graphics G7 96EUs | 40.1 fps -38% |
| MSI Prestige 16 B1MG-001US Intel Core Ultra 7 155H, Intel Arc 8-Core iGPU | 37.8 fps -42% |
| Lenovo ThinkPad Z16 Gen 2 AMD Ryzen 9 PRO 7940HS, AMD Radeon RX 6550M | 33 fps -49% |
| Acer Swift Edge SFE16 Ryzen 7 7840U AMD Ryzen 7 7840U, AMD Radeon 780M | 30.3 fps -53% |
| Acer Swift Edge SFE16-42-R1GM AMD Ryzen 7 7735U, AMD Radeon 680M | 30.2 fps -54% |
| 3840x2160 high (fps_test=3) | |
| Alienware m16 R1 AMD AMD Ryzen 9 7845HX, NVIDIA GeForce RTX 4080 Laptop GPU | 95 fps +103% |
| Alienware m18 R1 AMD AMD Ryzen 9 7945HX, AMD Radeon RX 7900M | 64.3 fps +37% |
| Framework Laptop 16 AMD Ryzen 9 7940HS, AMD Radeon RX 7700S | 46.8 fps |
| Average AMD Radeon RX 7700S (n=1) | 46.8 fps 0% |
| Far Cry 5 | |
| 1920x1080 High Preset AA:T | |
| Alienware m16 R1 AMD AMD Ryzen 9 7845HX, NVIDIA GeForce RTX 4080 Laptop GPU | 141 (112min) fps +15% |
| Framework Laptop 16 AMD Ryzen 9 7940HS, AMD Radeon RX 7700S | 123 (106min) fps |
| Average AMD Radeon RX 7700S (n=1) | 123 fps 0% |
| Dell Inspiron 16 Plus 7630 Intel Core i7-13700H, NVIDIA GeForce RTX 4060 Laptop GPU | 115 (74min) fps -7% |
| Asus ROG Zephyrus G14 GA402RJ AMD Ryzen 7 6800HS, AMD Radeon RX 6700S | 103 (76min) fps -16% |
| Lenovo ThinkPad Z16 Gen 2 AMD Ryzen 9 PRO 7940HS, AMD Radeon RX 6550M | 84 (74min) fps -32% |
| Apple MacBook Pro 16 2023 M3 Max Apple M3 Max 16-Core, Apple M3 Max 40-Core GPU | 54 fps -56% |
| MSI Prestige 16 B1MG-001US Intel Core Ultra 7 155H, Intel Arc 8-Core iGPU | 36 (14min) fps -71% |
| Acer Swift Edge SFE16-42-R1GM AMD Ryzen 7 7735U, AMD Radeon 680M | 31 (10min) fps -75% |
| Acer Swift Edge SFE16 Ryzen 7 7840U AMD Ryzen 7 7840U, AMD Radeon 780M | 26 (16min) fps -79% |
| HP Spectre x360 2-in-1 16-f1075ng Intel Core i7-12700H, Intel Iris Xe Graphics G7 96EUs | 22 (20min) fps -82% |
| 1920x1080 Ultra Preset AA:T | |
| Alienware m16 R1 AMD AMD Ryzen 9 7845HX, NVIDIA GeForce RTX 4080 Laptop GPU | 136 (35min) fps +16% |
| Alienware m18 R1 AMD AMD Ryzen 9 7945HX, AMD Radeon RX 7900M | 128 (92min) fps +9% |
| Framework Laptop 16 AMD Ryzen 9 7940HS, AMD Radeon RX 7700S | 117 (96min) fps |
| Average AMD Radeon RX 7700S (n=1) | 117 fps 0% |
| Dell Inspiron 16 Plus 7630 Intel Core i7-13700H, NVIDIA GeForce RTX 4060 Laptop GPU | 103 (74min) fps -12% |
| Asus ROG Zephyrus G14 GA402RJ AMD Ryzen 7 6800HS, AMD Radeon RX 6700S | 97 (70min) fps -17% |
| Lenovo ThinkPad Z16 Gen 2 AMD Ryzen 9 PRO 7940HS, AMD Radeon RX 6550M | 79 (70min) fps -32% |
| Apple MacBook Pro 16 2023 M3 Max Apple M3 Max 16-Core, Apple M3 Max 40-Core GPU | 50 fps -57% |
| MSI Prestige 16 B1MG-001US Intel Core Ultra 7 155H, Intel Arc 8-Core iGPU | 34 (22min) fps -71% |
| Acer Swift Edge SFE16-42-R1GM AMD Ryzen 7 7735U, AMD Radeon 680M | 28 (17min) fps -76% |
| Acer Swift Edge SFE16 Ryzen 7 7840U AMD Ryzen 7 7840U, AMD Radeon 780M | 24 (22min) fps -79% |
| HP Spectre x360 2-in-1 16-f1075ng Intel Core i7-12700H, Intel Iris Xe Graphics G7 96EUs | 20 (18min) fps -83% |
| 2560x1440 Ultra Preset AA:T | |
| Alienware m16 R1 AMD AMD Ryzen 9 7845HX, NVIDIA GeForce RTX 4080 Laptop GPU | 131 (101min) fps +62% |
| Alienware m18 R1 AMD AMD Ryzen 9 7945HX, AMD Radeon RX 7900M | 123 (89min) fps +52% |
| Dell Inspiron 16 Plus 7630 Intel Core i7-13700H, NVIDIA GeForce RTX 4060 Laptop GPU | 83 (74min) fps +2% |
| Framework Laptop 16 AMD Ryzen 9 7940HS, AMD Radeon RX 7700S | 81 (65min) fps |
| Average AMD Radeon RX 7700S (n=1) | 81 fps 0% |
| Asus ROG Zephyrus G14 GA402RJ AMD Ryzen 7 6800HS, AMD Radeon RX 6700S | 79 (69min) fps -2% |
| Apple MacBook Pro 16 2023 M3 Max Apple M3 Max 16-Core, Apple M3 Max 40-Core GPU | 49 fps -40% |
| HP Spectre x360 2-in-1 16-f1075ng Intel Core i7-12700H, Intel Iris Xe Graphics G7 96EUs | 13 (11min) fps -84% |
| 3840x2160 Ultra Preset AA:T | |
| Alienware m18 R1 AMD AMD Ryzen 9 7945HX, AMD Radeon RX 7900M | 103 (91min) fps +164% |
| Alienware m16 R1 AMD AMD Ryzen 9 7845HX, NVIDIA GeForce RTX 4080 Laptop GPU | 91 (80min) fps +133% |
| Framework Laptop 16 AMD Ryzen 9 7940HS, AMD Radeon RX 7700S | 39 (34min) fps |
| Average AMD Radeon RX 7700S (n=1) | 39 fps 0% |
| Strange Brigade | |
| 1920x1080 high AA:high AF:8 | |
| Alienware m16 R1 AMD AMD Ryzen 9 7845HX, NVIDIA GeForce RTX 4080 Laptop GPU | 400 (149.3min, 286P1) fps +139% |
| Asus Zephyrus Duo 16 GX650PY-NM006W AMD Ryzen 9 7945HX, NVIDIA GeForce RTX 4090 Laptop GPU | 370 (58.3min, 253P1) fps +121% |
| MSI Stealth 16 Mercedes-AMG Motorsport A13VG Intel Core i9-13900H, NVIDIA GeForce RTX 4070 Laptop GPU | 220 (97.6min, 163P1) fps +31% |
| Lenovo Legion Slim 7 16APH8 AMD Ryzen 7 7840HS, NVIDIA GeForce RTX 4060 Laptop GPU | 208 (43.1min, 149.7P1) fps +24% |
| Dell Inspiron 16 Plus 7630 Intel Core i7-13700H, NVIDIA GeForce RTX 4060 Laptop GPU | 185.9 (60.8min, 136.8P1) fps +11% |
| Asus ROG Zephyrus G14 GA402RJ AMD Ryzen 7 6800HS, AMD Radeon RX 6700S | 182.7 (120.8min, 132.5P1) fps +9% |
| Framework Laptop 16 AMD Ryzen 9 7940HS, AMD Radeon RX 7700S | 167.4 (88.3min, 121P1) fps |
| Average AMD Radeon RX 7700S (n=1) | 167.4 fps 0% |
| Lenovo ThinkPad Z16 Gen 2 AMD Ryzen 9 PRO 7940HS, AMD Radeon RX 6550M | 101.1 (76.4min, 80.5P1) fps -40% |
| MSI Prestige 16 B1MG-001US Intel Core Ultra 7 155H, Intel Arc 8-Core iGPU | 57.8 (8.4min, 44.7P1) fps -65% |
| Acer Swift Edge SFE16 Ryzen 7 7840U AMD Ryzen 7 7840U, AMD Radeon 780M | 49.5 (8min, 13.9P1) fps -70% |
| Acer Swift Edge SFE16-42-R1GM AMD Ryzen 7 7735U, AMD Radeon 680M | 44.9 (7.8min, 12.1P1) fps -73% |
| HP Spectre x360 2-in-1 16-f1075ng Intel Core i7-12700H, Intel Iris Xe Graphics G7 96EUs | 29.6 (10.8min, 15.8P1) fps -82% |
| 1920x1080 ultra AA:ultra AF:16 | |
| Alienware m16 R1 AMD AMD Ryzen 9 7845HX, NVIDIA GeForce RTX 4080 Laptop GPU | 357 (82.8min, 253P1) fps +148% |
| Alienware m18 R1 AMD AMD Ryzen 9 7945HX, AMD Radeon RX 7900M | 344 (145.8min, 227P1) fps +139% |
| Asus Zephyrus Duo 16 GX650PY-NM006W AMD Ryzen 9 7945HX, NVIDIA GeForce RTX 4090 Laptop GPU | 333 (38min, 227P1) fps +131% |
| MSI Stealth 16 Mercedes-AMG Motorsport A13VG Intel Core i9-13900H, NVIDIA GeForce RTX 4070 Laptop GPU | 190.6 (88.3min, 142.9P1) fps +32% |
| Lenovo Legion Slim 7 16APH8 AMD Ryzen 7 7840HS, NVIDIA GeForce RTX 4060 Laptop GPU | 180.8 (22.8min, 134P1) fps +26% |
| Dell Inspiron 16 Plus 7630 Intel Core i7-13700H, NVIDIA GeForce RTX 4060 Laptop GPU | 161 (79.8min, 120.7P1) fps +12% |
| Asus ROG Zephyrus G14 GA402RJ AMD Ryzen 7 6800HS, AMD Radeon RX 6700S | 157.3 (108.2min, 113.2P1) fps +9% |
| Framework Laptop 16 AMD Ryzen 9 7940HS, AMD Radeon RX 7700S | 143.9 (84.9min, 104.3P1) fps |
| Average AMD Radeon RX 7700S (n=1) | 143.9 fps 0% |
| Lenovo ThinkPad Z16 Gen 2 AMD Ryzen 9 PRO 7940HS, AMD Radeon RX 6550M | 88.4 (66.9min, 70.8P1) fps -39% |
| MSI Prestige 16 B1MG-001US Intel Core Ultra 7 155H, Intel Arc 8-Core iGPU | 46.1 (5min, 20.8P1) fps -68% |
| Acer Swift Edge SFE16 Ryzen 7 7840U AMD Ryzen 7 7840U, AMD Radeon 780M | 41.3 (7.5min, 9.37P1) fps -71% |
| Acer Swift Edge SFE16-42-R1GM AMD Ryzen 7 7735U, AMD Radeon 680M | 36.4 (6.6min, 8.1P1) fps -75% |
| HP Spectre x360 2-in-1 16-f1075ng Intel Core i7-12700H, Intel Iris Xe Graphics G7 96EUs | 23.7 (7.7min, 9.06P1) fps -84% |
| 2560x1440 ultra AA:ultra AF:16 | |
| Asus Zephyrus Duo 16 GX650PY-NM006W AMD Ryzen 9 7945HX, NVIDIA GeForce RTX 4090 Laptop GPU | 257 (110.2min, 192.1P1) fps +180% |
| Alienware m18 R1 AMD AMD Ryzen 9 7945HX, AMD Radeon RX 7900M | 249 (137.9min, 183.7P1) fps +171% |
| Alienware m16 R1 AMD AMD Ryzen 9 7845HX, NVIDIA GeForce RTX 4080 Laptop GPU | 248 (25.5min, 194.6P1) fps +170% |
| MSI Stealth 16 Mercedes-AMG Motorsport A13VG Intel Core i9-13900H, NVIDIA GeForce RTX 4070 Laptop GPU | 126.3 (26min, 103.5P1) fps +37% |
| Dell Inspiron 16 Plus 7630 Intel Core i7-13700H, NVIDIA GeForce RTX 4060 Laptop GPU | 110.9 (68.7min, 89.9P1) fps +21% |
| Framework Laptop 16 AMD Ryzen 9 7940HS, AMD Radeon RX 7700S | 91.9 (66min, 75.1P1) fps |
| Average AMD Radeon RX 7700S (n=1) | 91.9 fps 0% |
| 3840x2160 ultra AA:ultra AF:16 | |
| Alienware m18 R1 AMD AMD Ryzen 9 7945HX, AMD Radeon RX 7900M | 130.5 (79.1min, 110.9P1) fps +172% |
| Alienware m16 R1 AMD AMD Ryzen 9 7845HX, NVIDIA GeForce RTX 4080 Laptop GPU | 123.1 (11.1min, 107.1P1) fps +157% |
| Framework Laptop 16 AMD Ryzen 9 7940HS, AMD Radeon RX 7700S | 47.9 (38.8min, 42.4P1) fps |
| Average AMD Radeon RX 7700S (n=1) | 47.9 fps 0% |
| Tiny Tina's Wonderlands | |
| 1920x1080 High Preset (DX12) | |
| Alienware m16 R1 AMD AMD Ryzen 9 7845HX, NVIDIA GeForce RTX 4080 Laptop GPU | 201.1 fps +119% |
| Dell Inspiron 16 Plus 7630 Intel Core i7-13700H, NVIDIA GeForce RTX 4060 Laptop GPU | 92.1 fps 0% |
| Framework Laptop 16 AMD Ryzen 9 7940HS, AMD Radeon RX 7700S | 92 fps |
| Average AMD Radeon RX 7700S (n=1) | 92 fps 0% |
| Asus ROG Zephyrus G14 GA402RJ AMD Ryzen 7 6800HS, AMD Radeon RX 6700S | 82.4 fps -10% |
| Lenovo ThinkPad Z16 Gen 2 AMD Ryzen 9 PRO 7940HS, AMD Radeon RX 6550M | 59.7 fps -35% |
| MSI Prestige 16 B1MG-001US Intel Core Ultra 7 155H, Intel Arc 8-Core iGPU | 30.1 fps -67% |
| Acer Swift Edge SFE16-42-R1GM AMD Ryzen 7 7735U, AMD Radeon 680M | 19.8 fps -78% |
| Acer Swift Edge SFE16 Ryzen 7 7840U AMD Ryzen 7 7840U, AMD Radeon 780M | 18.6 fps -80% |
| 1920x1080 Badass Preset (DX12) | |
| Asus Zephyrus Duo 16 GX650PY-NM006W AMD Ryzen 9 7945HX, NVIDIA GeForce RTX 4090 Laptop GPU | 171.5 fps +141% |
| Alienware m16 R1 AMD AMD Ryzen 9 7845HX, NVIDIA GeForce RTX 4080 Laptop GPU | 160.8 fps +126% |
| Alienware m18 R1 AMD AMD Ryzen 9 7945HX, AMD Radeon RX 7900M | 150.2 fps +111% |
| Dell Inspiron 16 Plus 7630 Intel Core i7-13700H, NVIDIA GeForce RTX 4060 Laptop GPU | 71.4 fps 0% |
| Framework Laptop 16 AMD Ryzen 9 7940HS, AMD Radeon RX 7700S | 71.2 fps |
| Average AMD Radeon RX 7700S (n=1) | 71.2 fps 0% |
| Asus ROG Zephyrus G14 GA402RJ AMD Ryzen 7 6800HS, AMD Radeon RX 6700S | 62.4 fps -12% |
| Lenovo ThinkPad Z16 Gen 2 AMD Ryzen 9 PRO 7940HS, AMD Radeon RX 6550M | 30.3 fps -57% |
| MSI Prestige 16 B1MG-001US Intel Core Ultra 7 155H, Intel Arc 8-Core iGPU | 25.1 fps -65% |
| Acer Swift Edge SFE16 Ryzen 7 7840U AMD Ryzen 7 7840U, AMD Radeon 780M | 16.5 fps -77% |
| Acer Swift Edge SFE16-42-R1GM AMD Ryzen 7 7735U, AMD Radeon 680M | 16 fps -78% |
| 2560x1440 Badass Preset (DX12) | |
| Asus Zephyrus Duo 16 GX650PY-NM006W AMD Ryzen 9 7945HX, NVIDIA GeForce RTX 4090 Laptop GPU | 120 fps +154% |
| Alienware m16 R1 AMD AMD Ryzen 9 7845HX, NVIDIA GeForce RTX 4080 Laptop GPU | 112.9 fps +139% |
| Alienware m18 R1 AMD AMD Ryzen 9 7945HX, AMD Radeon RX 7900M | 106.8 fps +126% |
| Dell Inspiron 16 Plus 7630 Intel Core i7-13700H, NVIDIA GeForce RTX 4060 Laptop GPU | 48 fps +1% |
| Framework Laptop 16 AMD Ryzen 9 7940HS, AMD Radeon RX 7700S | 47.3 fps |
| Average AMD Radeon RX 7700S (n=1) | 47.3 fps 0% |
| Asus ROG Zephyrus G14 GA402RJ AMD Ryzen 7 6800HS, AMD Radeon RX 6700S | 39.1 fps -17% |
| Lenovo ThinkPad Z16 Gen 2 AMD Ryzen 9 PRO 7940HS, AMD Radeon RX 6550M | 27.2 fps -42% |
| 3840x2160 Badass Preset (DX12) | |
| Alienware m16 R1 AMD AMD Ryzen 9 7845HX, NVIDIA GeForce RTX 4080 Laptop GPU | 59 fps +155% |
| Alienware m18 R1 AMD AMD Ryzen 9 7945HX, AMD Radeon RX 7900M | 56 fps +142% |
| Framework Laptop 16 AMD Ryzen 9 7940HS, AMD Radeon RX 7700S | 23.1 fps |
| Average AMD Radeon RX 7700S (n=1) | 23.1 fps 0% |
| Cyberpunk 2077 | |
| 1280x720 Low Preset (FSR off) | |
| Framework Laptop 16 AMD Ryzen 9 7940HS, AMD Radeon RX 7700S | 150.2 (73.1min) fps |
| Average AMD Radeon RX 7700S (n=1) | 150.2 fps 0% |
| Lenovo ThinkPad Z16 Gen 2 AMD Ryzen 9 PRO 7940HS, AMD Radeon RX 6550M | 99.1 (61.6min) fps -34% |
| MSI Prestige 16 B1MG-001US Intel Core Ultra 7 155H, Intel Arc 8-Core iGPU | 53.8 (17.4min) fps -64% |
| 1920x1080 Low Preset (FSR off) | |
| Framework Laptop 16 AMD Ryzen 9 7940HS, AMD Radeon RX 7700S | 100.7 (55.4min) fps |
| Average AMD Radeon RX 7700S (n=1) | 100.7 fps 0% |
| Lenovo ThinkPad Z16 Gen 2 AMD Ryzen 9 PRO 7940HS, AMD Radeon RX 6550M | 62.8 (41.5min) fps -38% |
| Apple MacBook Pro 16 2023 M3 Max Apple M3 Max 16-Core, Apple M3 Max 40-Core GPU | 45 fps -55% |
| MSI Prestige 16 B1MG-001US Intel Core Ultra 7 155H, Intel Arc 8-Core iGPU | 35.7 (18.6min) fps -65% |
| 1920x1080 Medium Preset (FSR off) | |
| Framework Laptop 16 AMD Ryzen 9 7940HS, AMD Radeon RX 7700S | 80.5 (59.6min) fps |
| Average AMD Radeon RX 7700S (n=1) | 80.5 fps 0% |
| Lenovo ThinkPad Z16 Gen 2 AMD Ryzen 9 PRO 7940HS, AMD Radeon RX 6550M | 45.9 (34.5min) fps -43% |
| Apple MacBook Pro 16 2023 M3 Max Apple M3 Max 16-Core, Apple M3 Max 40-Core GPU | 44 fps -45% |
| MSI Prestige 16 B1MG-001US Intel Core Ultra 7 155H, Intel Arc 8-Core iGPU | 29.5 (16.9min) fps -63% |
| 1920x1080 High Preset (FSR off) | |
| Alienware m18 R1 AMD AMD Ryzen 9 7945HX, AMD Radeon RX 7900M | 130.7 (21.1min) fps +92% |
| Framework Laptop 16 AMD Ryzen 9 7940HS, AMD Radeon RX 7700S | 68.1 (47.8min) fps |
| Average AMD Radeon RX 7700S (n=1) | 68.1 fps 0% |
| Apple MacBook Pro 16 2023 M3 Max Apple M3 Max 16-Core, Apple M3 Max 40-Core GPU | 43.7 fps -36% |
| Lenovo ThinkPad Z16 Gen 2 AMD Ryzen 9 PRO 7940HS, AMD Radeon RX 6550M | 34.7 (15.3min) fps -49% |
| MSI Prestige 16 B1MG-001US Intel Core Ultra 7 155H, Intel Arc 8-Core iGPU | 25.2 (11.7min) fps -63% |
| 1920x1080 Ultra Preset (FSR off) | |
| Alienware m18 R1 AMD AMD Ryzen 9 7945HX, AMD Radeon RX 7900M | 129.6 (54.1min) fps +114% |
| Framework Laptop 16 AMD Ryzen 9 7940HS, AMD Radeon RX 7700S | 60.7 (46.5min) fps |
| Average AMD Radeon RX 7700S (n=1) | 60.7 fps 0% |
| Apple MacBook Pro 16 2023 M3 Max Apple M3 Max 16-Core, Apple M3 Max 40-Core GPU | 42.8 fps -29% |
| Lenovo ThinkPad Z16 Gen 2 AMD Ryzen 9 PRO 7940HS, AMD Radeon RX 6550M | 28.6 (13.3min) fps -53% |
| MSI Prestige 16 B1MG-001US Intel Core Ultra 7 155H, Intel Arc 8-Core iGPU | 22.1 (7.2min) fps -64% |
| 2560x1440 Ultra Preset (FSR off) | |
| Alienware m18 R1 AMD AMD Ryzen 9 7945HX, AMD Radeon RX 7900M | 85.2 (59.4min) fps +128% |
| Apple MacBook Pro 16 2023 M3 Max Apple M3 Max 16-Core, Apple M3 Max 40-Core GPU | 37.4 fps 0% |
| Framework Laptop 16 AMD Ryzen 9 7940HS, AMD Radeon RX 7700S | 37.3 (30.7min) fps |
| Average AMD Radeon RX 7700S (n=1) | 37.3 fps 0% |
| Lenovo ThinkPad Z16 Gen 2 AMD Ryzen 9 PRO 7940HS, AMD Radeon RX 6550M | 17.3 (7.15min) fps -54% |
| 3840x2160 Ultra Preset (FSR off) | |
| Alienware m18 R1 AMD AMD Ryzen 9 7945HX, AMD Radeon RX 7900M | 37.7 (28.5min) fps +139% |
| Framework Laptop 16 AMD Ryzen 9 7940HS, AMD Radeon RX 7700S | 15.8 (12.9min) fps |
| Average AMD Radeon RX 7700S (n=1) | 15.8 fps 0% |
| 1920x1080 Ray Tracing Ultra Preset (DLSS off) | |
| Alienware m18 R1 AMD AMD Ryzen 9 7945HX, AMD Radeon RX 7900M | 42.5 (32.6min) fps +141% |
| Framework Laptop 16 AMD Ryzen 9 7940HS, AMD Radeon RX 7700S | 17.6 (13.5min) fps |
| Average AMD Radeon RX 7700S (n=1) | 17.6 fps 0% |
| Lenovo ThinkPad Z16 Gen 2 AMD Ryzen 9 PRO 7940HS, AMD Radeon RX 6550M | 4.76 (2.99min) fps -73% |
Performance-per-watt when running Witcher 3 on Ultra settings is comparable to a desktop GeForce RTX 4070 Ti or RTX 4080. Thus, the RDNA 3 GPU is at least efficient even if it's nowhere near as powerful as Nvidia's fastest. Meanwhile, the more competitive mobile RTX 4060 is still about 30 percent more efficient and this margin only increases in favor of Nvidia when running RT-enabled games.
| Power Consumption - Witcher 3 ultra Efficiency (external Monitor) | |
| NVIDIA GeForce RTX 4090 Laptop GPU MSI Titan GT77 HX 13VI, i9-13950HX | 0.796 fps per Watt +37% |
| NVIDIA GeForce RTX 4060 Laptop GPU Dell Inspiron 16 Plus 7630, i7-13700H | 0.753 fps per Watt +30% |
| NVIDIA GeForce RTX 4080 Laptop GPU Razer Blade 16 Early 2023, i9-13950HX | 0.71 fps per Watt +22% |
| NVIDIA GeForce RTX 3080 Ti Laptop GPU Alienware x15 R2 P111F, i9-12900H | 0.581 fps per Watt 0% |
| NVIDIA GeForce RTX 4080 KFA2 GeForce RTX 4080 SG, R9 7950X | 0.581 fps per Watt 0% |
| AMD Radeon RX 7700S Framework Laptop 16, R9 7940HS | 0.58 fps per Watt |
| NVIDIA GeForce RTX 4070 Ti KFA2 GeForce RTX 4070 Ti SG, R9 7950X | 0.548 fps per Watt -6% |
| NVIDIA GeForce RTX 3080 Ti Laptop GPU Schenker XMG Neo 17 M22, R9 6900HX | 0.545 fps per Watt -6% |
| NVIDIA GeForce RTX 3080 Ti Laptop GPU MSI Titan GT77 12UHS, i9-12900HX | 0.521 fps per Watt -10% |
| NVIDIA GeForce RTX 3080 Ti Laptop GPU Alienware x17 R2 P48E, i9-12900HK | 0.512 fps per Watt -12% |
| NVIDIA GeForce RTX 3090 Intel Core i5-13400F, i5-13400F | 0.3954 fps per Watt -32% |
| NVIDIA GeForce RTX 3080 Ti ASUS TUF Gaming GeForce RTX 3080 Ti OC, R9 7950X | 0.3496 fps per Watt -40% |
| NVIDIA GeForce RTX 3090 Ti Zotac Gaming GeForce RTX 3090 Ti AMP Extreme Holo, R7 5800X3D | 0.345 fps per Watt -41% |
Fan noise covers both extremes quite well in the sense that it can be very quiet when running undemanding loads and very loud when running more demanding loads like games. When simply browsing or video streaming, for example, fan noise would tend to hover around 28.5 dB(A) against a silent background of 23.8 dB(A) to be mostly inaudible. When running Witcher 3, however, fan noise can reach almost 52 dB(A) to be as loud as the competing Inspiron 16 Plus or some gaming laptops like the Razer Blade 16.
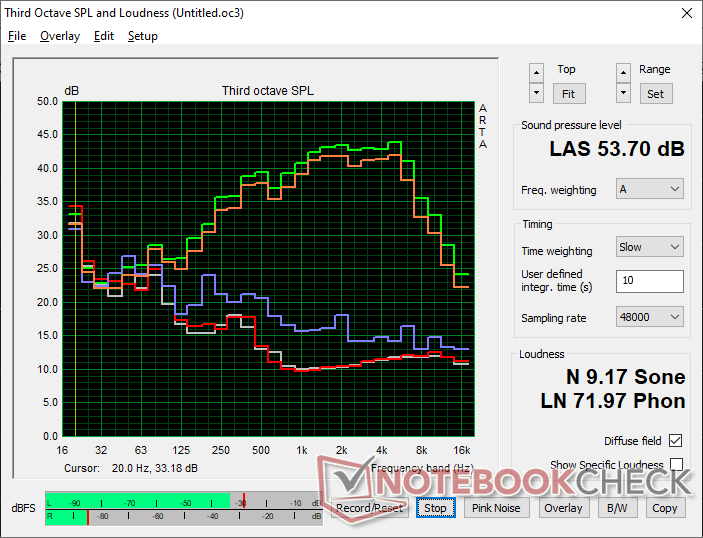
Noise level
| Idle | 23.9 / 23.9 / 23.9 dB(A) | |
| Load | 28.5 / 53.7 dB(A) | |
 | ||
30 dB 40 dB(A) 50 dB(A) |
||
min: | ||
| Framework Laptop 16 Radeon RX 7700S, R9 7940HS, WDC PC SN810 1TB | MSI Prestige 16 B1MG-001US Arc 8-Core, Ultra 7 155H, Samsung PM9A1 MZVL22T0HBLB | Lenovo ThinkPad Z16 Gen 2 Radeon RX 6550M, R9 PRO 7940HS, Kioxia XG8 KXG8AZNV1T02 | Apple MacBook Pro 16 2023 M3 Max M3 Max 40-Core GPU, Apple M3 Max 16-Core, Apple SSD AP8192Z | Dell Inspiron 16 Plus 7630 GeForce RTX 4060 Laptop GPU, i7-13700H, WD PC SN740 SDDPTQD-1T00 | HP Spectre x360 2-in-1 16-f1075ng Iris Xe G7 96EUs, i7-12700H, SK Hynix PC711 1TB HFS001TDE9X073N | |
|---|---|---|---|---|---|---|
| Noise | -6% | -5% | -0% | -1% | -6% | |
| off / environment * (dB) | 23.8 | 24.5 -3% | 22.6 5% | 23.7 -0% | 23.2 3% | 26 -9% |
| Idle Minimum * (dB) | 23.9 | 24.5 -3% | 22.9 4% | 23.7 1% | 23.2 3% | 26 -9% |
| Idle Average * (dB) | 23.9 | 26.3 -10% | 29.4 -23% | 23.7 1% | 23.2 3% | 26 -9% |
| Idle Maximum * (dB) | 23.9 | 26.3 -10% | 29.4 -23% | 23.7 1% | 23.2 3% | 26 -9% |
| Load Average * (dB) | 28.5 | 36.5 -28% | 29.5 -4% | 40.8 -43% | 35.1 -23% | 42.9 -51% |
| Witcher 3 ultra * (dB) | 51.9 | 46.3 11% | 52 -0% | 42.8 18% | 52.5 -1% | 42.9 17% |
| Load Maximum * (dB) | 53.7 | 52.9 1% | 52 3% | 42.8 20% | 52.5 2% | 39.1 27% |
* ... smaller is better
Surface temperatures are always warm owing to the metal chassis and lethargic fans. When running more demanding loads like games, hot spots can reach over 40 C on the top and bottom sides of the laptop base. Hot spots are closer to the center of the Laptop 16 whereas they are generally toward the rear on most other laptops. This means that you're more likely to notice the Framework system warming up during use when compared to something like the HP Spectre x360 16 where the palm rests and frontal areas tend to be cooler. Even so, we never found the Laptop 16 to be uncomfortably warm on the skin.
Keep in mind that the 180 W USB-C AC adapter is one of the smallest we've seen (~11.6 z 5.7 x 2.6 cm) for its power output. Its compact size is made possible by GaN transistors which is a technology that Razer also utilizes for its own AC adapters. The downside to GaN is that the adapters themselves can become very warm at over 60 C in our experience. In comparison, larger non-GaN chargers would typically range between 40 C to 50 C under load.
| |||||||||||||||||||||||||
| Maximum: 42.4 °C = 108 F Average: 36.2 °C = 97 F | |||||||||||||||||||||||||
| |||||||||||||||||||||||||
| Maximum: 40.8 °C = 105 F Average: 36.2 °C = 97 F | |||||||||||||||||||||||||
Power Supply (max.) 52.2 °C = 126 F | Room Temperature 20 °C = 68 F | Fluke 62 Mini IR Thermometer
| |||||||||||||||||||||||||
| Maximum: 31.4 °C = 89 F Average: 28.7 °C = 84 F | |||||||||||||||||||||||||
| |||||||||||||||||||||||||
| Maximum: 27.8 °C = 82 F Average: 26.6 °C = 80 F | |||||||||||||||||||||||||
Room Temperature 20 °C = 68 F | Fluke 62 Mini IR Thermometer
| |||||||||||||||||||||||||
| Maximum: 34.6 °C = 94 F Average: 30.2 °C = 86 F | |||||||||||||||||||||||||
| |||||||||||||||||||||||||
| Maximum: 45.8 °C = 114 F Average: 32.4 °C = 90 F | |||||||||||||||||||||||||
Power Supply (max.) 60.6 °C = 141 F | Room Temperature 20 °C = 68 F | Fluke 62 Mini IR Thermometer
(±) The average temperature for the upper side under maximal load is 36.2 °C / 97 F, compared to the average of 31.3 °C / 88 F for the devices in the class Multimedia.
(±) The maximum temperature on the upper side is 42.4 °C / 108 F, compared to the average of 36.8 °C / 98 F, ranging from 21 to 71 °C for the class Multimedia.
(±) The bottom heats up to a maximum of 40.8 °C / 105 F, compared to the average of 39.1 °C / 102 F
(+) In idle usage, the average temperature for the upper side is 28.7 °C / 84 F, compared to the device average of 31.3 °C / 88 F.
(+) Playing The Witcher 3, the average temperature for the upper side is 30.2 °C / 86 F, compared to the device average of 31.3 °C / 88 F.
(+) The palmrests and touchpad are reaching skin temperature as a maximum (33.2 °C / 91.8 F) and are therefore not hot.
(-) The average temperature of the palmrest area of similar devices was 28.7 °C / 83.7 F (-4.5 °C / -8.1 F).
The CPU would boost to 4.6 GHz and 80 W for the first couple of seconds when initiating Prime95 stress before quickly falling and stabilizing to 4.0 GHz, 54 W, and a toastier-than-expected 96 C. Repeating this same test on the Lenovo Slim Pro 9i 16 with the Core i9-13905H would result in a cooler core temperature of 82 C. This suggests that Framework would rather boost processor performance and limit throttling even it means higher average core temperatures which enthusiasts might appreciate.
The GPU would stabilize at 2363 MHz and 99 W when running Witcher 3 which means it can utilize its entire 100 W budget when gaming. Core temperature would remain decently low at 66 C compared to 62 C on the aforementioned GeForce-powered Lenovo.
| CPU Clock (GHz) | GPU Clock (MHz) | Average CPU Temperature (°C) | Average GPU Temperature (°C) | |
| System Idle | -- | -- | 32 | 41 |
| Prime95 Stress | 4.0 | -- | 96 | 30 |
| Prime95 + FurMark Stress | 4.0 | 1200 | 100 | 53 |
| Witcher 3 Stress | ~0.7 | 2363 | 56 | 66 |
Frequency diagram (checkboxes can be checked and unchecked to compare devices)
Framework Laptop 16 audio analysis
(±) | speaker loudness is average but good (80.2 dB)
Bass 100 - 315 Hz
(±) | reduced bass - on average 9.6% lower than median
(±) | linearity of bass is average (8.1% delta to prev. frequency)
Mids 400 - 2000 Hz
(+) | balanced mids - only 2.2% away from median
(+) | mids are linear (3.8% delta to prev. frequency)
Highs 2 - 16 kHz
(+) | balanced highs - only 2% away from median
(+) | highs are linear (4.9% delta to prev. frequency)
Overall 100 - 16.000 Hz
(+) | overall sound is linear (10.5% difference to median)
Compared to same class
» 16% of all tested devices in this class were better, 1% similar, 83% worse
» The best had a delta of 5%, average was 17%, worst was 45%
Compared to all devices tested
» 5% of all tested devices were better, 1% similar, 93% worse
» The best had a delta of 4%, average was 24%, worst was 134%
Apple MacBook Pro 16 2021 M1 Pro audio analysis
(+) | speakers can play relatively loud (84.7 dB)
Bass 100 - 315 Hz
(+) | good bass - only 3.8% away from median
(+) | bass is linear (5.2% delta to prev. frequency)
Mids 400 - 2000 Hz
(+) | balanced mids - only 1.3% away from median
(+) | mids are linear (2.1% delta to prev. frequency)
Highs 2 - 16 kHz
(+) | balanced highs - only 1.9% away from median
(+) | highs are linear (2.7% delta to prev. frequency)
Overall 100 - 16.000 Hz
(+) | overall sound is linear (4.6% difference to median)
Compared to same class
» 0% of all tested devices in this class were better, 0% similar, 100% worse
» The best had a delta of 5%, average was 17%, worst was 45%
Compared to all devices tested
» 0% of all tested devices were better, 0% similar, 100% worse
» The best had a delta of 4%, average was 24%, worst was 134%
Power consumption is comparable to the Dell Inspiron 16 Plus or MacBook Pro 16 2023 when idling or when running undemanding loads. When running higher loads like games, however, consumption would be higher than expected. Running Witcher 3 would demand 172 W compared to just 122 W on the RTX 4060-powered Inspiron 16 Plus. When considering that the RTX 4060 can frequently edge out the Radeon RX 7700S in many games, the GPU performance-per-watt of the Laptop 16 just isn't as good as Nvidia's alternative which backs up our claims made above.
The CPU can also be quite demanding with a systemwide consumption of 110 W when running Prime95 compared to only 75 W on the MSI Stealth 16 powered by the Core i9-13900H.
We're able to record a maximum draw of 176 W from the small 180 W USB-C AC adapter when running games or other extreme loads like Prime95 and FurMark. This is important to note because the limited AC adapter overhead can bottleneck the performance or charging capabilities of the laptop. In this case, the charge rate is impacted when running demanding loads. For example, we're able to observe the battery drain from 100% to 85% when connected to an outlet and running Witcher 3 meaning that it is not possible to charge the battery at a decent rate while running demanding loads simultaneously. Such a scenario would never occur on most other laptops.
| Framework Laptop 16 R9 7940HS, Radeon RX 7700S, WDC PC SN810 1TB, , 2560x1600, 16" | MSI Prestige 16 B1MG-001US Ultra 7 155H, Arc 8-Core, Samsung PM9A1 MZVL22T0HBLB, IPS, 2560x1600, 16" | Lenovo ThinkPad Z16 Gen 2 R9 PRO 7940HS, Radeon RX 6550M, Kioxia XG8 KXG8AZNV1T02, OLED, 3840x2400, 16" | Apple MacBook Pro 16 2023 M3 Max Apple M3 Max 16-Core, M3 Max 40-Core GPU, Apple SSD AP8192Z, Mini-LED, 3456x2234, 16" | Dell Inspiron 16 Plus 7630 i7-13700H, GeForce RTX 4060 Laptop GPU, WD PC SN740 SDDPTQD-1T00, IPS, 2560x1600, 16" | HP Spectre x360 2-in-1 16-f1075ng i7-12700H, Iris Xe G7 96EUs, SK Hynix PC711 1TB HFS001TDE9X073N, IPS, 3072x1920, 16" | |
|---|---|---|---|---|---|---|
| Power Consumption | 46% | 26% | 18% | -5% | 40% | |
| Idle Minimum * (Watt) | 9.5 | 3 68% | 7.5 21% | 5.2 45% | 15.6 -64% | 9 5% |
| Idle Average * (Watt) | 17 | 9.5 44% | 9.6 44% | 16.9 1% | 17.7 -4% | 11.1 35% |
| Idle Maximum * (Watt) | 17.2 | 12 30% | 18.5 -8% | 17.2 -0% | 20.6 -20% | 16.4 5% |
| Load Average * (Watt) | 96.2 | 68.3 29% | 57.1 41% | 90.5 6% | 87.4 9% | 38.3 60% |
| Witcher 3 ultra * (Watt) | 171.9 | 59.8 65% | 115.8 33% | 109 37% | 121.7 29% | 34.4 80% |
| Load Maximum * (Watt) | 175.7 | 104.8 40% | 131.7 25% | 145.2 17% | 138 21% | 82.5 53% |
* ... smaller is better
Framework Laptop 16 R9 7940HS, Radeon RX 7700S; Witcher 3 ultra: Ø171.9 (168.9-173.3) Watt
Framework Laptop 16 R9 7940HS, Radeon RX 7700S; 1280x720 Prime95 28.10 and Furmark 1.25: Ø174.9 (171.7-176) Watt
Lenovo Legion Slim 7 16APH8 R7 7840HS, GeForce RTX 4060 Laptop GPU; 1280x720 Prime95 28.10 and Furmark 1.25: Ø135.6 (102.3-176.9) Watt
Framework Laptop 16 R9 7940HS, Radeon RX 7700S; Idle 150cd/m2: Ø15.6 (14.7-17.9) Watt
Framework Laptop 16 R9 7940HS, Radeon RX 7700S; Prime95 V2810 Stress (external Monitor): Ø120.9 (108.6-148.6) Watt
Lenovo Legion Slim 7 16APH8 R7 7840HS, GeForce RTX 4060 Laptop GPU; Prime95 V2810 Stress (external Monitor): Ø93.3 (86.4-103.2) Watt
Framework Laptop 16 R9 7940HS, Radeon RX 7700S; Cinebench R15 Multi (external Monitor): Ø120.9 (113.5-130.2) Watt
Lenovo Legion Slim 7 16APH8 R7 7840HS, GeForce RTX 4060 Laptop GPU; Cinebench R23 Multi (external Monitor): Ø99.8 (88.5-104) Watt
Framework Laptop 16 R9 7940HS, Radeon RX 7700S; 1280x720 FurMark 1.19 GPU Stress Test (external Monitor): Ø167.5 (165.6-169.8) Watt
Lenovo Legion Slim 7 16APH8 R7 7840HS, GeForce RTX 4060 Laptop GPU; 1280x720 FurMark 1.19 GPU Stress Test (external Monitor): Ø117.8 (107.6-120.1) Watt
Framework Laptop 16 R9 7940HS, Radeon RX 7700S; 1920x1080 The Witcher 3 ultra (external Monitor): Ø171.3 (170.7-172) Watt
Lenovo Legion Slim 7 16APH8 R7 7840HS, GeForce RTX 4060 Laptop GPU; 1920x1080 The Witcher 3 ultra (external Monitor): Ø126.8 (116-135.3) Watt
Framework Laptop 16 R9 7940HS, Radeon RX 7700S; Idle 1min (external Monitor): Ø13.9 (13.1-16.5) Watt
Lenovo Legion Slim 7 16APH8 R7 7840HS, GeForce RTX 4060 Laptop GPU; Idle 1min (external Monitor): Ø17.6 (16.9-19.9) Watt
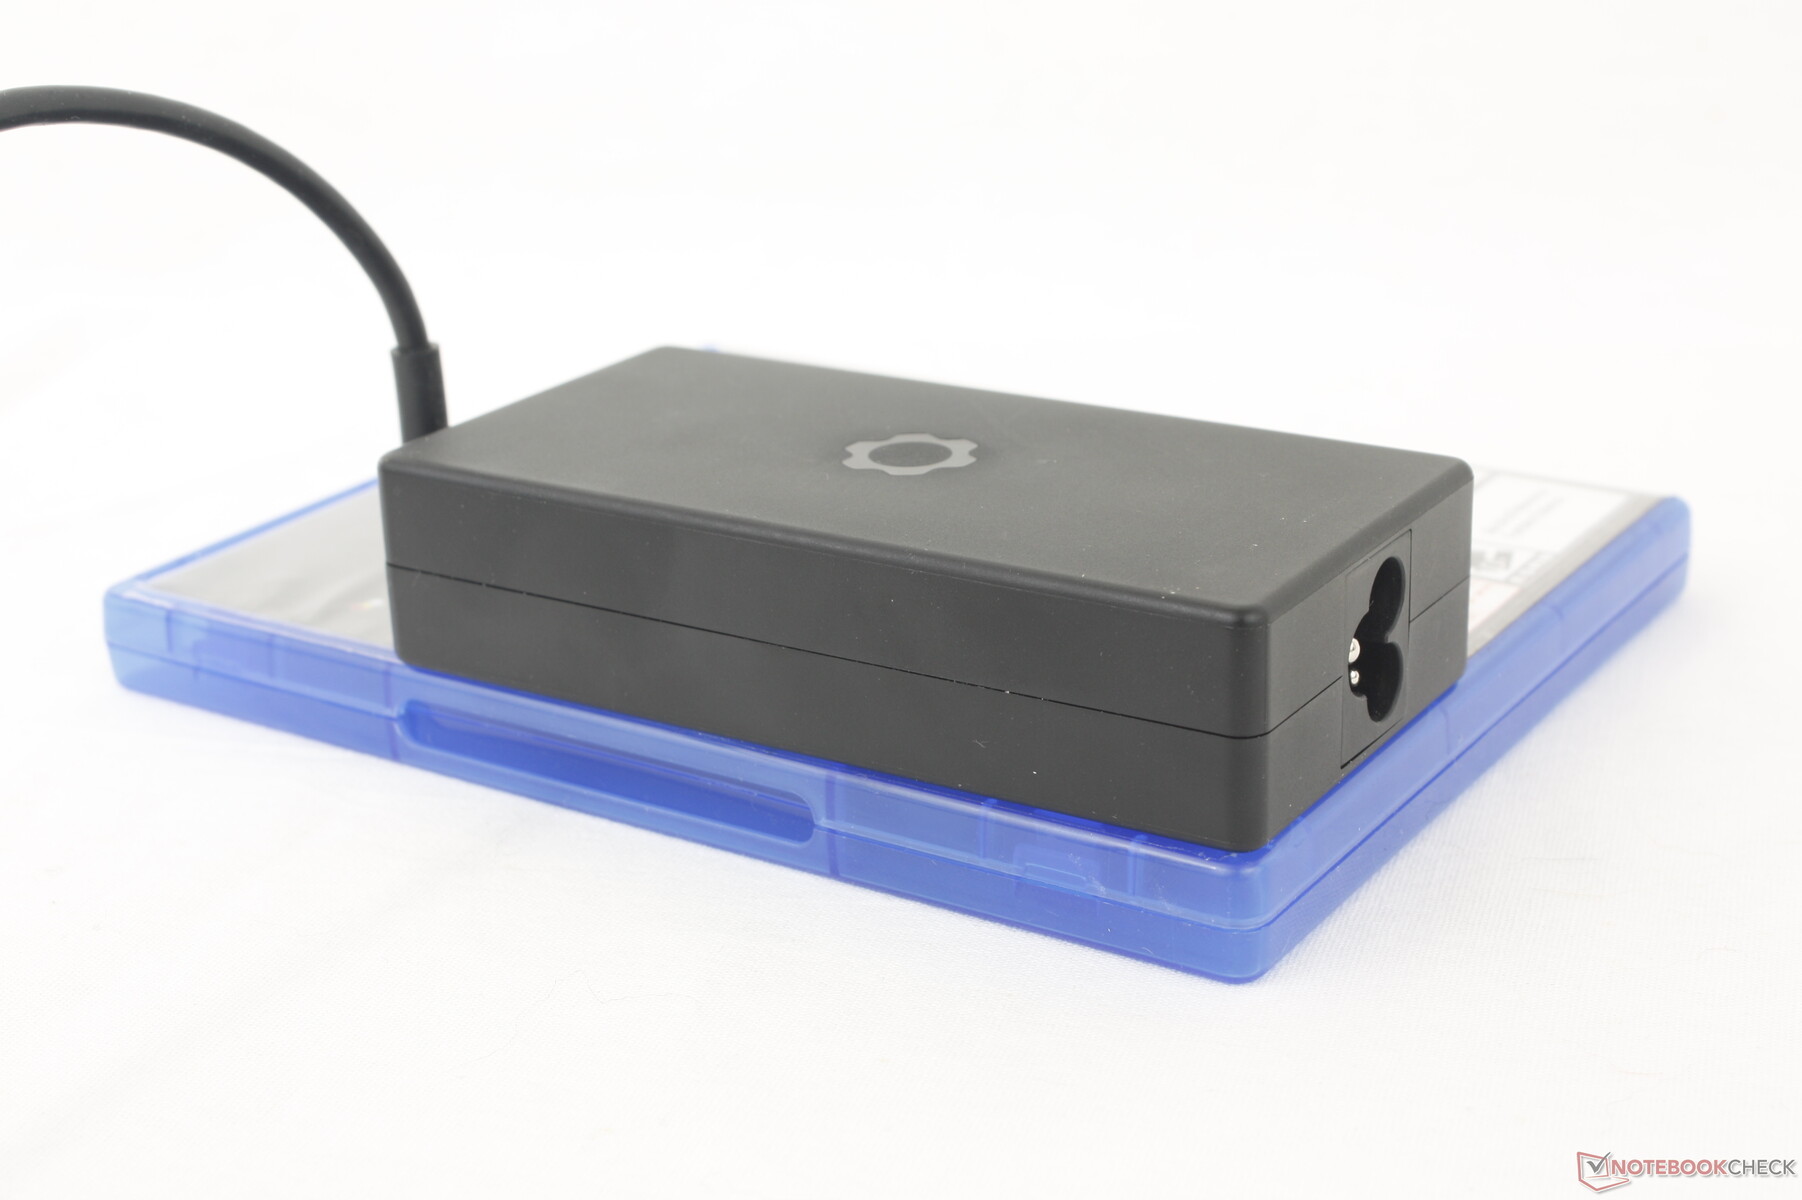
Battery life from the 85 Wh battery is respectable at just over 9 hours of real-world WLAN browsing to be similar to the Dell Inspiron 16 Plus 7630 or HP Spectre x360 2-in-1. We recommend setting the display to a variable refresh rate instead of its fixed and default 165 Hz to squeeze more out of the battery. When on the dynamic 83 Hz to 165 Hz setting, for example, we're able to last 20 minutes longer from the same WLAN test. Most smartphones employ this same technique to save on battery life.
Charging from empty to full capacity with the included AC adapter takes about 2 hours if idling on desktop or running undemanding loads. If running more extreme loads, however, the battery would charge much more slowly as mentioned above. A larger 240 W USB-C AC adapter could have potentially solved this issue.
Battery Runtime
| Idle (without WLAN, min brightness) | 14h 50min | |
| WiFi Websurfing | 9h 08min | |
| Load (maximum brightness) | 1h 32min |
| Framework Laptop 16 R9 7940HS, Radeon RX 7700S, 85 Wh | MSI Prestige 16 B1MG-001US Ultra 7 155H, Arc 8-Core, 99.9 Wh | Lenovo ThinkPad Z16 Gen 2 R9 PRO 7940HS, Radeon RX 6550M, 72 Wh | Apple MacBook Pro 16 2023 M3 Max Apple M3 Max 16-Core, M3 Max 40-Core GPU, 99.6 Wh | Dell Inspiron 16 Plus 7630 i7-13700H, GeForce RTX 4060 Laptop GPU, 86 Wh | HP Spectre x360 2-in-1 16-f1075ng i7-12700H, Iris Xe G7 96EUs, 83 Wh | |
|---|---|---|---|---|---|---|
| Battery runtime | 86% | -17% | 32% | 5% | 20% | |
| Reader / Idle (h) | 14.8 | 25.1 70% | 10.2 -31% | 17.6 19% | 20.6 39% | |
| WiFi v1.3 (h) | 9.1 | 18.3 101% | 6 -34% | 16.7 84% | 9.4 3% | 10.5 15% |
| Load (h) | 1.5 | 2.8 87% | 1.7 13% | 1.2 -20% | 1.4 -7% | 1.6 7% |
| H.264 (h) | 20.4 | 11.2 |
Pros
+ 165 Hz IPS display with VRR and FreeSync standard
+ serviceable and user-replaceable parts
+ outstanding AMD CPU and GPU performance
+ extra small 180 W USB-C power supply unit
+ six customizable USB-C ports
Cons
- the detachable dGPU design loses a lot of value compared to universal dGPU solutions
- larger and heavier than many other 16-inch notebooks
- slow battery charging time when gaming
- relatively poor performance per watt
- no HDR support or OLED options

The trend towards thinner and lighter laptops is made possible by fusing more and more components onto the mainboard. The main drawback to this approach is that it limits repairability as even a small fault may require replacing entire boards. Framework is one of the only manufacturers looking the other way in an attempt to improve end-user customization and servicing. There's no question that the Laptop 16 is more user-friendly to service than any alternative, but this lucrative feature comes at the cost of size and weight as individual components must be easily replaceable. If you only intend to upgrade the RAM or SSD just once or twice in the span of a laptop's lifetime, then more compact and travel-friendly 16-inch alternatives like the Inspiron 16 Plus or Asus VivoBook Pro 16 might serve you better in this regard.
The removable dGPU is also a risky endeavor as it has historically been unsuccessful from larger OEMs like Dell and Lenovo. The fact that universal USB4 or Thunderbolt-based eGPU options exist makes the specialized Laptop 16 dGPU that much less compelling. If you truly want discrete graphics on the road, then the GeForce RTX 4060 can offer both better performance and performance-per-watt than the Radeon 7700S. Framework will therefore have to support the Laptop 16 dGPU design for years to come with future RDNA options to make the investment worthwhile. Purchasing today will mean trusting the company to do just that.
The Framework Laptop 16 is bigger and heavier than other 16-inch laptops in the name of repairability and sustainability. If you upgrade often or foresee repairs, then the Laptop 16 can be worthwhile. If not, then alternatives from larger OEMs tend to be both faster and lighter.
Because of the reasons above, interested buyers should value the expansion cards, sustainability angle, and high repairability of the girthy Laptop 16 as alternatives tend to be thinner, lighter, and sometimes faster especially at the $2000 range. If Framework can somehow match the size of the Razer Blade 16 or MacBook Pro while maintaining repairability, then future revisions can potentially become something very special. For now, you'll have to sacrifice a bit of portability in order to enjoy all the unique features of the Framework.
Framework is now accepting pre-orders for the Laptop 16 starting at $1400 USD for the base Ryzen 7 DIY edition up to over $2400 when configured with Ryzen 9, discrete Radeon 7700S graphics, and multiple expansion cards and modules.
Framework Laptop 16
- 01/23/2024 v7 (old)
Allen Ngo
Connectivity
62 / 80 → 77%
Games Performance
97 / 90 → 100%
Application Performance
97 / 90 → 100%
Multimedia - Weighted Average
Transparency
The selection of devices to be reviewed is made by our editorial team. The test sample was provided to the author as a loan by the manufacturer or retailer for the purpose of this review. The lender had no influence on this review, nor did the manufacturer receive a copy of this review before publication. There was no obligation to publish this review. As an independent media company, Notebookcheck is not subjected to the authority of manufacturers, retailers or publishers.
This is how Notebookcheck is testing
Every year, Notebookcheck independently reviews hundreds of laptops and smartphones using standardized procedures to ensure that all results are comparable. We have continuously developed our test methods for around 20 years and set industry standards in the process. In our test labs, high-quality measuring equipment is utilized by experienced technicians and editors. These tests involve a multi-stage validation process. Our complex rating system is based on hundreds of well-founded measurements and benchmarks, which maintains objectivity. Further information on our test methods can be found here.
Price comparison

Allen Ngo - Lead Editor U.S. - 5557 articles published on Notebookcheck since 2011
After graduating with a B.S. in environmental hydrodynamics from the University of California, I studied reactor physics to become licensed by the U.S. NRC to operate nuclear reactors. There's a striking level of appreciation you gain for everyday consumer electronics after working with modern nuclear reactivity systems astonishingly powered by computers from the 80s. When I'm not managing day-to-day activities and US review articles on Notebookcheck, you can catch me following the eSports scene and the latest gaming news.
Allen Ngo, 2024-01-23 (Update: 2026-02-18)