- Article
- Open access
- Published:
- Duc Phuc Nguyen1,
- Bastien Lechat ORCID: orcid.org/0000-0003-0760-07141,
- Hannah Scott ORCID: orcid.org/0000-0002-0707-80681,
- Barbara Toson1,
- Jack Manners1,
- Claire Dunbar1,
- Kelly Sansom1,
- Lucia Pinilla ORCID: orcid.org/0000-0003-2825-40561,
- Anna Hudson1,
- Ganesh Naik1,
- Andrew Vakulin1,
- Amy C. Reynolds1,
- Peter Catcheside ORCID: orcid.org/0000-0002-9372-67881,
- Pierre Escourrou ORCID: orcid.org/0000-0003-0068-05632 &
- …
- Danny J. Eckert ORCID: orcid.org/0000-0003-3503-23631
Communications Medicine volume 5, Article number: 519 (2025) Cite this article
-
14k Accesses
-
611 Altmetric
Subjects
Abstract
Background
The extent to which people routinely co-attain recommended sleep and physical activity levels, as well as bidirectional associations between both health behaviours, are poorly understood at the global level. This study aimed to describe the routine co-attainment of adequate sleep and daily step count thresholds and investigate non-linear associations between objective sleep and daily step count in a large multi-national sample of objective health monitoring data.
Methods
Data were collected from 70,963 users of two consumer-available health devices—an under-mattress sleep sensor and wrist-worn health tracker—between January 2020 and September 2023. Generalised additive models were used to investigate potentially non-linear, bidirectional, exposure-response relationships between sleep parameters (sleep duration, sleep efficiency, and sleep onset latency) and step count at the next-day/night level. Subgroup analyses were undertaken to investigate age-related differences in all effects.
Results
We show that only 12.9% of people achieve the recommended sleep duration of 7-9hrs/night and >8,000 steps/day, with 16.5% having short sleep (<7hrs/night) and sedentary lives (<5,000 steps/day). Approximately 6hrs sleep equates to the greatest next-day step count (e.g., +339 steps vs 8 hrs/night), and sleep efficiency positively predicts next-day step count in a dose-dependent manner (25th vs 75th percentile: +282 steps/day). Sleep appears largely unaffected by previous-day step count. Effects are similar across age groups but decline in magnitude when adjusted for ‘awake duration’.
Conclusions
Our findings provide insight into the bidirectional relationship between sleep-activity globally and highlight the need to ensure sleep and activity health recommendations are mutually attainable.
Plain language summary
It remains unclear how sleep and physical activity interact on a day-to-day basis, and if people can attain both recommended sleep and activity levels. This study used data from 70,963 individuals who monitored their sleep and physical activity for approximately 3.5 yrs using an under-mattress sleep sensor and smartwatch. We examined the proportion of people that routinely attain both adequate sleep duration and daily step counts, and if step count is affected by sleep the previous night (and vice versa). Only 12.9% of people routinely attain adequate sleep and physical activity, and effects of sleep on physical activity the following day are larger than the reverse. Findings suggest a need to ensure global sleep and physical activity recommendations are mutually attainable.
Introduction
Physical activity and sleep are essential pillars of human health1,2. Regular physical activity can protect against adverse mental and physical health outcomes including cognitive ageing3, hypertension4, inflammation5,6, and all-cause mortality7, and is beneficial for quality of life8. Conversely, sedentary behaviour/inadequate physical activity is associated with increased risk of all-cause mortality9, type 2 diabetes, cardiovascular disease9, hypertension10, mental health conditions11,12, and impaired cognitive performance3. Recent work suggests 8000 daily steps is an important threshold for adults to reduce the risk of many adverse health outcomes, including cardiovascular disease and all-cause mortality13. For older adults, 6000 steps appears to suffice in this regard14. Global self-reported data indicates that more than one in four adults do not attain sufficient regular physical activity15.
Adequate sleep is an active physiological process16,17 crucial for life and optimal health and performance. Sleep plays a vital role in many psychological, neurocognitive, and physiological processes, including learning and memory consolidation, metabolism, and growth and recovery18,19,20,21,22,23. Insufficient sleep is linked to poorer cognitive function20,24,25, increased risk of Alzheimer’s Disease26, mental health problems27,28, weight-gain and higher risk of obesity29, hypertension30, inflammatory biomarkers (e.g., interleukin-6, C-reactive protein)31,32, and all-cause mortality33,34,35. The National Sleep Foundation recommends that adults aged between 26 and 64 years should sleep between 7 and 9 hrs per night, and older adults (>64 years) 7–8 h per night, for optimal health and function36.
Given their importance for health, the interaction between sleep and physical activity has received growing attention37,38. Current evidence suggests that physical activity, as opposed to sedentary behaviour, is beneficial for sleep, with positive associations reported between physical activity with greater sleep quality and duration39,40,41,42. Bidirectional mechanisms have also been proposed, whereby physical activity promotes sleep (e.g., through sleep regularity, reduced inflammation) whilst insufficient sleep may impair physical performance and activity (e.g., through increased fatigue, reduced growth hormone secretion)43. Indeed, there is evidence for longitudinal associations between sedentary behaviour and reduced physical activity with impaired sleep architecture (during a 7-day period)44. Moreover, systematic review findings suggest that moderate-to-vigorous (but not high intensity) physical activity benefits sleep quality indices (i.e., sleep onset latency, wake after sleep onset, sleep efficiency)39,45,46. Such conclusions are supported by evidence from a recent study utilising naturalistic monitoring data, where attaining at least 60 min of moderate-to-vigorous physical activity per day was associated with greater objective sleep efficiency, shorter sleep onset latency, and increased self-reported sleep quality47. However, in the same study, note that no associations between continuous physical activity metrics and next-night sleep indices were uncovered47.
The 24-h activity cycle concept has become the prevailing perspective on the sleep-activity relationship48,49. This paradigm recognises sleep and physical activity (or a lack thereof) as interconnected components of health that interact bidirectionally and are temporally dependent within the 24-h day. It has been used successfully in the context of various health outcomes. Largely, and in line with previously cited findings, evidence suggests that 24-h days comprised of sufficient sleep and light or moderate-vigorous physical activity, as opposed to sedentary behaviour, are favourable for health outcomes50. Alongside this evidence base, 24-h activity guidelines have been developed for infants51,52 and adults53, although systematic review evidence suggests relatively poor attainment rates across different populations54. It is important to confirm the simultaneous attainment of recommended sleep and physical activity thresholds at a global scale.
Furthermore, whilst a developing body of research highlights the importance of the interaction between physical activity and sleep, several key methodological limitations are often present. These include 1) the use of relatively small (e.g., <10 to ~10,000)55,56 samples typically from single geographical regions37, 2) analysis of self-reported data that is subject to recall and social desirability biases, and 3) a lack of longitudinal data collected at a high enough frequency to obtain accurate estimations of average daily physical activity and habitual sleep parameters. Accordingly, the daily dynamics of physical activity relative to common sleep parameters, and vice versa, have not yet been comprehensively investigated using longitudinal, technology-enabled, objective ‘big data’ collected from a global sample.
In the present study, we leverage ~28 million person-days of objective health monitoring data, collected over 3.5 years across 244 geographical regions, to address two primary aims. First, we describe the routine co-attainment of the National Sleep Foundation’s sleep duration recommendations alongside research-informed daily step count thresholds; and second, we investigate potentially non-linear, bidirectional, temporal relationships between three commonplace sleep parameters—sleep duration, sleep efficiency, and sleep onset latency—and daily step count. We show that only a small proportion (~13%) of people can routinely attain both the recommended 7–9 h of sleep per night and > 8000 daily steps. Moreover, we demonstrate an inverted-U-shaped association between sleep duration and next-day step count (peaking at ~6 h/night) and a near-linear positive association between sleep efficiency and step count the following day. Such effects of sleep on next-day activity were notably greater than the reverse. Uncovered associations are broadly similar across geographical regions and—somewhat surprisingly given previous research36,57,58—when stratified by age group (19–33, 34–53, and 54+ yrs).
Methods
Participants
Deidentified objective step count and sleep data were acquired from registered users of the Withings Sleep Analyser (WSA), a validated59 and Therapeutic Goods Administration/Food and Drug Administration-cleared under-mattress sleep sensor, and the Withings ScanWatch (WSW), a wearable health tracker. Note that Withings users are members of the public who purchased the health monitoring devices of their own accord. Daily step count data were matched to the previous night of sleep. Data were collected from 244 geographical regions between January 2020 and September 2023. WSA data included 117,034 users (77,226,009 recordings) and WSW contained 200,921 (97,975,648 recordings). All participants provided consent to have their data used for research purposes by agreeing to Withings’ terms and conditions. The use of these data was approved by the Flinders University Human Research Ethics Committee (project approval number 4291).
Monitoring equipment
The WSA is a consumer-available under-mattress device that passively monitors sleep, heart rate, and breathing. The device uses pneumatic and acoustic sensors to detect body movement, snoring, breathing, and heart rate to estimate sleep and respiratory parameters via proprietary algorithms. The sleep metrics analysed for the present study were sleep duration, sleep efficiency (SE; percentage of time in bed spent asleep), and sleep onset latency (SOL). We also used the WSA to derive the nightly apnoea-hypopnoea index (AHI) to consider obstructive sleep apnoea severity in our analyses as a potentially important sleep confounder60,61. The WSA has good agreement with gold-standard polysomnography for sleep estimation (i.e., ~30-min sleep duration overestimation, <2% sleep efficiency error), with accuracy comparable to that of other passive monitoring devices59,62,63,64,65,66. The WSA has also been validated in several studies for obstructive sleep apnoea diagnosis59,66.
The WSW is a consumer-available wrist-worn smartwatch designed for passive, 24/7 health monitoring. Using photoplethysmography and accelerometer (3-axis) sensors, the WSW estimates heart rate, on-demand electrocardiogram, oxygen saturation, respiratory rate, sleep, and step count. In the current study, the WSW was used for step count estimation only.
Data cleaning
We matched the WSA and WSW datasets by user ID and date. Only complete cases, where both sleep parameters and step count were available, were used for analyses. Users with ≥28 days of sleep data, and an average of ≥4 recorded sleep periods per week, were included in the analyses64. To reduce the impact of outliers for each variable on our selected statistical model (which is sensitive to outliers; see below), we trimmed data to exclude values in the lower and uppermost 1% of the distribution (Fig. 1). This is a similar approach to previous work67 where a 5% threshold was used. Descriptive statistics for raw (un-trimmed) and trimmed data are presented in the Supplementary Table S1. In total, for the primary analyses we used data from 70,963 participants, collected across an average of 394 monitoring days (equating to 27,986,158 person-days/nights) (Fig. 1). Comparison of demographic descriptive statistics between included and excluded participants, and the demographic statistics for the top 20 countries ranked by user count, are provided in Supplementary Tables S2 and S3, respectively.

Flow chart of data exclusion process (A) and geographical distribution of device users (B). Geographical representation reflects the final sample used in statistical analyses (N = 70,963).
Statistics and reproducibility
We employed Generalised Additive Models (GAM) as our primary analysis technique due to their flexibility in modelling complex, non-linear, and temporal relationships68.
First, GAMs were used to outline the association between step count and demographic (body mass index [BMI], age in years, sex) and temporal factors (day of the week, day length, years (2020–2023)). We included a random intercept for each participant. In this and all subsequent GAM models, all variables, except for sex, were modelled using smooth functions with a default degree of freedom of 8. Due to the limited number of unique values, the variables ‘Year’ and ‘Weekday’ were restricted to 3 and 7 degrees of freedom, respectively. GAM parameters were set using the “mgcv” package69 in R.
Second, we employed GAMs to investigate the bidirectional relationship between sleep and daily step count while accounting for potential nonlinearity, given previous research has identified U-shaped relationships between sleep and health/functioning outcomes70,71,72. The bidirectional relationships modelled were: ‘Sleep → next-day step count’ and ‘Step count → next-night sleep’. Note that ‘next-night sleep’ refers to the sleep bout immediately following the daytime period from which the step count value was derived. These models were adjusted for demographic factors (age, BMI, and sex), temporal factors (weekday, day length, and year), and geographical factors (latitude and longitude). A random intercept term was included for participant. Additionally, the models also accounted for the duration of the wakefulness period, since sleep and physical activity are temporally dependent within the 24-hour cycle.
Supplementary GAMs were computed to determine if the exposure-response relationships differed by age group and OSA severity. The chosen age groups were early-adulthood (19–33 years), mid-adulthood (34–53 years), and late-adulthood (54+ years)73. OSA severity groups were as follows: mild (AHI: <15 events/h), moderate (≥15 and <30), and severe (≥30).
In addition to presenting exposure-response curves, we compared modelled values of the outcome at quartiles of the predictor variables to help quantify the effects. Note that interaction terms were not included in the final models as they did not improve model performance based on the Akaike Information Criterion (Supplementary Tables S4, S5 and Supplementary Fig. S1).
We conducted a descriptive analysis to quantify the proportion of users who met recommended ranges for average sleep duration and daily step counts. Specifically, sleep duration and step count were categorised into three categories: <7 h, 7–9 h, and >9 h for sleep; <5000 steps, 5000–8000 steps, and >8000 steps for step count. Selected sleep duration ranges were based on the National Sleep Foundation’s recommended range of 7–9 h for adults36. Step count categorisation was informed by the “step-defined sedentary life index” of <5000 daily steps74 and findings that a daily step count ~8000 (e.g., 7000–9000) may be sufficient to reduce the risk of various adverse health outcomes (e.g., diabetes, hypertension) and all-cause mortality13,14,75. We also stratified these analyses by age group—using the same thresholds as for the exposure-response analyses outlined above—given the National Sleep Foundation’s sleep duration recommendation differs (i.e., 7–8 h/night) for older adults (≥65 years), and that ~6000 daily steps appears to reduce the risk of all-cause mortality and cardiovascular disease in adults aged over 60 years14,76. The connections between these categories were presented using a Sankey diagram from the “networkD3”77 package in R.
All data analysis and visualisation were conducted in R software, version 4.2.278.
Results
Demographic, geographical, and temporal step count patterns
In total, we analysed data from 70,963 participants, collected across an average of 394 monitoring days (equating to 27,986,158 person-days/nights). On average, participants were aged 48 ± 12 years, predominantly male (82%), overweight (BMI = 27.7 ± 4.9 kg/m2), and achieved 5521 steps per day (IQR = 3090–8751). Table 1.
Daily step count varied with changes in demographic and temporal factors (Fig. 2). Increases in age (beyond ~60 years) and BMI (above ~32 kg/m2; obesity) were associated with reduced daily step count. Step count was stable Monday through Friday, with a peak (~400 additional steps than Friday) occurring on Saturday. Greater day lengths (daylight duration) were associated with increased step count (15 h versus 10 h: ~300 additional steps). Daily step count increased (~400 steps/day) from 2020 to 2022 and remained at a similar level from 2022 to 2023. See Supplementary Figs. S2–S5.

A Daily step count distribution, and daily step count as a function of B age in years, C body mass index, D weekday, E day length in hours, and F year. Note that ‘day length’ refers to daylight hours or ‘photoperiod’. For panels B through F, y-axis values are centred on the median of the predicted outcome values computed with all other variables in the model held constant.
Descriptive analysis of sleep duration and step count categories
Nearly all (~99%) users were categorised as getting an average of <7 (43.2%) or between 7 and 9 (55.9%) hours of sleep per night; with <1% sleeping over 9 h. Most participants (76.8%) achieved <8000 steps per day on average. The number of people who slept 7–9 h per night and averaged >8000 steps per day represented 12.9% of the sample. Further, 16.5% of the sample averaged <7 h of sleep per night and <5000 steps per day (Fig. 3A).

A The values displayed reflect the proportion of total users in the dataset; B the proportion of participants from each sleep duration category; and C the proportion of participants from each step count category.
A near-equal proportion (~38%) of users from both the <7 and 7–9 h sleep categories reached 5000–8000 steps per day. However, substantial proportions (~38%) from each group had below 5000 steps per day. Almost 60% of users who slept >9 h per night on average attained <5000 steps per day (Fig. 3B). Figure 3C depicts the proportion of participants from each step count category attaining sleep durations across the three specified categories.
The proportion of the sample achieving the appropriate sleep duration and step count thresholds were similar when stratified by age group (Supplementary Fig. S6). 12.9% of participants aged 19–33 years achieved 7–9 h of sleep per night and >8000 steps per day. 13.5% and 11.9% of participants aged 34–53 and >54 years achieved these thresholds, respectively. When adjusting the thresholds for the >54 age group to 7–8 h of sleep and >6000 steps per day, to better align with age-specific recommendations14,36, 18.6% met these values simultaneously (Supplementary Fig. S6).
Associations between sleep parameters and step count
Sleep and next-day step count
In the unadjusted model, the relationship between sleep duration and next-day step count was characterised by an inverted U-shaped trend (Fig. 4A), with peak step count following approximately six hours of sleep the previous night. Next-day step count modelled at the 75th sleep duration percentile (~8 h/night) was 237-steps lower than that modelled at the 50th (~7 h/night) and 339-steps lower than that at the 25th sleep duration percentile (~6 h/night). Additionally, severely restricted sleep of four hours (~2.5th sleep duration percentile) was associated with 184 fewer next-day steps than sleep duration at the 25th percentile (~6 h/night). When accounting for ‘wake period’ in the adjusted model (Fig. 4A), approximately seven hours of sleep the previous night equated to peak daily step count. Step count modelled at the 75th sleep duration percentile (~8 h/night) was 64-steps and 69-steps less than that at the 25th (~6 h/night) and 50th (~7 h/night) percentiles, respectively. This represents a smaller effect than in the unadjusted model. Again, sleeping four hours was associated with 158 fewer next-day steps (versus 25th sleep duration percentile; ~6 h/night).
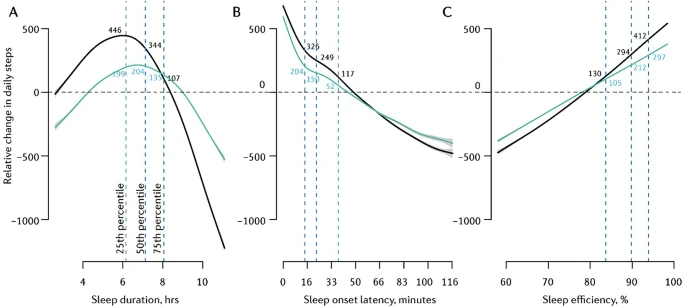
A Sleep duration → daily steps, B SOL → daily steps, C SE → daily steps. The black trend line depicts an unadjusted model; the turquoise trend line depicts the model adjusted for ‘awake duration’. Vertical dotted lines indicate the 25th, 50th, and 75th percentiles of the predictor variable. Y-axis values are centred on the median (50th percentile) of the predicted outcome values computed with all other variables in the model held constant; hence, changes are marginal effects. Trend lines represent mean modelled estimates; grey error bands reflect the 95% confidence interval of these modelled estimates. Models computed on data from all participants (n = 70,693).
Exposure-response curves for effects of sleep duration on next-day step count did not differ considerably across different OSA severities (Supplementary Fig. S7). Relationships were similar across various regions also (Supplementary Fig. S8). However, compared to young and middle-aged adults, the inverted-U-shaped exposure-response curve was notably right-shifted for older adults (54+ years), with optimal step count equating to ~6.5 h of sleep the previous night (Supplementary Fig. S9). For reference, this value was ~5.5 h for participants aged 34–53 years.
There was an inverse, near-linear, relationship between SOL and next-day step count (Fig. 4B), with the modelled average step count equating to a previous-night SOL of ~50 min. Longer SOL (i.e., 75th vs 25th SOL percentiles: ~37 min vs ~15 min) was associated with a 209-step reduction in next-day step count. When adjusting for ‘awake duration’, the shape of effects remained similar, but the magnitudes decreased (152-step reduction from the 25th to 75th SOL percentile). This exposure-response association did not differ substantially across age groups (Supplementary Fig. S9).
SE was associated with next-day step count in a near-linear fashion (Fig. 4C). Greater SE (75th vs 25th SE percentile: ~94% vs ~83%) was associated with a 282-step increase in next-day step count. The effect in the adjusted model, a 192-step increase from the 25th to 75th SE percentile, was comparable in direction but slightly smaller in magnitude. This association did not change considerably when stratified by age group (Supplementary Fig. S9).
Step count and next-night sleep
While increasing daily step count was associated with a reduction in sleep duration the following night (Fig. 5A), the effects were small and, when adjusting for ‘wake period’, sleep duration did not vary considerably as a function of the preceding days’ step count.

A Daily steps → sleep duration, B daily steps → SOL, C daily steps → SE. Black trend line depicts unadjusted model; the turquoise trend line depicts the model adjusted for ‘awake duration’. Vertical dotted lines indicate the 25th, 50th, and 75th percentiles of the predictor variable. Y-axis values are centred on the median (50th percentile) of the predicted outcome values computed with all other variables in the model held constant; hence, changes are marginal effects. Trend lines represent mean modelled estimates; grey error bands reflect the 95% confidence interval of these modelled estimates. Models computed on data from all participants (n = 70,693).
The relationship between daily step count and next-night SOL was near-linear, with greater step count predicting lower SOL. However, again, this effect was small (i.e., <2-min SOL reduction; 25th vs 75th step count percentile). The effect was similar in direction and magnitude when accounting for ‘awake duration’ in the adjusted model (Fig. 5B).
Greater daily step count was associated with marginally higher SE the following night. However, note that daily step count below the 75th percentile predicted SE below the modelled average. The effect was similarly small in the model adjusted for ‘awake duration’ (Fig. 5C).
These exposure-response relationships varied between OSA severity groups. For example, individuals with severe OSA had a reduction in total sleep time (6 min) that was nearly double the reduction observed in the mild OSA group (3.5 min) when step count increased from the 25th to the 75th percentile (Supplementary Fig. S8).
There were no prominent differences in these exposure-response associations between young-, middle-, and older-aged adults (Supplementary Fig. S9).
Discussion
This study used a large, multi-national sample of health monitoring data to investigate associations between step count and temporal, demographic, and sleep-related factors. Daily step count differed as a function of demographic (age, BMI) and temporal (weekday, day length, year) factors. Only a very small proportion of participants routinely attained the recommended sleep duration (age-adjusted: 7–9 or 7–8 h/night) and daily step count (age-adjusted: >8000 or >6000 steps/day) thresholds. Greater SOL and poorer SE were associated with decreased step count the following day, with daily step count the greatest following a sleep duration of ~6–7 h. The optimal sleep duration to maximise next-day step count was greatest for older adults. Effects of daily step count on the subsequent night’s sleep duration, SOL, and SE were small and likely lack practical significance.
There were discernible relationships between step count and the demographic and temporal factors we considered. The broadly inverse relationships between physical activity and both age and BMI are unsurprising given the well-established relationship between sedentary behaviour and BMI/obesity79,80,81 and age-related declines in physical capacity57,58. Variation in daily step count with weekday and year (2020–2023) may be explained by a greater opportunity for intentional (but also incidental) physical activity on weekends and the easing of work-from-home/lockdown restrictions following the COVID-19 pandemic82,83,84, respectively. Furthermore, the positive association between daily step count and day length was similar to those reported in previous research85. These associations highlight the importance of considering both capacity and opportunity to achieve regular adequate physical activity.
Most participants did not consistently achieve the recommended sleep and physical activity levels, with only 12.9% achieving 7–9 h of sleep and >8000 daily steps simultaneously. This suggests that 8000 steps—although less than the widely-touted 10,000 step goal86—is difficult for people to consistently achieve alongside adequate sleep. Seemingly, and as previous research would suggest37,54, this global sample has challenges in attaining both adequate sleep duration and sufficient physical activity. Furthermore, and concerningly, most (>64%) people were unable to simultaneously attain both 7–9 h of sleep and >5000 daily steps, the upper threshold for a ‘sedentary lifestyle’ 74. Indeed, nearly 17% of the sample lead sedentary lives (<5000 daily steps) and sleep less than seven hours per night on average. This is especially concerning given recent evidence suggests even sporadic attainment of ~8000 daily steps for adults can have notable health benefits87. Importantly, the ability to attain sleep and physical activity recommendations was poor across all age groups, even when age-adjusted thresholds were used. For example, less than one in five older adults were able to simultaneously achieve the recommended sleep duration (7–8 h per night) and >6000 daily steps. Thus, there is a clear need to emphasise the importance of both sleep and physical activity in this potentially vulnerable population88. Taken together, these findings highlight a need to better consider the compatibility of prominent sleep and physical activity guidelines and for continued research into strategies that ensure individuals at all stages of life can attain adequate sleep without detriment to their physical activity levels, and vice versa. Encouraging individuals to reallocate time in sedentary behaviour to sleep or physical activity would help achieve this53.
There were bidirectional exposure-response relationships between sleep and next-day step count and, to a lesser extent, step count and sleep the following night. This is unsurprising given previous research has shown associations between select sleep parameters and step count40, and that sleep duration and physical activity are inherently linked via their temporal dependency within the 24-h cycle. Here, our findings indicate that the effects of sleep on subsequent physical activity are greater than the reverse in terms of relative magnitude. This is an important finding given previous meta-analytic work concluded that evidence for a unidirectional, temporal, sleep-to-activity relationship is inconclusive89. High quality sleep of sufficient duration facilitates an increased capacity to perform physical activity (e.g., via enhanced motivation). Conversely, physical activity’s role in ensuring good sleep is complex, with activity timing and accrued physical strain prominent contributing factors90 that should be considered when developing physical activity guidelines and initiatives. In the first instance, public health messaging may benefit from emphasising good sleep as a precursor to physical activity in an integrated approach, or by prioritising sleep-focused health initiatives and policy changes.
It would appear that effects of sleep on next-day step count occur irrespective of their temporal dependency within the 24-h period. This is consistent with existing literature that emphasises the importance of considering sleep quality metrics in sleep-activity relationships. How this knowledge can be integrated into the prevailing 24-h activity cycle framework to better understand the combined effects of sleep and activity dynamics on clinical health endpoints remains an open question that warrants further consideration and investigation.
Exposure-response relationships were largely identical across age groups. This suggests that the mechanisms and perpetuating influential factors that link sleep and activity are stable throughout the lifespan. Interestingly, however, older adults required the longest sleep duration to maximize their next day step count, suggesting that good sleep health may enhance the capacity for physical activity in older age. As the global population continues to age, it becomes increasingly important to investigate how good sleep can support physical activity and help people maintain functional independence. Moreover, our region-based subgroup analysis underscores the importance of considering region-specific factors, such as climate and cultural norms related to sleep, as these may influence sleep-activity public health guidelines and initiatives.
The practical significance of the identified temporal associations between sleep and step count warrants further investigation. An increase in sleep efficiency from low (83%) to high (94%) at the population level, equated to 192 more steps the following day (in the adjusted model). Comparatively, intervention research indicates that simply providing someone with a step count monitoring device can lead to increases of ~1800 steps per day 91. This knowledge is important to consider in relation to public health interventions that may attempt to improve sleep (e.g., greater sleep duration) via increasing daily physical activity, and/or vice versa. Practically small effects at the population level may also reflect poor sensitivity of the daily step count measure to changes in sleep. It will be important to consider alternate methods to quantify daily activity in the context of sleep, such as ‘exercise strain’ composite scores that incorporate both accelerometer and cardiovascular load data92.
Nonetheless, it appears that achieving above average step count is possible with varying sleep durations—with high sleep quality appearing to enhance this ability. Providing further evidence in support of physical activity interventions39,93, greater light intensity physical activity likely improves sleep quality. As suggested elsewhere38, and given that effects likely lack practical significance, continued research is required to confirm how sleep and physical activity interact at the population level.
Our study has several limitations. Withings devices are primarily marketed in developed regions, meaning our sample, through self-selection, may have been biased towards high socioeconomic individuals, those interested in health monitoring, and/or those with sleep-related health concerns. Findings may not generalise well to people of lower socio-economic status; however, this limitation more broadly reflects global disparities in sleep and physical activity data94, and is not exclusive to the consumer health technology data used here95. Also, and importantly, the WSA tends to overestimate sleep duration (~30 min) and SOL versus gold-standard polysomnography59,64. However, this is comparable to other consumer-available sleep tracking devices62,63, and suggests that the proportion of the sample who attained the recommended sleep duration and adequate levels of physical activity is even less than observed. Furthermore, the step count metric does not capture alternate forms of physical activity that have importance for health and longevity (e.g., resistance-based exercise96), and that could constitute a notable proportion of the 24-h period. Finally, due to limitations in our data, we were unable to consider different physical activity intensities (e.g., sedentary behaviour) and physical activity timing in our models. We also did not have data on other health outcomes (e.g., blood pressure97). Inclusion of clinical health endpoints would have helped to form a more holistic picture of the relationship between sleep and physical activity with additional clinical relevance, although sleep and physical activity are vitally important health modifiers in and of themselves98. It will0020be important for future research to both attain largescale data with high temporal specificity and employ casual inference time-series methodologies (e.g., Granger causality or transfer entropy) given knowledge that the sleep-activity temporal associations within and beyond the 24-h period are complex and not yet fully understood89.
Conclusions
This study provides important insights into the bidirectional relationship between sleep-activity at the within-individual level. Our study identified very low levels of simultaneous attainment of sleep and physical activity recommendations in a large, real-world, multi-national sample in which on average, more than a year of daily data were acquired. We show that effects of sleep on physical activity, and to a lesser degree, effects of physical activity on sleep, exist at the next-day level irrespective of temporal dependency. Leveraging this knowledge, public health initiatives and interventions that aim to enhance sleep and physical activity concurrently are likely to prove more effective than those that target either behaviour in isolation. Nonetheless, in contexts where resources are limited, or it is otherwise unfeasible to employ such integrated approaches, sleep-focused interventions are likely to be the most beneficial. Our findings also underscore the need to consider alternate physical activity markers that may help to better characterise the dynamics of the sleep-activity relationship. Furthermore, poor attainment of age-adjusted sleep and physical activity thresholds indicates that people across the lifespan struggle to attain both adequate sleep and physical activity. These findings highlight the importance of considering the real-world compatibility of prominent sleep and physical activity guidelines. Further research is needed to inform public health initiatives that support an individual’s ability to simultaneously achieve both adequate sleep and physical activity across the lifespan. Policymakers should also endeavour to better integrate sleep and physical activity guidelines.
Data availability
The dataset used for this study is stored in a proprietary repository (Withings) and cannot be shared publicly due to privacy and ethical concerns, and legal reasons. The research team accessed the data through an application process to Withings, designed to safeguard user confidentiality, as outlined in the terms and conditions and privacy policy documentation. Queries for data access can be directed to Withings (contact-sup@withings.com) with a timeframe for response of four weeks. Specific de-identified raw data that support the findings of this study, including individual data, are available from the corresponding author (josh.fitton@flinders.edu.au) upon request subject to ethical and data custodian (Withings) approval described above. The timeframe for response to requests will be four weeks. Source data to reproduce primary exposure-response Figs. 4 and 5 are available in Supplementary Data File 1.
References
Arena, R. et al. Current activities centered on healthy living and recommendations for the future: a position statement from the HL-PIVOT network. Curr. Probl. Cardiol. 46, 100823 (2021).
Kris-Etherton, P. M. et al. Strategies for promotion of a healthy lifestyle in clinical settings: pillars of ideal cardiovascular health: a science advisory from the American Heart Association. Circulation 144, e495–e514 (2021).
Falck, R. S., Davis, J. C. & Liu-Ambrose, T. What is the association between sedentary behaviour and cognitive function? A systematic review. Br. J. Sports Med. 51, 800–811 (2017).
Diaz, K. M. & Shimbo, D. Physical activity and the prevention of hypertension. Curr. Hypertens. Rep. 15, 659–668 (2013).
Bruunsgaard, H. Physical activity and modulation of systemic low-level inflammation. J. Leukoc. Biol. 78, 819–835 (2005).
Nimmo, M., Leggate, M., Viana, J. & King, J. The effect of physical activity on mediators of inflammation. Diab. Obes. Metab. 15, 51–60 (2013).
Saint-Maurice, P. F. et al. Association of daily step count and step intensity with mortality among US adults. JAMA 323, 1151–1160 (2020).
Martin, C. K., Church, T. S., Thompson, A. M., Earnest, C. P. & Blair, S. N. Exercise dose and quality of life: a randomized controlled trial. Arch. Intern. Med. 169, 269–278 (2009).
Patterson, R. et al. Sedentary behaviour and risk of all-cause, cardiovascular and cancer mortality, and incident type 2 diabetes: a systematic review and dose response meta-analysis. Eur. J. Epidemiol. 33, 811–829 (2018).
Beunza, J. J. et al. Sedentary behaviors and the risk of incident hypertension: the SUN Cohort. Am. J. Hypertens. 20, 1156–1162 (2007).
Biddle, S. J. & Asare, M. Physical activity and mental health in children and adolescents: a review of reviews. Br. J. Sports Med. 45, 886–895 (2011).
VanKim, N. A. & Nelson, T. F. Vigorous physical activity, mental health, perceived stress, and socializing among college students. Am. J. Health Promot. 28, 7–15 (2013).
Master, H. et al. Association of step counts over time with the risk of chronic disease in the All of Us Research Program. Nat. Med. 28, 2301–2308 (2022).
Paluch, A. E. et al. Daily steps and all-cause mortality: a meta-analysis of 15 international cohorts. Lancet Public Health 7, e219–e228 (2022).
Guthold, R., Stevens, G. A., Riley, L. M. & Bull, F. C. Worldwide trends in insufficient physical activity from 2001 to 2016: a pooled analysis of 358 population-based surveys with 1·9 million participants. Lancet Glob. Health 6, e1077–e1086 (2018).
Kryger, M. H., Roth, T. & Dement, W. C. Principles and Practice of Sleep Medicine-E-Book: Expert Consult-Online and Print (Elsevier Health Sciences, 2010).
Grandner, M. A. Sleep, health, and society. Sleep. Med. Clin. 17, 117–139 (2022).
Stickgold, R. Sleep-dependent memory consolidation. Nature 437, 1272–1278 (2005).
Walker, M. P. & Stickgold, R. Sleep-dependent learning and memory consolidation. Neuron 44, 121–133 (2004).
Van Dongen, H. P., Maislin, G., Mullington, J. M. & Dinges, D. F. The cumulative cost of additional wakefulness: dose-response effects on neurobehavioral functions and sleep physiology from chronic sleep restriction and total sleep deprivation. Sleep 26, 117–126 (2003).
Morselli, L., Leproult, R., Balbo, M. & Spiegel, K. Role of sleep duration in the regulation of glucose metabolism and appetite. Best. Pract. Res. Clin. Endocrinol. Metab. 24, 687–702 (2010).
Dattilo, M. et al. Sleep and muscle recovery: endocrinological and molecular basis for a new and promising hypothesis. Med. Hypotheses 77, 220–222 (2011).
Takahashi, Y., Kipnis, D. & Daughaday, W. Growth hormone secretion during sleep. J. Clin. Investig. 47, 2079–2090 (1968).
Banks, S. & Dinges, D. F. Behavioral and physiological consequences of sleep restriction. J. Clin. Sleep. Med. 3, 519–528 (2007).
Faraut, B., Boudjeltia, K. Z., Vanhamme, L. & Kerkhofs, M. Immune, inflammatory and cardiovascular consequences of sleep restriction and recovery. Sleep. Med. Rev. 16, 137–149 (2012).
Bubu, O. M. et al. Sleep, cognitive impairment, and Alzheimer’s disease: a systematic review and meta-analysis. Sleep 40, zsw032 (2017).
Scott, A. J., Webb, T. L., Martyn-St James, M., Rowse, G. & Weich, S. Improving sleep quality leads to better mental health: a meta-analysis of randomised controlled trials. Sleep. Med. Rev. 60, 101556 (2021).
Baglioni, C. et al. Sleep and mental disorders: a meta-analysis of polysomnographic research. Psychol. Bull. 142, 969 (2016).
Chaput, J.-P. et al. The role of insufficient sleep and circadian misalignment in obesity. Nat. Rev. Endocrinol. 19, 82–97 (2023).
Calhoun, D. A. & Harding, S. M. Sleep and hypertension. Chest 138, 434–443 (2010).
Mullington, J. M., Simpson, N. S., Meier-Ewert, H. K. & Haack, M. Sleep loss and inflammation. Best. Pract. Res. Clin. Endocrinol. Metab. 24, 775–784 (2010).
Irwin, M. R., Olmstead, R. & Carroll, J. E. Sleep disturbance, sleep duration, and inflammation: a systematic review and meta-analysis of cohort studies and experimental sleep deprivation. Biol. Psychiatry 80, 40–52 (2016).
Gallicchio, L. & Kalesan, B. Sleep duration and mortality: a systematic review and meta-analysis. J. Sleep. Res. 18, 148–158 (2009).
Cappuccio, F. P., D’Elia, L., Strazzullo, P. & Miller, M. A. Sleep duration and all-cause mortality: a systematic review and meta-analysis of prospective studies. Sleep 33, 585–592 (2010).
Kripke, D. F., Garfinkel, L., Wingard, D. L., Klauber, M. R. & Marler, M. R. Mortality associated with sleep duration and insomnia. Arch. Gen. Psychiatry 59, 131–136 (2002).
Hirshkowitz, M. et al. National Sleep Foundation’s sleep time duration recommendations: methodology and results summary. Sleep. Health 1, 40–43 (2015).
Oftedal, S. et al. Prevalence, trends, and correlates of joint patterns of aerobic and muscle-strengthening activity and sleep duration: a pooled analysis of 359,019 adults in the National Health Interview Survey 2004–2018. J. Phys. Act. Health 19, 246–255 (2022).
Dolezal, B. A., Neufeld, E. V., Boland, D. M., Martin, J. L. & Cooper, C. B. Interrelationship between sleep and exercise: a systematic review. Adv. Prevent. Med. 2017, 1364387 (2017).
Wang, F. & Boros, S. The effect of physical activity on sleep quality: a systematic review. Eur. J. Physiother. 23, 11–18 (2021).
Gubelmann, C., Heinzer, R., Haba-Rubio, J., Vollenweider, P. & Marques-Vidal, P. Physical activity is associated with higher sleep efficiency in the general population: the CoLaus study. Sleep 41, zsy070 (2018).
Foti, K. E., Eaton, D. K., Lowry, R. & McKnight-Ely, L. R. Sufficient sleep, physical activity, and sedentary behaviors. Am. J. Prevent. Med. 41, 596–602 (2011).
Koohsari, M. J. et al. Sedentary behaviour and sleep quality. Sci. Rep. 13, 1180 (2023).
Chennaoui, M., Arnal, P. J., Sauvet, F. & Léger, D. Sleep and exercise: a reciprocal issue? Sleep. Med. Rev. 20, 59–72 (2015).
Seol, J. et al. Bidirectional associations between physical activity and sleep in older adults: a multilevel analysis using polysomnography. Sci. Rep. 12, 15399 (2022).
Zhao, H., Lu, C. & Yi, C. Physical activity and sleep quality association in different populations: a meta-analysis. Int. J. Environ. Res. Public Health 20, 1864 (2023).
Alnawwar, M. A. et al. The effect of physical activity on sleep quality and sleep disorder: a systematic review. Cureus 15, e43595 (2023).
Zapalac, K., Miller, M., Champagne, F. A., Schnyer, D. M. & Baird, B. The effects of physical activity on sleep architecture and mood in naturalistic environments. Sci. Rep. 14, 5637 (2024).
Rosenberger, M. E. et al. The 24-hour activity cycle: a new paradigm for physical activity. Med. Sci. Sports Exerc. 51, 454 (2019).
Pedišić, Ž Measurement issues and poor adjustments for physical activity and sleep undermine sedentary behaviour research—the focus should shift to the balance between sleep, sedentary behaviour, standing and activity. Kinesiology 46, 135–146 (2014).
Chastin, S. F., Palarea-Albaladejo, J., Dontje, M. L. & Skelton, D. A. Combined effects of time spent in physical activity, sedentary behaviors and sleep on obesity and cardio-metabolic health markers: a novel compositional data analysis approach. PloS One 10, e0139984 (2015).
World Health Organization. Guidelines on Physical Activity, Sedentary Behaviour and Sleep for Children under 5 years of Age 36-36 (WHO, 2019).
Okely, A. D. et al. A collaborative approach to adopting/adapting guidelines-The Australian 24-Hour Movement Guidelines for the early years (Birth to 5 years): an integration of physical activity, sedentary behavior, and sleep. BMC Public Health 17, 167–190 (2017).
Ross, R. et al. Canadian 24-Hour Movement Guidelines for Adults aged 18–64 years and Adults aged 65 years or older: an integration of physical activity, sedentary behaviour, and sleep. Appl. Physiol. Nutr. Metab. 45, S57–S102 (2020).
Rollo, S., Antsygina, O. & Tremblay, M. S. The whole day matters: understanding 24-hour movement guideline adherence and relationships with health indicators across the lifespan. J. Sport Health Sci. 9, 493–510 (2020).
McDonald, S. et al. Changes in physical activity during the retirement transition: a series of novel n-of-1 natural experiments. Int. J. Behav. Nutr. Phys. Act. 14, 1–12 (2017).
Gabriel, K. P. et al. Bidirectional associations of accelerometer-determined sedentary behavior and physical activity with reported time in bed: Women’s Health Study. Sleep. Health 3, 49–55 (2017).
Cunningham, C., O’Sullivan, R., Caserotti, P. & Tully, M. A. Consequences of physical inactivity in older adults: a systematic review of reviews and meta-analyses. Scand. J. Med. Sci. Sports 30, 816–827 (2020).
Angulo, J., El Assar, M., Álvarez-Bustos, A. & Rodríguez-Mañas, L. Physical activity and exercise: strategies to manage frailty. Redox Biol. 35, 101513 (2020).
Edouard, P. et al. Validation of the Withings Sleep Analyzer, an under-the-mattress device for the detection of moderate-severe sleep apnea syndrome. J. Clin. Sleep. Med. 17, 1217–1227 (2021).
Mendelson, M. et al. Obstructive sleep apnea syndrome, objectively measured physical activity and exercise training interventions: a systematic review and meta-analysis. Front. Neurol. 9, 73 (2018).
Frangopoulos, F. et al. The complex interaction between the major sleep symptoms, the severity of obstructive sleep apnea, and sleep quality. Front. Psychiatry 12, 630162 (2021).
Haghayegh, S., Khoshnevis, S., Smolensky, M. H., Diller, K. R. & Castriotta, R. J. Accuracy of wristband Fitbit models in assessing sleep: systematic review and meta-analysis. J. Med. Internet Res. 21, e16273 (2019).
Chee, N. I. et al. Multi-night validation of a sleep tracking ring in adolescents compared with a research actigraph and polysomnography. Nat. Sci. Sleep. 13, 177–190 (2021).
Scott, H. et al. Sleep irregularity is associated with hypertension: findings from over 2 million nights with a large global population sample. Hypertension 80, 1117–1126 (2023).
Lee, T. et al. Accuracy of 11 wearable, nearable, and airable consumer sleep trackers: prospective multicenter validation study. JMIR mHealth uHealth 11, e50983 (2023).
Manners, J. et al. Performance evaluation of an under-mattress sleep sensor versus polysomnography in ≥400 nights with healthy and unhealthy sleep. J. Sleep Res. 34, e14480 (2025).
Dominici, F. et al. Fine particulate air pollution and hospital admission for cardiovascular and respiratory diseases. JAMA 295, 1127–1134 (2006).
Mundo, A. I., Tipton, J. R. & Muldoon, T. J. Generalized additive models to analyze nonlinear trends in biomedical longitudinal data using R: Beyond repeated measures ANOVA and linear mixed models. Stat. Med. 41, 4266–4283 (2022).
Wood, S. N. Generalized Additive Models: An Introduction with R. (Chapman and Hall/CRC, 2017).
van Oostrom, S. H., Nooyens, A. C., van Boxtel, M. P. & Verschuren, W. M. Long sleep duration is associated with lower cognitive function among middle-age adults–the Doetinchem Cohort Study. Sleep. Med. 41, 78–85 (2018).
Ma, Y. et al. Association between sleep duration and cognitive decline. JAMA Netw. open 3, e2013573–e2013573 (2020).
You, Y. et al. Inverted U-shaped relationship between sleep duration and phenotypic age in US adults: a population-based study. Sci. Rep. 14, 6247 (2024).
Coutrot, A. et al. Reported sleep duration reveals segmentation of the adult life-course into three phases. Nat. Commun. 13, 7697 (2022).
Tudor-Locke, C., Craig, C. L., Thyfault, J. P. & Spence, J. C. A step-defined sedentary lifestyle index:<5000 steps/day. Appl. Physiol. Nutr., Metab. 38, 100–114 (2013).
Paluch, A. E. et al. Steps per day and all-cause mortality in middle-aged adults in the coronary artery risk development in young adults study. JAMA Netw. Open 4, e2124516–e2124516 (2021).
Paluch, A. E. et al. Prospective association of daily steps with cardiovascular disease: a harmonized meta-analysis. Circulation 147, 122–131 (2023).
Allaire, J. et al. Package ‘networkD3’. D3 JavaScript network graphs from R (2017).
Team, R. C. R: A Language and Environment for Statistical Computing (R Foundation for Statistical Computing, 2013).
Shields, M. & Tremblay, M. S. Sedentary behaviour and obesity. Health Rep. 19, 19–30 (2008).
Mahumud, R. A. et al. Association of dietary intake, physical activity, and sedentary behaviours with overweight and obesity among 282,213 adolescents in 89 low and middle income to high-income countries. Int J. Obes. 45, 2404–2418 (2021).
Silveira, E. A. et al. Sedentary behavior, physical inactivity, abdominal obesity and obesity in adults and older adults: a systematic review and meta-analysis. Clin. Nutr. ESPEN 50, 63–73 (2022).
Tison, G. H. et al. Worldwide physical activity trends since COVID-19 onset. Lancet Glob. Health 10, e1381–e1382 (2022).
McCarthy, H., Potts, H. W. & Fisher, A. Physical activity behavior before, during, and after COVID-19 restrictions: longitudinal smartphone-tracking study of adults in the United Kingdom. J. Med. Internet Res. 23, e23701 (2021).
Tison, G. H. et al. Worldwide effect of COVID-19 on physical activity: a descriptive study. Ann. Intern. Med. 173, 767–770 (2020).
Schepps, M. A., Shiroma, E. J., Kamada, M., Harris, T. B. & Lee, I.-M. Day length is associated with physical activity and sedentary behavior among older women. Sci. Rep. 8, 6602 (2018).
Choi, B. C., Pak, A. W., Choi, J. C. & Choi, E. C. Daily step goal of 10,000 steps: a literature review. Clin. Invest. Med. 30, E146–E151 (2007).
Inoue, K., Tsugawa, Y., Mayeda, E. R. & Ritz, B. Association of daily step patterns with mortality in US adults. JAMA Netw. Open 6, e235174 (2023).
Vanderlinden, J., Boen, F. & Van Uffelen, J. Effects of physical activity programs on sleep outcomes in older adults: a systematic review. Int. J. Behav. Nutr. Phys. Act. 17, 1–15 (2020).
Atoui, S. et al. Daily associations between sleep and physical activity: A systematic review and meta-analysis. Sleep. Med. Rev. 57, 101426–101426 (2021).
Leota, J. et al. Dose-response relationship between evening exercise and sleep. Nat. Commun. 16, 3297 (2025).
Ferguson, T. et al. Effectiveness of wearable activity trackers to increase physical activity and improve health: a systematic review of systematic reviews and meta-analyses. Lancet Digital Health 4, e615–e626 (2022).
Doherty, C., Baldwin, M., Lambe, R., Burke, D. & Altini, M. Readiness, recovery, and strain: an evaluation of composite health scores in consumer wearables. Transl. Exerc. Biomed. 2, 128–144 (2025).
Baldursdottir, B., Taehtinen, R. E., Sigfusdottir, I. D., Krettek, A. & Valdimarsdottir, H. B. Impact of a physical activity intervention on adolescents’ subjective sleep quality: a pilot study. Glob. Health Promot. 24, 14–22 (2017).
Lim, D. C. et al. The need to promote sleep health in public health agendas across the globe. Lancet Public Health 8, e820–e826 (2023).
Althoff, T. et al. Large-scale physical activity data reveal worldwide activity inequality. Nature 547, 336–339 (2017).
Westcott, W. L. Resistance training is medicine: effects of strength training on health. Curr. Sports Med. Rep. 11, 209–216 (2012).
de Havenon, A. et al. Impact of sleep quality and physical activity on blood pressure variability. Plos One 19, e0301631 (2024).
Lloyd-Jones, D. M. et al. Life’s essential 8: updating and enhancing the American Heart Association’s construct of cardiovascular health: a presidential advisory from the American Heart Association. Circulation 146, e18–e43 (2022).
Acknowledgements
This was an unfunded, investigator-initiated study, conceptualised and led by researchers from Flinders Health and Medical Research Institute (Sleep Health)/Adelaide Institute for Sleep health. Withings facilitated access to the data in this study, but had no role in study design, conception, analysis or decision to publish these findings. P.E. is a consultant for Withings. Outside of the present work, J.F. receives doctoral scholarship funding from Hoap/Lumin Sports. B.L. has had research grants from Withings, Medical Research Future Fund (MRFF) and National Health and Medical Research Council (NHMRC). D.J.E. has had research grants from Bayer, Apnimed, Takeda, Invicta Medical, Eli Lilly and Withings. D.J.E. currently serves as a scientific advisor/consultant for Apnimed, Invicta Medical, Takeda and Mosanna. A.C.R. has received research funding from the Lifetime Support Authority, Sleep Health Foundation, Flinders Foundation, MRFF, NHMRC, the Hospital Research Foundation, Compumedics, and Sydney Trains, and speaker and consultancy fees from Teva Pharmaceuticals, Sealy Australia, and the Sleep Health Foundation for work unrelated to this study. H.S. reports consultancy and/or research support from Re-Time Pty Ltd, Compumedics Ltd, the American Academy of Sleep Medicine Foundation, and Flinders University. P.C. reports grants from NHMRC, MRFF, Flinders Foundation, Invicta Medical, Garnett Passe and Rodney Williams Memorial Foundation, Defence Science and Technology Group.
Ethics declarations
Competing interests
The authors declare no competing interests.
Peer review
Peer review information
Communications Medicine thanks Feifei Wang and the other, anonymous, reviewer(s) for their contribution to the peer review of this work.
Additional information
Publisher’s note Springer Nature remains neutral with regard to jurisdictional claims in published maps and institutional affiliations.
Supplementary information
Rights and permissions
Open Access This article is licensed under a Creative Commons Attribution-NonCommercial-NoDerivatives 4.0 International License, which permits any non-commercial use, sharing, distribution and reproduction in any medium or format, as long as you give appropriate credit to the original author(s) and the source, provide a link to the Creative Commons licence, and indicate if you modified the licensed material. You do not have permission under this licence to share adapted material derived from this article or parts of it. The images or other third party material in this article are included in the article’s Creative Commons licence, unless indicated otherwise in a credit line to the material. If material is not included in the article’s Creative Commons licence and your intended use is not permitted by statutory regulation or exceeds the permitted use, you will need to obtain permission directly from the copyright holder. To view a copy of this licence, visit http://creativecommons.org/licenses/by-nc-nd/4.0/.
About this article

Cite this article
Fitton, J., Nguyen, D.P., Lechat, B. et al. Bidirectional associations between sleep and physical activity investigated using large-scale objective monitoring data. Commun Med 5, 519 (2025). https://doi.org/10.1038/s43856-025-01226-6
Received:
Accepted:
Published:
Version of record:
DOI: https://doi.org/10.1038/s43856-025-01226-6