Abstract
The Indonesian archipelago is host to some of the earliest known rock art in the world1,2,3,4,5. Previously, secure Pleistocene dates were reported for figurative cave art and stencils of human hands in two areas in Indonesia—the Maros-Pangkep karsts in the southwestern peninsula of the island of Sulawesi1,3,4,5 and the Sangkulirang-Mangkalihat region of eastern Kalimantan, Borneo2. Here we describe a series of early dated rock art motifs from the southeastern portion of Sulawesi. Among this assemblage of Pleistocene (and possibly more recent) motifs, laser-ablation U-series (LA-U-series) dating of calcite overlying a hand stencil from Liang Metanduno on Muna Island yielded a U-series date of 71.6 ± 3.8 thousand years ago (ka), providing a minimum-age constraint of 67.8 ka for the underlying motif. The Muna minimum (67.8 ± 3.8 ka) exceeds the published minimum for rock art in Maros-Pangkep by 16.6 thousand years (kyr) (ref. 5) and is 1.1 kyr greater than the published minimum for a hand stencil from Spain attributed to Neanderthals6, which until now represented the oldest demonstrated minimum-age constraint for cave art worldwide. Moreover, the presence of this extremely old art in Sulawesi suggests that the initial peopling of Sahul about 65 ka7 involved maritime journeys between Borneo and Papua, a region that remains poorly explored from an archaeological perspective.
Main
A noteworthy finding of the past decade has been the discovery and dating of Pleistocene-aged rock art in Sulawesi, the largest island in Wallacea—the oceanic island zone separating the continental regions of Southeast Asia (Sunda) and Australia–New Guinea (Sahul)—and on the edge of the Sunda continental shelf (present-day Borneo) to its immediate west1,2,3,4,5,8. In Sulawesi, U-series dating of rock art motifs (n = 23), including hand stencils (n = 13) and figurative paintings of animals (n = 7) and anthropomorphs (n = 3), has yielded minimum ages ranging from 51.2 kyr to 17 kyr (refs. 1,2,3,4,5). All of the dated rock art sites are located in the approximately 450 km2 lowland ‘tower’ karst region of Maros-Pangkep in the southwestern peninsula of Sulawesi. On the opposing southern peninsula, known as Southeast Sulawesi, an area that includes several satellite islands, the presence of rock art inside limestone karst caves was first reported in 1977 (ref. 9). The art in this region, however, has remained underinvestigated compared with Maros-Pangkep art (itself poorly known until recently). Beginning in 2019, we have undertaken a programme of recording and dating of parietal imagery in Southeast Sulawesi, resulting in the documentation of 44 sites (including 14 new localities), and the dating of 11 individual rock art motifs at 8 sites (Fig. 1). The dated motifs comprised seven hand stencils, and four other paintings (two of human figures and two non-figurative, geometric motifs). We used a new method of U-series dating (LA-U-Series analysis) reported elsewhere5 to obtain age estimates for calcium carbonate deposits that had formed in association with these rock art motifs. In all cases, we obtained minimum ages for the parietal images by dating calcite materials that had formed directly on top of the rock art through natural calcium carbonate precipitation. In some instances, we also obtained maximum ages by dating calcium carbonate layers immediately below the pigment layers.

a, The proposed modern human migration routes from Sunda to Sahul; the northern route through Wallacea is delineated by the red arrows, and the southern route is delineated by the blue arrow21. The red dots represent the areas with Pleistocene rock art in eastern Borneo and southwestern Sulawesi. b, Map of Sulawesi showing the location of dated rock art sites in Southeast Sulawesi: (1) Liang Metanduno, (2) Liang Pominsa, (3) Gua Kaghofighofine, (4) Madongka 3 rock shelter, (5) Waburi 1 rock shelter, (6) Lia Bunta rock shelter, (7) Gua Anawai, (8) Gua Mbokita and (9) Gua Berlian. m + MSL, metres above mean sea level. Map data adapted from General bathymetric maps (https://www.gebco.net/data_and_products/gridded_bathymetry_data/) and DEMNAS Badan Informasi Geospasial (https://tanahair.indonesia.go.id/demnas/#/demnas).
Rock art dating results
All but one of the sampled hand stencils (n = 6) from Southeast Sulawesi date to the Pleistocene, whereas the remaining paintings mainly consist of motifs with more recent (that is, Holocene) minimum ages (Supplementary Table 1). The oldest minimum-age constraint we obtained is for a hand stencil (sample LMET2) from Liang Metanduno in Muna Island (Fig. 2). This motif is partly covered by ancient coralloid speleothems. This stencil is in a poor state of preservation, comprising only a 14 × 10 cm patch of faded pigment bearing a portion of the fingers and the adjoining palm area. The tip of one finger appears to have been artificially narrowed, either through the additional application of pigment or by moving the hand during pigment application9, a distinct type of hand stencil art thus far identified only in Sulawesi10. Dating results show that this stencil was produced at least 67.8 thousand years ago (ka) (71.6 ± 3.8 ka) (Fig. 3). An additional coralloid speleothem (denoted as LMET1) was sampled over another hand stencil located on the same panel 11 cm to the left of the previous one (Fig. 4). This motif is also partly covered over by ancient coralloid speleothems, with only a portion of the original stencil remaining in the form of a 14 × 9 cm area of sprayed pigment bearing negative impressions of three fingers. The pigment appears darker in colour than the other visible hand stencils on the panel. Sample LMET1 comprises two distinct pigment layers embedded within the calcium carbonate. The stratigraphically oldest pigment layer has a minimum date of 60.9 ka (70.5 ± 9.5 ka), whereas the second pigment layer has a minimum date of 21.5 ka (22.8 ± 1.3 ka) and a maximum date of 32.8 ka (30 ± 2.8 ka). Close inspection shows that the darker pigment overlies the lighter pigment on the visible portion of the image. The lighter pigment may correspond to an earlier hand stencil or represent residual sprayed pigment associated with the hand stencil sampled as LMET2. Alternatively, the lighter layer may be the remains of a different motif, now obscured or no longer visible, that predates the overlying pigment. Regardless, it is evident from LMET1 that two episodes of Pleistocene rock art production on this panel are separated by a period of at least 35 kyr. Finally, as the oldest narrow-fingered stencil previously dated yielded a minimum date of 17 ka (ref. 1), we may conclude that this regionally unique variant of stencil art is much older than previously thought10.
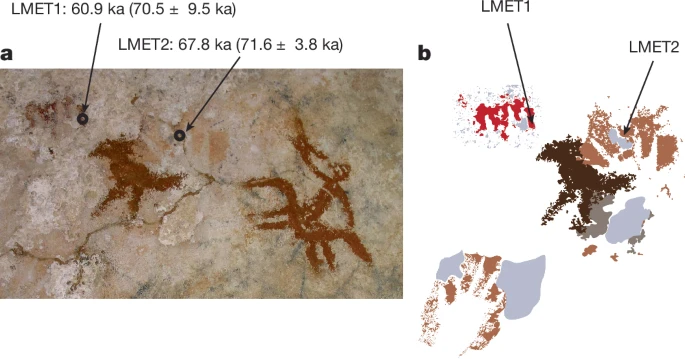
a,b, Samples LMET1 and LMET2 collected from over distinct hand stencils: photograph of the rock art panel with the two hand stencils (a) and digital tracing (b).

a, Transect view of sample LMET2 after removal from over a distinct hand stencil, highlighting the paint layer and the three integration zones (region of integration (ROI)) and associated date calculation. b, Schematic showing the main features. c, LA-MC-ICPMS imaging of LMET2 isotopic activity ratios for 232Th/238U. d, As in c, for 230Th/238U. e, As in c, for 234U/238U. f, As in c, for concentrations for thorium-232. g, As in c, for concentrations of uranium-238.

a, Transect view of sample LMET1 after removal from over a distinct hand stencil, highlighting the paint layer and the five integration zones (ROI) and associated date calculation. b, Schematic showing the major features. c, LA-MC-ICPMS imaging of LMET2 isotopic activity ratios for 232Th/238U. d, As in c, for 230Th/238U. e, As in c, for 234U/238U. f, As in c, for concentrations for thorium-232. g, As in c, for concentrations of uranium-238.
Liang Metanduno also contains paintings that appear to be much younger than the two dated hand stencils, based on the extent of weathering and other observations. These much fresher-looking artworks, executed using a brownish pigment, have been applied over existing speleothems and the ‘new’ cave wall surface exposed by the exfoliation of the older surface bearing the hand stencils, as well as over the dated hand stencils themselves. Among the images, a figurative representation of a bird, probably a chicken (Gallus sp.), measuring 13.5 cm × 12 cm, is located between the two dated hand stencils (Supplementary Information). The depicted subject matter (for example, introduced domestic fauna) attributes these figures to or after the arrival of Austronesian-speaking ‘Neolithic’ societies in the region11,12 (about 4–3.5 ka). At a nearby cave, Gua Pominsa, a similar brown-pigment image showing a human figure possibly holding material culture objects in both hands yielded a minimum date of 3.9 ka (5 ka ± 1.1 ka) (GPOM1) (Extended Data Fig. 1). This figure is possibly the oldest evidence of Austronesian culture identified thus far in the region.
Dating of several other hand stencils from southeastern Sulawesi produced minimum dates falling within the Late Pleistocene epoch. In Gua Mbokita, a limestone cave in the Menui Kepulauan district, two samples provided minimum dates of 44.7 ka (50.8 ± 6.1 ka) (MBK1) and 25.9 ka (31.1 ± 5.2 ka) (MBK2) (Extended Data Fig. 2). Two separate hand stencils from Gua Anawai were also dated to a minimum of 19.1 ka (19.9 ± 0.8 ka) (ANW1) and 20.1 ka (22.1 ± 2.1 ka) (ANW2), respectively (Extended Data Figs. 3 and 4). A maximum date of 20.4 ka was also obtained for ANW1, suggesting that these hand stencils were produced between 20.1 and 20.4 ka and that people were creating them until at least the Last Glacial Maximum.
Further dating results for other motifs, including artworks that are likely to be much younger than these hand stencils (although we only have minimum ages for the former), are reported in Extended Data Figs. 5–9 and Supplementary Table 1.
Implications for early human migration
Our dating investigation in Southeast Sulawesi shows that extremely old rock art is not just concentrated in the Maros-Pangkep district in the southwestern peninsula but occurs in other parts of this large Wallacean island (about 174,000 km2). These findings support the growing view that Sulawesi was host to a vibrant and longstanding artistic culture during the Late Pleistocene epoch10,13. Two artworks we dated in Southeast Sulawesi also have far-reaching implications for our understanding of early human history. With minimum-age constraints of 67.8 ka (71.6 ± 3.8 ka) and 60.9 ka (70.5 ± 9.5 ka), the hand stencils from Liang Metanduno provide the oldest demonstrated minimum-age constraints reported to date worldwide for parietal art that can be attributed to our species. Previously reported evidence for very early rock art in Europe, a region first inhabited by Homo sapiens around 54 ka (ref. 14) (although this remains debated15), includes a sprayed disc with a published minimum date of 40.8 ka (41.4 ± 0.6 ka)16 and a hand stencil from northern Spain (Maltravieso) with a published minimum date of 66.7 ka (70.1 + 3.8–3.4 ka)6. The latter motif has been attributed to Neanderthals, but its dating has been controversial17,18,19,20,21,22,23,24 (Methods, section ‘Interpretation of U-series ages’).
There is no obvious method available to us to determine which human taxon produced the Liang Metanduno stencil (LMET2), and, to further complicate matters, Sulawesi was host to archaic hominins before colonization by modern humans25,26—although it remains unclear whether there was a chronological overlap with our species on the island27. Nevertheless, we attribute the earliest cave art of Muna to H. sapiens based on the added technical and stylistic complexity of the intentionally modified fingers on the hand stencil and the close fit with the known arrival time of our species in the region.
About the latter, the colonization of Sahul by modern humans is now thought to have occurred by at least 68.7–59.3 ka (65.0 ka ± 3.7, 5.7 ka), based on excavated findings at Madjedbebe in northern Australia7. The initial peopling of this continent is widely considered to have involved the first planned, long-distance sea crossing undertaken by our species. The earliest intentional ocean voyages over shorter distances took place when H. sapiens spread beyond the extreme eastern edge of the Eurasian continent (Sunda) and crossed the ‘Wallace Line’, the main biogeographical boundary marking the easternmost limit of the floral and faunal communities of Asia. Modelling data, based on palaeogeographic, environmental and demographic reconstructions, favours two main routes from Sunda to Sahul28,29,30,31,32. The northern route began in present-day Borneo (Sunda) and passed through Sulawesi and from there to Sahul through Misool or the western tip of Papua28. The southern route runs eastwards from Java through the Lesser Sunda Islands to northwestern Australia (through Timor)28 (Fig. 1). Current archaeological evidence demonstrates an early presence of modern humans at the nominal beginning and end points of these routes7,33,34 (Laos by 86–68 ka, Sumatra by 73–63 ka and Australia by 69–59 ka). Although modelling suggests an early dispersal to Sahul through the northern route, possibly with a later (that is, about 45 ka) secondary dispersal along the southern route30,31,35, there has been no archaeological evidence so far to bolster this scenario. A gap of about 15 kyr in modern human sites between Sumatra and Australia and the broader region between them has made it impossible to support any particular migratory pathway to Sahul.
The newly discovered Liang Metanduno hand stencils are the oldest archaeological evidence revealed so far for the presence of our species in Wallacea. Notably, the dated rock art presented here is the easternmost in Wallacea and is located along the northern route to Sahul, as is all of the dated Pleistocene cave art reported thus far from Island Southeast Asia1,2,3,4,5,8. This strongly supports the view that the initial peopling of the Sahul landmass involved maritime journeys through northern Wallacea. It is also evident from our findings that the first modern humans to reach Sahul about 65 ka brought with them a sophisticated artistic culture, with implications for the likely age of early painted rock art sequences in northern Australia36. Given the extreme antiquity of the Liang Metanduno stencil, it seems reasonable to anticipate that evidence for rock art production of a similar age will be present at other locations along the northern route to Sahul.
Methods
All dating work was undertaken at the BIOMICS laboratory in the Geoarchaeology and Archaeometry Research Group (GARG) of Southern Cross University (Lismore, New South Wales, Australia). U-series measurements were obtained using an ESI NW193 ArF excimer laser ablation unit coupled to a MC-ICPMS ThermoFishers Neptune XT. Each sample was measured by a succession of parallel rasters across the exposed polished cross-section (geochemical imaging), allowing us to reconstruct an isotopic map of the precipitated calcite, or by successive parallel rasters along the concretion formation of the sample. Imaging rasters had different lengths to adapt to the irregular shape of the sample using the following parameters for mapping: a square spot size of 44 μm × 44 μm using the infinite aperture of the laser system matched by a translation speed of 21 μm s−1 and integration time of 2.097 s on the MC-ICPMS Neptune XT. This combination of parameters allowed us to obtain within <0.1% a pixel on the map equivalent to a 44 μm × 44 μm data point (the exact translation speed to obtain an exact data-pixel of 44 μm × 44 μm would be 20.982 μm s−1).
On non-mapped samples, individual rasters had systematically the same length within the same sample around about 700 μm following parameters for mapping: a square spot size of 110 μm × 110 μm using the infinite aperture of the laser system with a translation speed of 5 μm s−1 and integration time of 4.194 s on the MC-ICPMS Neptune XT.
Other parameters for the data acquisition were as follows: 900 ml min−1 UHP He and 6 ml min−1 UHP nitrogen for the gas flow from the chamber to the ICPMSs, rep rate of 100 Hz for the laser frequency and an average of 1.92 J cm−2 sample fluence. 234U and 230Th were measured simultaneously, with uranium in the centre Faraday cup coupled with a secondary electron multiplier (SEM) and thorium on the L3 Faraday cup coupled to an ion counter (IC). All other Faraday cups were set to using high-gain 1011 Ω amplifiers. The cup configuration was as follows: L3/IC(230), L2(232), L1(233), C/SEM(234), H1(235), H2(236) and H3(238). Baseline and drifts were corrected using NIST 610 and NIST 612 glass standards, whereas two corals (the MIS7 Faviid and MIS5 Porites corals from the Southern Cook Islands)37 were used to correct 234U/238U and 230Th/238U ratios and assess the accuracy of measurements.
Image and data processing
Isotopic mapping obtained by LA-MC-ICP-MS data was extracted using the Iolite 4 software package38. The data were accumulated in a single file on the MC-ICPMS Neptune XT as follows: 5 min background, NIST610 (3×), NIST612 (3×), STD1 (3×), STD2 (3×), sample rasters (n×), STD2 (3×), STD1 (3×), NIST612 (3×), NIST610 (3×) and 5 min background. For sample imaging sequences longer than 2 h, a set of standards (for example, STD1 (3×) and STD2 (3×)) was incorporated in the middle of the measurement. Data reduction used NISTs to assess drift and the 5-min background on each side of the measurements for baseline. One standard (MK10) was used for correction of the isotopic ratios, whereas the other one (MK16) was used as known values to check data accuracy (including for matrix effect). The images were produced using a spectrum gradient colour distribution, with either linear or logarithmic scale (specified for each sample on the isotopic maps). Regions of integration (ROIs) were carefully selected on the 232Th/238U and 230Th/238U isotopic ratio maps and Uppm maps to be as close to the paint layer as possible, while avoiding diagenetic zones. Data errors were extracted and reported at 2 standard error. ROIs located immediately above the pigment layers were selected for calculating the minimum ages relating to the underlying paintings. U-series data were integrated for individual ROIs, resulting in U-series ages and associated errors. Sufficient data points were also selected to minimize the errors. The integration area of each ROI is reported in μm2 (Supplementary Table 1).
Raster measurement
The data were accumulated in a single file on the MC-ICPMS Neptune XT as follows: 5 min background, NIST610 (3×), NIST612 (3×), STD1 (3×), STD2 (3×), sample rasters (n×), STD2 (3×), STD1 (3×), NIST612 (3×), NIST610 (3×) and 5 min background. For sample imaging sequences or several raster measurements in the row longer than 2 h, a set of standards (for example, STD1 (3×) and STD2 (3×)) was incorporated in-between samples. Data reduction used NISTs to assess drift and the 5-min background on each side of the measurements for baseline. One standard (MK10) was used for the correction of the isotopic ratios, and the other (MK16) was used as known values to check data accuracy (including for matrix effect). Rasters are placed starting as close as the paint layer and spaced uniformly along the axis perpendicular to the first raster. Yet, to avoid an obvious diagenetic zone, the position of the raster in certain circumstances may have been adjusted (Extended Data Figs. 1, 3, 7). U-series data were integrated for each individual raster, resulting in U-series ages and associated errors (Supplementary Table 1).
Tuning procedures were carried out using a NIST 610 glass standard with the following parameters: a 50 µm spot size, translation speed set to 5 µm s−1, and a fluence of >1 J cm−2 at the sample surface. The Multicollector Zoom Optic is optimized to ensure optimal peak shape for 238U in Faraday cup H3, with signal adjustments made to achieve a minimum of 1 V for 238U and maintain a 0.85 ratio factor between 232Th and 238U voltages (Faraday cups L2 and H3, respectively). In the case of the samples analysed in this study, the average measures for 238U exceeded 3 V. Following tuning with NIST 610, fine-tuning was carried out using A MIS7 (MK10) Faviid coral from the southern Cook Islands37, with particular attention to comparing R48 values between the laser and the solution. For geochemical imaging, a spot size of 44 µm with a laser rastering speed of 21 µm s−1 with a 2.097 s integration time was optimal for most circumstances, with the number of blocks varying depending on the measurement sequence. Yet, on average, measurements were conducted with a total block number of about 10, with 200 cycles per block. Individual raster measurements were carried out a spot size of 100 µm with a laser rastering speed of 5 µm s−1 and a 4.194 s integration time.
The MK10 coral standard is also used to correct the 234U/238U and 230Th/238U ratios. Another coral sample, a MSI5 (MK16) Porite coral also from the southern Cook Islands37, is used to independently check the accuracy of the measurements and dating results. Both coral samples were reduced to powder to homogenize their values before being run by solution MC-ICPMS. The remaining homogeneous powder samples were consolidated using a uranium- and thorium-free resin and used as standards for LA-MC-ICPMS. Standards were measured in the following order: 3× NIST610, 3× NIST612, 3× CoralSTD1 and 3× CoralSTD2 at the beginning of each sample and at the end in a mirroring order. The aforementioned list of standards was measured in between each sample with a maximum of 2 h in-between standard sets. We used the same coral-based laser-ablation U–Th calibration approach as in our previous study, in which we demonstrated that laser ablation and solution U-series ages of calcite crusts were indistinguishable within analytical uncertainty, indicating that any matrix effects between coral (aragonite) and calcite are negligible under comparable analytical conditions5.
It is not unusual for secondary calcium carbonate to contain detrital materials such as wind-blown or waterborne sediments, which can contaminate the sample and lead to U-series ages that appear older than they actually are. This occurs because of pre-existing 230Th in the detrital components. As it is impossible to physically separate detrital/initial 230Th from radiogenic 230Th for measurement, corrections are made using an assumed 230Th/232Th activity ratio. Typically, the average continental crust value of 232Th/238U = 3.8 is used for these corrections, with an uncertainty of 100%. The measured 230Th/232Th activity ratio reflects the degree of detrital contamination, with the higher values (>20) indicating a smaller effect on the calculated age, whereas the lower values (<20) suggest a major correction is needed. In samples with a measured 230Th/232Th activity ratio >20, the detrital 230Th accounts for only a small percentage of the total 230Th in the sample.
Sometimes, the assumed 230Th/232Th activity ratio of 0.8 (±100%) for the detrital component may not cover all situations39. If the actual 230Th/232Th activity ratio in the detrital component substantially deviates from this assumed range, the detrital correction scheme may introduce considerable bias, especially in samples with a 230Th/232Th activity ratio <20. In these situations, the 230Th/232Th activity ratio in the detrital component can be obtained through direct measurement of sediments associated with speleothems6 or computed using isochron methods or stratigraphic constraints40. In our case, our samples were relatively pure: the 230Th/232Th activity ratio of individual aliquots was extremely high. Corrections for detrital components were therefore calculated assuming the bulk-Earth values.
A conceivable problem with the U-series dating method is that calcium carbonate accretions can behave as an open system for uranium, in which the element can be leached out of the accretions or remobilized41. In these instances, the calculated ages will be too old because the dating method relies on the accurate measurement of uranium compared with its decay product 230Th. In this study, this problem was tackled by avoiding porous samples and by measuring ROIs and multiple rasters from every sample. The ages of these subsamples were in chronological order or of similar ages within error, confirming the integrity of the dated coralloids. If uranium had leached out of the samples, a reverse age profile would have been evident (the ages would have gotten older towards the surface). Age calculations were performed using IsoplotR v.6.8 (ref. 42). Ages are reported at 2 standard error.
Interpretation of U-series ages
Ages derive from LA-U-series analysis of carbonate overgrowths and therefore provide minimum-age constraints, that is, conservative lower bounds on painting age. Differences between minima do not by themselves demonstrate that one painting predates another. Accordingly, comparisons throughout the text refer to differences in minimum-age constraints unless stated otherwise.
Reporting summary
Further information on research design is available in the Nature Portfolio Reporting Summary linked to this article.
Data availability
The data supporting the findings of this study are provided in the Supplementary Information. Raw and additional source data are available from publicly available at Zenodo43 (https://zenodo.org/uploads/17561904).
References
Aubert, M. et al. Pleistocene cave art from Sulawesi, Indonesia. Nature 514, 223–227 (2014).
Aubert, M. et al. Palaeolithic cave art in Borneo. Nature 564, 254–257 (2018).
Aubert, M. et al. Earliest hunting scene in prehistoric art. Nature 576, 442–445 (2019).
Brumm, A. et al. Oldest cave art found in Sulawesi. Sci. Adv. 7, eabd4648 (2021).
Oktaviana, A. A. et al. Narrative cave art in Indonesia by 51,200 years ago. Nature 631, 814–818 (2024).
Hoffmann, D. L. et al. U-Th dating of carbonate crusts reveals Neandertal origin of Iberian cave art. Science 359, 912–915 (2018).
Clarkson, C. et al. Human occupation of northern Australia by 65,000 years ago. Nature 547, 306–310 (2017).
Aubert, M., Brumm, A. & Taçon, P. S. C. The timing and nature of human colonization of Southeast Asia in the late Pleistocene. Curr. Anthropol. 58, S553–S566 (2017).
Oktaviana, A. A. in The Archaeology of Sulawesi: Current Research on the Pleistocene to the Historic Period (eds O’Connor et al.) Vol. 48, 61–77 (ANU Press, 2018).
Oktaviana, A. A. et al. Hand stencils with and without narrowed fingers at two new rock art sites in Sulawesi, Indonesia. Rock Art Res. 33, 32–48 (2016).
Bellwood, P. First Islanders: Prehistory and Human Migration in Island Southeast Asia (John Wiley, 2017).
Cochrane, E. E., Rieth, T. M. & Filimoehala, D. The first quantitative assessment of radiocarbon chronologies for initial pottery in Island Southeast Asia supports multi-directional Neolithic dispersal. PLoS ONE 16, e0251407 (2021).
Brumm, A. et al. Early human symbolic behavior in the late Pleistocene of Wallacea. Proc. Natl Acad. Sci. USA 114, 4105–4110 (2017).
Slimak, L. et al. Modern human incursion into Neanderthal territories 54,000 years ago at Mandrin, France. Sci. Adv. 8, eabj9496 (2022).
Zilhão, J., d’Errico, F., Banks, W. E. & Teyssandier, N. A data-driven paradigm shift for the Middle-to-Upper Palaeolithic transition and the Neandertal debate. Quat. Environ. Hum. 2, 100037 (2024).
Pike, A. W. G. et al. U-series dating of Paleolithic art in 11 caves in Spain. Science 336, 1409–1413 (2012).
Aubert, M., Brumm, A. & Huntley, J. Early dates for ‘Neanderthal cave art’ may be wrong. J. Hum. Evol. 125, 215–217 (2018).
Pearce, D. G. & Bonneau, A. Trouble on the dating scene. Nat. Ecol. Evol. 2, 925–926 (2018).
White, R. et al. Still no archaeological evidence that Neanderthals created Iberian cave art. J. Hum. Evol. 144, 102640 (2020).
Hoffmann, D. L. et al. Response to comment on “U-Th dating of carbonate crusts reveals Neandertal origin of Iberian cave art”. Science 362, eaau1736 (2018).
Hoffmann, D. L. et al. Dates for Neanderthal art and symbolic behaviour are reliable. Nat. Ecol. Evol. 2, 1044–1045 (2018).
Hoffmann, D. L. et al. Response to Aubert et al.’s reply ‘Early dates for “Neanderthal cave art”may be wrong’ [J. Hum. Evol. 125 (2018), 215–217]. J. Hum. Evol. 135, 102644 (2019).
Hoffmann, D. L. et al. Response to White et al.’s reply: ‘Still no archaeological evidence that Neanderthals created Iberian cave art’ [J. Hum. Evol. (2020) 102640]. J. Hum. Evol. 144, 102810 (2020).
Standish, C. D. et al. The age of hand stencils in Maltravieso cave (Extremadura, Spain) established by U-Th dating, and its implications for the early development of art. J. Archaeol. Sci. Rep. 61, 104891 (2025).
van den Bergh, G. D. et al. Earliest hominin occupation of Sulawesi, Indonesia. Nature 529, 208–211 (2016).
Hakim, B. et al. Hominins on Sulawesi during the Early Pleistocene. Nature 646, 378–383 (2025).
Brumm, A. et al. A reassessment of the early archaeological record at Leang Burung 2, a Late Pleistocene rock-shelter site on the Indonesian island of Sulawesi. PLoS ONE 13, e0193025 (2018).
Birdsell, J. in Sunda and Sahul: Prehistoric Studies in Southeast Asia, Melanesia and Australia (eds Allen, J. et al.) 113–167 (Academic Press, 1977).
Kealy, S., Louys, J. & O’Connor, S. Reconstructing palaeogeography and inter-island visibility in the Wallacean Archipelago during the likely period of Sahul colonization, 65–45 000 years ago. Archaeol. Prospect. 24, 259–272 (2017).
Kealy, S., Louys, J. & O’Connor, S. Least-cost pathway models indicate northern human dispersal from Sunda to Sahul. J. Hum. Evol. 125, 59–70 (2018).
Norman, K. et al. An early colonisation pathway into northwest Australia 70–60,000 years ago. Quat. Sci. Rev. 180, 229–239 (2018).
Bird, M. I. et al. Early human settlement of Sahul was not an accident. Sci. Rep. 9, 8220 (2019).
Westaway, K. E. et al. An early modern human presence in Sumatra 73,000–63,000 years ago. Nature 548, 322–325 (2017).
Freidline, S. E. et al. Early presence of Homo sapiens in Southeast Asia by 86–68 kyr at Tam Pà Ling, Northern Laos. Nat. Commun. 14, 3193 (2023).
Bradshaw, C. J. A. et al. Minimum founding populations for the first peopling of Sahul. Nat. Ecol. Evol. 3, 1057–1063 (2019).
Brumm, A., Oktaviana, A. A. & Aubert, M. in Deep-Time Images in the Age of Globalization (eds Abadia, O. M. et al.) 31–44 (Springer, 2024).
Woodroffe, C. D., Short, S. A., Stoddart, D. R., Spencer, T. & Harmon, R. S. Stratigraphy and chronology of late Pleistocene reefs in the southern Cook Islands, South Pacific. Quat. Res. 35, 246–263 (1991).
Paton, C., Hellstrom, J., Paul, B., Woodhead, J. & Hergt, J. Iolite: freeware for the visualisation and processing of mass spectrometric data. J. Anal. At. Spectrom. 26, 2508 (2011).
Zhao, J., Yu, K. & Feng, Y. High-precision 238U–234U–230Th disequilibrium dating of the recent past: a review. Quat. Geochronol. 4, 423–433 (2009).
Hellstrom, J. U–Th dating of speleothems with high initial 230Th using stratigraphical constraint. Quat. Geochronol. 1, 289–295 (2006).
Plagnes, V. et al. Cross dating (Th/U-14 C) of calcite covering prehistoric paintings in Borneo. Quat. Res. 60, 172–179 (2003).
Vermeesch, P. IsoplotR: a free and open toolbox for geochronology. Geosci. Front. 9, 1479–1493 (2018).
Oktaviana, A. A. et al. Data for ‘Rock art from at least 67,800 years ago in Sulawesi’. Zenodo https://zenodo.org/uploads/17561904 (2025).
Acknowledgements
This research was funded by the Australian Research Council (ARC) fellowships awarded to M.A. (FT170100025), A.B. (FT160100119), R.J.-B. (LE200100022) and ARC Discovery Project DP220100462, with further financial support from Griffith University, Southern Cross University, Google Arts and Culture, and the National Geographic Society (NGS-72460R-20). We thank the State Ministry of Research and Technology (RISTEK) and the National Research and Innovation Agency (BRIN) of Indonesia. We thank A. Ardiansyah, A. Azhar, H. Arifianto, Haedar, Aksul, H. Wahyudi, L. Samada, Ajuk, Y. Prasetyo and T. L. Sohi for providing assistance in the field.
Ethics declarations
Competing interests
The authors declare no competing interests.
Peer review
Peer review information
Nature thanks the anonymous reviewer(s) for their contribution to the peer review of this work. Peer reviewer reports are available.
Additional information
Publisher’s note Springer Nature remains neutral with regard to jurisdictional claims in published maps and institutional affiliations.
Extended data figures and tables
Extended Data Fig. 1 Dated rock art from Liang Pominsa.
a-b, Dating sample GPOM1, collected from flowstone covering part of the head of a human figure (25 ×24 cm, executed in brown pigment) portrayed in a standing position with material culture objects in both hands. (a, photograph of human figure; b, digital tracing). c, Sample GPOM1 in cross-section, showing the location of the transect of dated sub-samples on top of the pigment layer. The human figure has a minimum age of 3.9 ka (5.0 ka ± 1.1 ka) (GPOM1). Individual rasters are 700μm in length.
Extended Data Fig. 2 Dated rock art from Gua Mbokita.
a-b, Samples MBK1 and MBK2, collected from over a red hand stencil measuring 24 ×17 cm (a, photograph of the hand stencil enhanced using DStretch filter ac_cb_rgb; b, digital tracing). c, Sample MBK1 in cross-section, showing the location of the transect of three dated sub-samples on top of the pigment layer; the oldest minimum ages is 44.7 ka (50.8 ka ± 6.1 ka). d, Sample MBK2 in cross-section, showing the location of the transect of three dated sub-samples on top of the pigment layer; the oldest minimum age is 25.9 ka (31.1 ± 5.2 ka). Individual rasters are 700μm in length.
Extended Data Fig. 3 Dated rock art from Gua Anawai.
a-b, Sample ANW1, collected from over a red hand stencil measuring 14 ×12 cm (a, photograph of the hand stencil; b, digital tracing). c, Sample ANW1 in cross-section, showing the location of the transect of three dated sub-samples on top of the pigment layer and two below. The hand stencil has a minimum of 19.1 ka (19.9 ka ± 0.8 ka) and a maximum age of 20.4 ka (19.2 ka ± 1.2 ka). Individual rasters are 700μm in length.
Extended Data Fig. 4 Dated rock art from Gua Anawai.
a-b, Sample ANW2, collected from over a red hand stencil measuring 15 ×14 cm (a, photograph of the hand stencil enhanced using DStretch filter_lre; b, digital tracing). c, Sample ANW2 in cross-section, showing the location of the transect of four dated sub-samples on top of the pigment layer. The hand stencil has a minimum age of 20.1 ka (22.1 ka ± 2.1 ka) (ANW2). Individual rasters are 700μm in length.
Extended Data Fig. 5 Dated rock art from Gua Berlian.
a-b, Sample BRL, collected from over a red hand stencil measuring 18 ×16 cm (a, photograph of the hand stencil enhanced using DStretch filter_lds; b, digital tracing). c, Sample BRL in cross-section, showing the location of the dated sub-sample on top of the pigment layer. The stencil has a minimum age of 17.3 ka (33.1 ka ± 15.9 ka) and a maximum age of 20.4 ka(BRL). Individual rasters are 700μm in length.
Extended Data Fig. 6 Dated rock art from Lia Bunta rock shelter.
a-b, Sample BNT, collected from over a non-figurative motif consisting of red lines (a, photograph of the rock art motif enhanced using DStretch filter_yrd_ac_cb; b, digital tracing). c, Sample BNT in cross-section, showing the location of the transect of five dated sub-samples on top of the pigment layer. The artwork has a minimum age of 3.7 ka (5.1 ka ± 1.4 ka) (BNT). We interpret the older raster at 6.6 ka towards the surface of the samples to be affected by diagenesis. Individual rasters are 700μm in length.
Extended Data Fig. 7 Dated rock art from Madongka 3 rock shelter.
a-b, Sample MDK3, collected from over a red hand stencil (a, photograph of the rock art motif enhanced using DStretch filter_lds_ac_cb; b, digital tracing). c, Sample MDK3 in cross-section, showing the location of the transect of three dated sub-samples on top of the pigment layer. The artwork has a minimum of 4.5 ka (6.5 ± 1.6) and a maximum age of 11.8 ka (9.7 ± 2.1) (MDK3). Individual rasters are 700μm in length.
Extended Data Fig. 8 Dated rock art from Waburi 1 rock shelter.
a-b, Sample WBR1, collected from over a geometric motif (a, photograph of the rock art enhanced using DStretch filter ac_cb_lds; b, digital tracing). c, Sample WBR1 in cross-section, showing the location of the transect of three dated sub-samples on top of the pigment layer and one below. The artwork has a minimum age of 7.54 ka (10.0 ka ± 1.8 ka) and a maximum age of 16.4 ka (13.9 ka ± 2.5 ka) (WBR1). Individual rasters are 700μm in length.
Extended Data Fig. 9 Dated rock art from Gua Kaghofighofine.
a-b, Sample KGH1, collected from over a human figure executed in black pigment (a, photograph of the rock art motif enhanced using DStretch filter ybk_cb_ac; b, digital tracing). c, Sample KGH11 in cross-section, showing the location of the dated sub-sample on top of the pigment layer. The artwork has a minimum age of 0.3 ka (0.5 ka ± 0.2 ka) (KGH1). Individual rasters are 700μm in length.
Supplementary information
Rights and permissions
Open Access This article is licensed under a Creative Commons Attribution-NonCommercial-NoDerivatives 4.0 International License, which permits any non-commercial use, sharing, distribution and reproduction in any medium or format, as long as you give appropriate credit to the original author(s) and the source, provide a link to the Creative Commons licence, and indicate if you modified the licensed material. You do not have permission under this licence to share adapted material derived from this article or parts of it. The images or other third party material in this article are included in the article’s Creative Commons licence, unless indicated otherwise in a credit line to the material. If material is not included in the article’s Creative Commons licence and your intended use is not permitted by statutory regulation or exceeds the permitted use, you will need to obtain permission directly from the copyright holder. To view a copy of this licence, visit http://creativecommons.org/licenses/by-nc-nd/4.0/.
About this article

Cite this article
Oktaviana, A.A., Joannes-Boyau, R., Hakim, B. et al. Rock art from at least 67,800 years ago in Sulawesi. Nature (2026). https://doi.org/10.1038/s41586-025-09968-y
Received:
Accepted:
Published:
Version of record:
DOI: https://doi.org/10.1038/s41586-025-09968-y