Main
The Alaskan Iñupiat Inuit, who carry on a long tradition of subsistence hunting of the bowhead whale (Balaena mysticetus), a large baleen whale species, maintain that these animals “live two human lifetimes”3. Subsequent scientific study and age estimation through quantification of ovarian corpora, baleen dating and eye lens aspartic acid racemization analysis have supported a maximum lifespan exceeding 200 years in the bowhead whale4,5,6,7,8,9. Thus, the range of mammalian lifespans covers roughly 2 orders of magnitude, with the model organism Mus musculus living for 2–3 years, while the bowhead whale lives 100 times as long. Furthermore, the bowhead whale can exceed 80,000 kg in mass1. Long life and large body mass predispose the bowhead whale to accumulating large numbers of DNA mutations throughout life. However, an increased number of cells and cell divisions in larger organisms does not lead to increased cancer incidence and shorter lifespans10. The apparent contradiction between expected and observed cancer rates in relation to species body mass has been noted for decades and is known as Peto’s paradox2,10,11,12. To remain alive for so long the bowhead whale must possess uniquely potent genetic mechanisms to prevent cancer and other age-related diseases. However, research on genetic and molecular mechanisms of ageing in the bowhead whale is scarce, consisting primarily of genome and transcriptome analysis13,14,15.
The multi-stage model of carcinogenesis posits that the transition from a normal cell to a cancer cell involves multiple distinct genetic ‘hits’ (mutations)16. Larger and longer-living species might require greater numbers of hits for oncogenic transformation, given their greater cell number and increased lifespan. Consistently, Rangarajan et al.17 found that whereas mouse fibroblasts require perturbation of two pathways for tumorigenic transformation (p53 and Ras), human fibroblasts require five hits (p53, RB, PP2A, telomerase and Ras). Species that are larger-bodied and longer-lived may be expected to have even more layers of protection against oncogenic transformation than humans. In support of this hypothesis, studies have identified copy number expansion and functional diversification of multiple tumour suppressor genes, such as TP53 and LIF, in elephants and other taxa18,19,20,21,22. These changes have been proposed to contribute to an enhanced apoptotic response to genotoxic stress leading to more robust elimination of damaged cells. However, enhanced apoptosis is unlikely to slow down ageing. One potential mechanism that could explain both cancer resistance and slower ageing in long-lived mammals is enhanced DNA repair and genome stability. Across species, several studies have also pointed towards improved DNA repair capacity and reduced mutation accumulation as characteristics associated with species longevity23,24,25,26,27.
Here we present evidence of cellular and molecular traits that may underlie cancer resistance and longevity in the bowhead whale. We show that bowhead whale cells are not more prone to apoptosis and do not require additional genetic hits for malignant transformation relative to human cells. Instead, the bowhead whale relies on improvements in DNA repair and the maintenance of genome stability. This more ‘conservative’ strategy that does not needlessly eliminate cells but repairs them may be beneficial for the long and cancer-free lifespan of the bowhead whale.
Bowhead whale displays attenuated SASP
Most human somatic cells lack telomerase activity and as a result undergo replicative senescence with serial passaging in culture28. Replicative and stress-induced senescence are important mechanisms for preventing cancer. We found that bowhead whale skin fibroblasts, similar to human fibroblasts, undergo replicative senescence upon serial passaging in culture (Fig. 1a), lack telomerase activity (Fig. 1b) and experience telomere shortening with serial passaging (Fig. 1c). Consistently, we did not detect telomerase activity in most bowhead whale tissues, except for a low level observed in skin (Extended Data Fig. 1a). In both whale and human, nearly all cells stained positive for senescence-associated β-galactosidase upon terminal growth arrest (Fig. 1d,e). As in human fibroblasts, stable overexpression of human telomerase reverse transcriptase (TERT) to maintain telomere length prevented replicative senescence in bowhead whale cells (Fig. 1a and Extended Data Fig. 1b). Upon exposure to 10 or 20 Gy of γ-irradiation, bowhead whale skin fibroblasts readily entered stress-induced senescence, but did not significantly induce cell death (Fig. 1d–f).

a, Growth curves of primary and hTERT-immortalized skin fibroblasts (n = 3, biological replicates for each cell line). b, Telomerase activity measured by TRAP assay in skin fibroblasts from mouse, naked mole rat (NMR), human and three different bowhead whales (whale 1–3). HeLa cells are shown as a positive control. c, Telomere length in skin fibroblasts from human and bowhead whale (Whale) at indicated population doublings (PD) measured by telomere restriction fragment (TRF) assay. For gel source data, see Supplementary Fig. 1. d, Percentage of SA-β-gal-positive human and bowhead whale skin fibroblasts following γ-irradiation (12 days) (n = 3, biological replicates for each species) or during replicative senescence (RS) (n = 2). P values were calculated using Welch’s two-sided t-test. e, Representative images of SA-β-gal staining in human and bowhead whale skin fibroblasts after γ-irradiation or replicative senescence. Scale bars, 100 µm. f, Quantification of cell death of human and bowhead whale fibroblasts in response to γ-irradiation. Three days post-irradiation, cells were analysed by annexin V/propidium iodide (PI) apoptosis assay (n = 3, biological replicates for each species). g, SASP induction measured by mRNA expression in human and bowhead whale fibroblasts 12 days after γ-irradiation. h, p53 reporter activity in mouse, cow, human and bowhead whale fibroblasts transfected with a p53-responsive luciferase vector. Firefly/Renilla luciferase ratios (pp53-TA-luc/Renilla) are shown (n = 3 biological replicates for mouse, human and bowhead whale; n = 2 for cow). i, Quantification of cell death of fibroblasts in response to UVC irradiation (n = 3 biological replicates for mouse, human and bowhead whale; n = 2 for cow). Two days after treatment, cells were analysed by annexin V/PI assay. P values were calculated using Welch’s two-sided t-test. Data are presented as mean ± s.d.
Notably, transcriptome analysis of human and bowhead whale senescent fibroblasts showed reduced induction of senescence-associated secretory phenotype (SASP) factors in bowhead whale fibroblasts (Fig. 1g) relative to human cells. These transcriptomic differences may indicate that senescent cells in the bowhead whale are less inflammatory which may be beneficial for longevity.
Cancer resistance in elephants has been linked to increased p53 activity and heightened apoptosis18,19,20. By contrast, bowhead whale fibroblasts displayed lower basal p53 activity (Fig. 1h) and no increase in apoptosis compared with human cells following genotoxic stress (Fig. 1i and Extended Data Fig. 1c). These findings suggest that enhanced p53 signalling is unlikely to be a major contributor to bowhead whale cancer resistance.
Oncogenic transformation of whale cells
We investigated the minimal combination of genetic hits that was required for malignant transformation of bowhead whale fibroblasts. In soft agar assays, human primary fibroblasts that expressed human TERT (hTERT) required HRAS(G12V), SV40 large T (LT) and SV40 small T (ST) for anchorage-independent growth, consistent with published findings17 (Fig. 2a). By contrast, bowhead whale fibroblasts that express hTERT were transformed by only HRAS(G12V) and SV40 LT, suggesting that fewer hits are sufficient (Fig. 2a and Extended Data Fig. 1d,e). Mouse xenograft assays supported these observations, with tumour growth requiring the same number of hits as in soft agar (Fig. 2b).

a, Bottom, representativeimages of fibroblast colonies from the indicated cell lines after four weeks of growth in soft agar. Top, table indicating whether each gene is overexpressed (+), inactivated (−) or expressed in its wild-type (WT) endogenous form. Text above individual images denotes whether tumour suppressors are inactivated via genetic knockout or expression of SV40 large T antigen (LT or LT mutants) or small T antigen (ST). Icons in image corners indicate species. Scale bars, 250 µm. Human icon: https://freesvg.org/1548372886, licensed under CC0 1.0 Public Domain Dedication. Bowhead whale image: https://share.google/images/zqVyjpmCDK8N2Dm2j, licensed under CC BY-SA 3.0. No changes were made. b, Volumetric tumour growth curves of the indicated bowhead whale fibroblast cell lines in mouse xenograft assays. All lines shown stably express HRAS(G12V) and hTERT, in addition to the genotypes indicated. Each data point represents the average from six injections per cell line, except for TP53−/−RB1−/− double knockouts, for which two independent cell lines were tested (12 injections total). Experiments were terminated upon reaching thresholds for maximum tumour size or experimental duration, as described in Methods. Representative images of mice at the final measured time point are shown below. Error bars indicate s.e.m.
To test this genetically, we generated CRISPR knockouts of TP53, RB1 and PTEN in bowhead whale hTERT+ fibroblasts. Knockout was confirmed by immunoblot (Extended Data Fig. 1f–j), luciferase reporters (Extended Data Fig. 1k,l) and sequencing (Supplementary Figs. 2 and 3). Inactivation of TP53 and RB1, combined with HRAS(G12V) expression, was sufficient for malignant transformation (Fig. 2a,b). These findings suggest that despite its larger size and longer lifespan, the cells of the bowhead whale require fewer mutational hits for malignant transformation than human cells. We note, however, that these experiments were performed in fibroblasts, whereas most human cancers originate in epithelial cells; additional work will be needed to determine whether the same requirements apply across different cell types.
Lower mutation rates in whale cells
As bowhead whale cells displayed lower p53 activity and required fewer mutational hits for transformation, we hypothesized that cancer resistance might be associated with lower mutation rates. Whole-genome sequencing of bowhead whale, human and mouse fibroblast-derived tumour xenografts and parental non-transformed cells revealed similar relative proportions of single nucleotide variants (SNVs) across species (Extended Data Fig. 2a,b). However, the frequency of de novo somatic SNVs was significantly lower in bowhead whale tumours compared with human and mouse (Extended Data Fig. 2c). Bowhead whale tumours also showed reduced numbers of small insertion–deletion mutations (indels) and large structural variants (SVs), including deletions, insertions, duplications and inversions (Extended Data Fig. 2d–h), with a marked reduction in SVs more than 500 kb in size (Extended Data Fig. 2i,j).
After treatment with N-ethyl-N-nitrosourea (ENU) using single-molecule mutation sequencing (SMM-seq)29 bowhead whale cells showed the smallest increase in SNVs, whereas mouse cells showed the largest increase (Extended Data Fig. 3a,b and Supplementary Fig. 4). HPRT mutagenesis assays further confirmed lower mutation rates in whale fibroblasts compared with human fibroblasts after treatments with ENU, 1-methyl-3-nitro-1-nitrosoguanidine (MNNG), ethyl methanesulfonate (EMS) or γ-irradiation (Extended Data Fig. 3c–f). Collectively, these results demonstrate that bowhead whale cells display lower spontaneous and induced mutation rates and are especially resistant to accumulation of SVs.
Enhanced DSB repair in bowhead whale
To understand the underlying mechanisms of reduced mutation rates in the bowhead whale, we assessed the efficiency of DNA repair pathways. Nucleotide excision repair activity was comparable between whale and human fibroblasts (Extended Data Fig. 4a,b), and base excision repair showed a trend towards higher activity in whale cells, but the difference was not statistically significant (Extended Data Fig. 4c).
By contrast, PARP activity was markedly higher in whale fibroblasts after H2O2 or γ-irradiation, as well as under basal conditions (Extended Data Fig. 4d–f). Whale cells also displayed higher survival after H2O2 treatment and slightly faster repair, as measured by alkali comet assay (Extended Data Fig. 4g,h). Mismatch repair was significantly more efficient in whale cells than in mouse, cow (Bos taurus) and human fibroblasts (Extended Data Fig. 4i).
Finally, we assessed DNA double-strand break (DSB) repair, a repair pathway showing strong correlation with species’ longevity26,30. Whale fibroblasts exhibited significantly higher frequencies of both non-homologous end joining (NHEJ) and homologous recombination (HR) than other species (Fig. 3a,b and Extended Data Fig. 5a,b). Lower endogenous γH2AX and 53BP1 foci suggested a reduced baseline burden of DSBs (Fig. 3c and Extended Data Fig. 5c). After bleomycin treatment, whale fibroblasts resolved DSB foci more rapidly than human cells and were more resistant to bleomycin and etoposide in clonogenic assays (Fig. 3c–e). Consistently, micronuclei formation was reduced after γ-irradiation (Fig. 3f and Extended Data Fig. 5d). Collectively, these results suggest that bowhead whale fibroblasts have enhanced mismatch and DSB repair, which may help protect the whale against mutations, structural variation and chromosomal instability.

a,b, NHEJ and HR frequencies measured using fluorescent reporter constructs (n = 3 biological replicates per species). Data are presented as mean ± s.d. P values were calculated using Welch’s two-sided t-test. Experiments were independently repeated three times with similar results. c, γH2AX–53BP1 foci with or without bleomycin (5 µg ml−1, 1 h). Each dot represents one nucleus; at least 150 nuclei analysed per species. Data from biological replicates (n = 3 per species) were combined. Data are presented as mean ± s.d. P values were calculated using unpaired t-test. d,e, Clonogenic survival of fibroblasts after bleomycin (1 h) or etoposide (3 h). Colonies were fixed and stained two weeks (human) or three weeks (whale) after plating (n = 3 biological replicates per species). Data are presented as mean ± s.e.m. P values were calculated using Welch’s two-sided t-test. f, Micronuclei in binucleated cells 48 h after 2 Gy γ-irradiation (n = 4 biological replicates per species). Data are presented as mean ± s.d. P values were calculated using Welch’s two-sided t-test. g, Histograms of CRISPR-induced indel size distributions by species. Data from biological replicates are overlaid; lines connect samples. h, Distribution of PTEN allele variants after CRISPR-induced DSBs at a conserved PTEN locus (n = 3 biological replicates for bowhead whale, human and mouse; n = 2 for cow). i, Allele plots showing the 15 most frequent allele types in one representative cell line per species within a 40-bp window around the cleavage site. Bars indicate proportions of total alleles. Rows represent pooled alleles with identical sequences in the window.
More accurate NHEJ in bowhead whale
As NHEJ is a mutagenic pathway, we assessed the fidelity of NHEJ repair in the bowhead whale cells. Sequencing and analysis of repair junctions from integrated and extrachromosomal NHEJ reporters revealed that compared with human, the bowhead whale produced fewer deletions (Extended Data Fig. 6a–c).
We also measured the fidelity of NHEJ at an endogenous genomic locus. To compare mutational outcomes of CRISPR break repair across species, we introduced breaks in exon 1 of the conserved PTEN gene in bowhead whale, human, cow and mouse fibroblasts and performed deep sequencing. Species-specific outcomes were consistent across cell lines derived from multiple individual animals of each species (Fig. 3g–i and Supplementary Fig. 5). In human, cow and mouse, deletions predominated, whereas bowhead whale cells showed the highest fraction of unmodified alleles, consistent with accurate repair (Fig. 3h). Sequencing of untreated controls confirmed that observed indels were CRISPR-induced. CRISPR efficiency was comparable across species (Extended Data Fig. 6d and Supplementary Fig. 6a,b), supporting that the higher unmodified allele fraction in whales reflected greater repair fidelity. Furthermore, bowhead whale fibroblasts had the lowest frequency of large deletions, without altered microhomology usage (Extended Data Fig. 6e,f). These results suggest that NHEJ in the bowhead whale has higher fidelity than in humans and other mammals.
CIRBP contributes to efficient DSB repair
To identify mechanisms that contribute to efficient and accurate DSB repair in the bowhead whale, we compared expression of DNA repair proteins across mammals by immunoblot, quantitative mass spectrometry and transcriptome sequencing. Surprisingly, Ku70, Ku80 and DNA-PKcs were more abundant in human than in other species, including the bowhead whale, suggesting a human-specific adaptation (Fig. 4a and Extended Data Fig. 7a).

a, Western blot analysis of DNA repair proteins in primary fibroblasts from different species. For gel source data, see Supplementary Fig. 1. b,c, NHEJ and HR frequencies measured using GFP reporter constructs in human fibroblasts overexpressing bwCIRBP or CIRBP(9R/A) (n = 3 independent experiments). Data are presented as mean ± s.d. P values were calculated using Welch’s two-sided t-test. Experiments were independently repeated three times with similar results. d, Western blot of human fibroblasts overexpressing wild-type or 9R/A mutant bwCIRBP (left) and of bowhead whale fibroblasts transfected with siRNA targeting CIRBP (siCIRBP) or non-targeting siRNA (siNT) (right). For gel source data, see Supplementary Fig. 1. e,f, Knockdown of CIRBP in bowhead whale fibroblasts decreases NHEJ and HR frequencies (n = 3 independent experiments). Data are presented as mean ± s.d. P values were calculated using Welch’s two-sided t-test. g, γH2AX–53BP1 foci after bleomycin (5 µg ml−1, 1 h). Each dot represents one nucleus; at least 50 nuclei analysed. Data from n = 2 human fibroblast lines overexpressing bwCIRBP were combined. Data are presented as mean ± s.d. P values were calculated using unpaired t-test. h, Overexpression of CIRBP reduces the percentage of binucleated cells with micronuclei in human fibroblasts 3 days after 2 Gy γ-irradiation (n = 3 biological replicates). Data are presented as mean ± s.d. P values were calculated using Welch’s two-sided t-test. i, In vitro NHEJ ligation assay using BamHI-linearized pUC19 with XRCC4–ligase IV with or without Ku70–Ku80 and increasing CIRBP. PAXX served as negative control and XLF served as positive control. Products were resolved on agarose gels. j, Exonuclease protection assay with BamHI-linearized plasmid DNA incubated with CIRBP followed by T7 exonuclease digestion. Reactions were resolved on agarose gels.
By contrast, CIRBP was markedly abundant in bowhead fibroblasts and tissues (Fig. 4a and Extended Data Fig. 7a–e), but largely undetectable in other mammals except humpback whale, with moderate levels in dolphins (Extended Data Fig. 7f). CIRBP is a stress-responsive RNA- and poly(ADP-ribose) (PAR)-binding protein implicated in DNA damage responses31,32,33,34. Levels of PARP1, a CIRBP partner, were also higher in bowhead whale cells (Fig. 4a and Extended Data Fig. 7a), and transcriptome analysis revealed upregulation of multiple DSB repair genes, including CtIP (also known as RBBP8) (Extended Data Fig. 8).
Human and bowhead CIRBP proteins differ by five C-terminal amino acid residues (Extended Data Fig. 9a–c). Substitution of these five residues in human CIRBP (hCIRBP) with bowhead whale residues increased protein abundance, whereas substitution of bowhead whale CIRBP (bwCIRBP) with the 5 hCIRBP residues decreased it (Extended Data Fig. 9d,e). Although CIRBP abundance increased following introduction of the five bowhead substitutions, it did not achieve the expression levels of bwCIRBP, suggesting that synonymous changes to the mRNA coding sequence contribute to higher translation efficiency of bwCIRBP. Consistently, bwCIRBP has a higher codon adaptation index (CAI)35 than hCIRBP (Extended Data Fig. 9e). These results suggest that baleen whales evolved to express very high levels of CIRBP.
To examine the role of high CIRBP levels in NHEJ and HR repair pathways, we overexpressed bwCIRBP in human cells with integrated reporters. Overexpression increased the frequency of successful NHEJ and HR repair events and reduced indel rates (Fig. 4b–d, Extended Data Fig. 10a–c and Supplementary Table 1). Conversely, CIRBP depletion in bowhead whale cells by small interfering RNA (siRNA) significantly reduced NHEJ and HR efficiency and increased deletions (Fig. 4d–f and Extended Data Fig. 10d). Furthermore, human fibroblasts with integrated NHEJ reporters displayed enhanced NHEJ when cultured at 33 °C rather than 37 °C, accompanied by an increase in CIRBP protein abundance (Extended Data Fig. 10e). Consistent with published observations, overexpression of bwCIRBP with nine arginines in the repeated RGG motif mutated to alanines (bwCIRBP(9R/A)), which impairs the ability of CIRBP to bind to PAR polymers33, did not stimulate HR and reduced stimulation of NHEJ (Fig. 4b–d).
Overexpression of bwCIRBP accelerated γH2AX–53BP1 foci resolution after bleomycin (Fig. 4g) and increased resistance to bleomycin and etoposide (Extended Data Fig. 11f,g). CIRBP overexpression also reduced basal and induced micronuclei (Fig. 4h and Extended Data Fig. 10h) and irradiation-induced chromosomal aberrations (Extended Data Fig. 10i). Collectively, these results suggest that high CIRBP abundance enhances NHEJ and HR efficiency, reduces mutagenic indels and promotes chromosomal stability in the bowhead whale.
Mechanisms of CIRBP genome protection
CIRBP has been reported to localize to DSBs and facilitate ATM signalling33. In bowhead whale cells, CIRBP was primarily nuclear, present in soluble and chromatin-associated fractions (Extended Data Fig. 11a). This chromatin association was largely RNA-dependent (Extended Data Fig. 11a) and increased transiently after DNA damage (Extended Data Fig. 11b). Damage-induced enrichment was sensitive to RNase A, suggesting that local RNA binding contributes to CIRBP recruitment (Extended Data Fig. 11c). Similar to other RNA-binding proteins36, CIRBP may be targeted to DSBs via PAR and RNA.
In vitro analyses using recombinant bwCIRBP and hCIRBP (Extended Data Fig. 11d) showed comparable PAR-binding affinities (Extended Data Fig. 11e), although the higher CIRBP abundance in whales is likely to increase total PAR-binding capacity.
Recombinant CIRBP produced concentration-dependent shifts of RNA and DNA substrates in electrophoretic mobility assays (Extended Data Fig. 11f,g), suggesting an ability to bind nucleic acids, consistent with previous reports. At high CIRBP concentrations, nearly all RNA and DNA fragments were retained in the well, suggesting an ability of CIRBP to tether or aggregate nucleic acid.
Human CIRBP also enhanced end joining of a linearized plasmid by the XRCC4–ligase IV complex (Fig. 4i) and promoted binding of Ku70–Ku80 to DNA (Extended Data Fig. 11h). In addition, human CIRBP protected DNA ends from degradation by T7 exonuclease in linearized plasmid and Y-structured substrates (Fig. 4j and Extended Data Fig. 11i).
Together, these results suggest that CIRBP is recruited to DNA DSBs, where it facilitates binding of DNA repair proteins and protects DNA ends from resection. Although there was no difference in PAR binding between the human and whale proteins, higher abundance of the whale CIRBP is likely to provide better protection against DSBs. Additional studies will be required to determine the precise mechanisms by which CIRBP promotes NHEJ and HR.
CIRBP reduces malignant transformation
We next tested whether high CIRBP levels affect malignant transformation. Overexpression of bwCIRBP in human fibroblasts containing SV40 LT, SV40 ST, HRAS(G12V) and hTERT delayed colony formation in soft agar compared with controls (Extended Data Fig. 12a,b). CIRBP expression did not alter proliferation or viability in 2D culture (Extended Data Fig. 12c,d) and had no effect on SV40 LT, HRAS(G12V) or the cell cycle regulators p16INK4a and p21 (Extended Data Fig. 12e), indicating that growth delay was not due to cell death or cell cycle arrest. Of note, CIRBP-overexpressing transformed cells showed fewer chromosomal aberrations (Extended Data Fig. 12f). In mouse xenografts, CIRBP overexpression delayed tumour growth relative to luciferase controls (Extended Data Fig. 12g) and showed a trend towards reduced large deletions (Extended Data Fig. 12h). Together, these results suggest that increased abundance of CIRBP attenuates malignant transformation, possibly by reducing genomic instability. We note that these findings are limited to fibroblast models rather than epithelial cells, where most human cancers arise.
CIRBP promotes resilience in Drosophila
To evaluate whether the genome-protective effects of CIRBP extend to an in vivo model, we overexpressed human and bowhead whale CIRBP in Drosophila using a conditional Gal4-Geneswitch system37 (Extended Data Fig. 13a). RU486 addition did not affect survival (Extended Data Fig. 13b). Remarkably, overexpression of both human and whale CIRBP resulted in consistent lifespan extension compared with controls (Fig. 5a and Extended Data Fig. 13c,d). CIRBP overexpression strongly improved survival after ionizing radiation (Fig. 5b and Extended Data Fig. 13e,f), indicating increased resistance to DNA damage in vivo. These results support a role for CIRBP in promoting genome stability and organismal longevity.
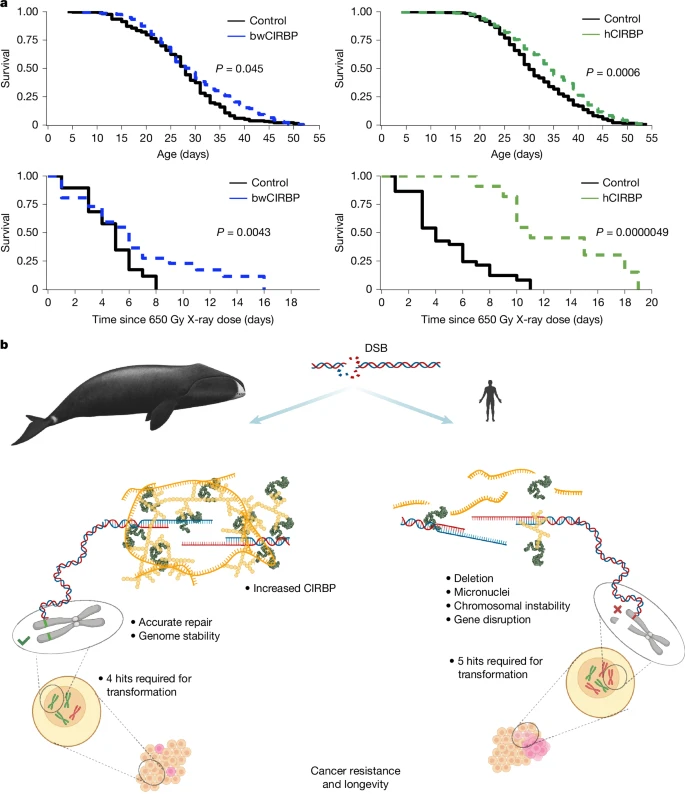
a, Conditional (daughterless-GeneSwitch, medium dose) CIRBP overexpression extends adult lifespan. lnHR (natural logarithm of the hazard ratio) indicates the effect size estimated by Cox models. Human CIRBP: lnHR = –0.31 ± 0.09, P = 0.0006 (two-sided, mixed-effects Cox proportional hazards model (coxme)); bowhead whale CIRBP: lnHR = –0.29 ± 0.14, P = 0.045 (two-sided, coxme). CIRBP also extends survival after lethal X-ray irradiation. Human CIRBP: lnHR = –2.0 ± 0.44, P = 0.0000049 (two-sided, standard Cox model (coxph)); bowhead whale CIRBP: lnHR = –0.69 ± 0.34, P = 0.043 (two-sided, coxph). Statistical significance was determined using mixed-effects Cox proportional hazards models for lifespan and standard Cox models for post-irradiation survival. All tests were two-sided; no adjustments for multiple comparisons were applied. For complete dose–response data, see Extended Data Fig. 13. b, Genome maintenance strategies in bowhead whale and human. The bowhead whale has evolved efficient and accurate DSB repair, mediated in part by high CIRBP expression. This enhanced repair capacity may contribute to cancer resistance, despite bowhead whale cells requiring fewer mutational hits for oncogenic transformation than human cells. Instead of relying primarily on elimination of damaged cells through apoptosis or senescence, improved DNA repair may underlie the bowhead whale’s exceptional longevity and resistance to cancer. Bowhead whale image: https://share.google/images/zqVyjpmCDK8N2Dm2j, licensed under CC BY-SA 3.0. No changes were made. The graphical summary was created with BioRender. Zacher, M. (2025), https://BioRender.com/gyk1r04.
Discussion
By studying a mammal that is capable of maintaining its health and avoiding death from cancer for more than two centuries, we are offered a unique glimpse behind the curtain of a global evolutionary experiment that tested more mechanisms affecting cancer and ageing than humans could hope to approach. Through experiments using primary fibroblasts and tissues from the bowhead whale, we experimentally determined genetic requirements for oncogenic transformation in the longest living mammal and provide evidence that additional tumour suppressors are not the only solutions to Peto’s paradox. Instead, our data suggest that bowhead whales may rely on enhanced maintenance of genome integrity. We also identify CIRBP, a cold-inducible RNA-binding protein that is highly expressed in bowhead whale cells and tissues, as a contributor to this process, supporting DSB repair and reducing chromosomal abnormalities (Fig. 5b).
The exact mechanism by which CIRBP promotes DSB repair and protects DNA ends from degradation remains to be determined. CIRBP has been shown to undergo liquid–liquid phase separation (LLPS) in vitro38. We hypothesize that CIRBP may concentrate repair factors and stabilize the DNA ends through LLPS. Although overexpression of DNA repair enzymes may be detrimental, the potential role of CIRBP in forming a protective condensate around a DSB, is consistent with more abundant CIRBP providing greater benefit.
There are currently no approved therapies that aim to bolster DNA repair for the prevention of cancer or age-related decline39, and it has been suggested that DNA repair would be difficult or even impossible to improve40. However, the bowhead whale provides evidence that this notion is incorrect. Expression of bwCIRBP in human cells promotes genome stability. Therapies based on the evolutionary strategy of the bowhead whale, increasing activity or abundance of proteins such as CIRBP, could one day enable the treatment of genome instability as a modifiable disease risk factor. This could be especially important for patients with increased genetic predisposition for cancer, or more generally, for ageing populations at increased risk for developing cancer (further discussion is provided in the Supplementary Discussion).
Methods
Reagents
Detailed information on reagents, such as antibodies and sequences of primers, probes, CRISPR guides, and siRNAs, is provided in Supplementary Table 2.
Animal experiments
All animal experiments were approved and performed under pre-approved protocols and in accordance with guidelines set by the University of Rochester Committee on Animal Resources (UCAR).
Whale sample collection
Bowhead whale tissues were obtained from adult bowhead whales (B. mysticetus) captured during 2014 and 2018 Iñupiaq subsistence harvests in Barrow (Utqiaġvik), Alaska, in collaboration with the North Slope Borough Department of Wildlife Management and Alaska Eskimo Whaling Commission after signing a Memorandum of Understanding (September 2014 and March 2021). Tissues were sampled immediately after bowhead whales were brought ashore, after permission to sample was given by the whaling captain, and explants kept in culture medium on ice or at 4 °C through initial processing and shipping until arrival at the University of Rochester for primary fibroblast isolation from skin and lung. Transfer of bowhead whale samples from North Slope Borough Department of Wildlife Management to University of Rochester was under National Oceanic and Atmospheric Administration (NOAA)/National Marine Fisheries Service permit 21386.
Cells and tissues used in the study
Multiple individuals of each species were used in each experiment. For details see Supplementary Table 2.
Establishing primary cell cultures
Primary skin fibroblasts were isolated from skin (dermal) tissues as previously described41. In brief, skin tissues were shaved and cleaned with 70% ethanol. Tissues were minced with a scalpel and incubated in DMEM/F-12 medium (ThermoFisher) with Liberase (Sigma) at 37 °C on a stirrer for 15–90 min. Tissues were then washed and plated in DMEM/F-12 medium containing 12% fetal bovine serum (GIBCO) and Antibiotic-Antimycotic (GIBCO). All subsequent maintenance culture for fibroblasts from bowhead and other species was in EMEM (ATCC) supplemented with 12% fetal bovine serum (GIBCO), 100 units ml−1 penicillin, and 100 mg ml−1 streptomycin (GIBCO). All primary cells were cultured at 37 °C with 5% CO2 and 3% O2 except bowhead whale cells, which were cultured at 33 °C with 5% CO2 and 3% O2 based on published field measurements of bowhead body temperature, which measured a core temperature of 33.8 °C and a range of lower temperatures in muscle and peripheral tissue42,43. Prior to beginning experiments with bowhead whale fibroblasts, optimal growth and viability conditions were empirically determined through testing of alternative temperatures, serum concentrations, and cell culture additives, with optimal culture medium found to be the same for bowhead and other species. Following isolation, low population doubling primary cultures were preserved in liquid nitrogen, and population doubling was continually tracked and recorded during subsequent use for experiments.
Established primary fibroblasts from mammals were obtained from San Diego Zoo Wildlife Alliance (hippopotamus, common dolphin and humpback whale) or generated at Huntsman Cancer Institute from bottlenose dolphin tissues collected by Georgia Aquarium through T. Harrison under Institutional Animal Care and Use Committee (IACUC) oversight and California sea lion tissues collected by L. Palmer at the Marine Mammal Care Center Los Angeles (MMCCLA) under a stranding agreement from NOAA Fisheries West Coast Region (WCR). Two male adult and one female wild adult California sea lion were rescued by MMCCLA. The ill animals either died during care or were humanely euthanized under NOAA Fisheries WCR Marine Mammal Euthanasia Best Practices. Necropsy tissues were transferred to Huntsman Cancer Institute under NOAA National Marine Fisheries Service letters of authorization.
Soft agar assay
Fibroblast culture medium as described above was prepared at 2× concentration using 2× EMEM (Lonza). To prepare the bottom layer of agar plates, 2× medium was mixed with a sterile autoclaved solution of 1.2% Noble Agar (Difco) at a 1:1 volumetric ratio, and 3 ml of 1× medium/0.6% agar was pipetted into each 6-cm cell culture dish and allowed to solidify at room temperature in a tissue culture hood. To plate cells into the upper layer of soft agar, cells were collected and washed, and immediately prior to plating were resuspended in 2× medium at 20,000 cells per 1.5 ml and diluted twofold in 0.8% Noble Agar pre-equilibrated to 37 °C. The cells in 0.4% agar/1× medium were pipetted gently to ensure a homogeneous single cell suspension, and 3 ml (20,000 cells) per 6 cm dish were layered on top of the solidified lower layer. After solidifying in tissue culture hoods for 20–30 min, additional medium was added to ensure the agar layers were submerged, and dishes were moved into cell culture incubators. Fresh medium was added onto the agar every 3 days. 4 weeks after plating, viable colonies were stained overnight with nitro blue tetrazolium chloride (Thermo Fisher) as previously described44. All cell lines were plated in triplicate. For details see Supplementary Table 2.
Images of colonies in soft agar were captured using the ChemiDoc MP Imaging System (Bio-Rad). Colony quantification was performed using ImageJ software (NIH). Initially, images were converted to 8-bit format. Subsequently, the threshold function was adjusted to eliminate any red pixels highlighting non-colony objects. Following threshold adjustment, images were converted to binary. Colony counting was executed using the ‘Analyze particles’ function with the following parameters: Size (pixel^2) = 1 to infinity; Circularity = 0.5 to 1.
Mouse xenograft assay
NIH-III nude mice (Crl:NIH-Lystbg-J Foxn1nuBtkxid) were purchased from Charles River Laboratories. Seven-week-old female mice were used to establish xenografts and were kept under specific pathogen-free conditions at the vivarium of University of Rochester. Mice were housed in 12 h light:12 h dark cycle, at temperatures 18–23 C, with 40–60% humidity. For each injection, 2 × 10⁶ cells were collected and resuspended in 100 μl of ice-cold 20% matrigel (BD Bioscience) in PBS (Gibco). Mice were anaesthetized with isoflurane gas, and 100 μl solution per injection was injected subcutaneously into the right and left flanks of each mouse with a 22-gauge needle. Three mice were injected bilaterally, for a total of six injections, per cell line tested. Tumour length and width were measured and recorded every 3–4 days. Mice were euthanized after reaching a predetermined humane tumour burden endpoint of a maximum tumour dimension of 20 mm in diameter, determined by the longest dimension of the mouse’s largest tumour. For mice that did not reach tumour burden endpoints, experiments were terminated, and mice euthanized after a maximum of 60 days. Euthanized mice were photographed, and tumours were excised, photographed, and weighed to determine the mass of each tumour. Sections of each tumour were frozen at −80 °C and preserved in formalin. All animal experiments were approved by the University of Rochester Committee for Animal Research, Protocol number 2017-033.
MTT assay
Cell metabolic activity was determined using Thiazolyl Blue Tetrazolium Bromide (MTT) (Sigma). Cells were seeded in 24-well plates at a density of 20,000 cells per well one day before the assay. An MTT solution in PBS was added to the growth medium to achieve a final concentration of 0.5 mg ml−1, and cells were then incubated for 4 h in a CO2 incubator. Following incubation, the growth medium was discarded, and 0.5 ml of DMSO was added to each well to solubilize the purple formazan crystals completely. The plate was further incubated until the crystals were fully dissolved. For details see Supplementary Table 2. Spectrophotometric absorbance of the samples was measured at a wavelength of 570 nm using a Tecan Spark 20 M plate reader.
Telomere lengths
Telomere length was analysed by Southern blot using the TRF method. Genomic DNA was extracted from cultured fibroblasts at different population doublings, digested with a mixture of AluI, HaeIII, RsaI, and HinfI restriction enzymes that do not cut within telomeric repeat sequences, separated using pulsed-field gel electrophoresis, and hybridized with a radiolabelled oligonucleotide containing telomeric sequence (TTAGGG)4. Pulsed-field gels were run using a CHEF-DR II apparatus (Bio-Rad) for 22 h at a constant 45 V, using ramped pulse times from 1 to 10 s.
Telomeric repeat amplification protocol
Telomeric repeat amplification protocol assay was performed using the TRAPeze kit (Chemicon) according to manufacturer instructions. In brief, in the first step of the TRAP assay, radiolabelled substrate oligonucleotide is added to 0.5 μg of protein extract. If telomerase is present and active, telomeric repeats (GGTTAG) are added to the 3′ end of the oligonucleotide. In the second step, extended products are amplified by PCR. Telomerase extends the oligonucleotide by multiples of 6 bp, generating a ladder of products of increasing length. A human cancer cell line overexpressing telomerase as well as rodent cells were used as a positive control.
CRISPR ribonucleoprotein transfection
CRISPR RNP complexes were formed in vitro by incubating Alt-R S.p.Cas9 Nuclease V3 (Integrated DNA Technologies) with tracRNA annealed to target-specific CRISPR RNA (crRNA) (Integrated DNA Technologies) according to manufacturer instructions. For generation of tumour suppressor knockouts, 3 RNP complexes with crRNAs targeting different sites in a single target gene were combined and Alt-R Cas9 Electroporation Enhancer (Integrated DNA Technologies) was added to transfection mixes prior to electroporation. For comparative analysis of repair fidelity, 3 μg of pmaxGFP plasmid (Lonza) was added to transfection mixes to monitor transfection efficiency. Cells were trypsinized and washed with PBS, and 1 × 10⁶ cells were resuspended in 100 μl of NHDF Nucleofector Solution (Lonza). The cell suspension was then combined with the CRISPR transfection solution and gently mixed prior to electroporation on an Amaxa Nucleofector 2b (Lonza) using program U-23. For details see Supplementary Table 2.
Isolation of clonal cell colonies and screening for tumour suppressor knockout
Following CRISPR transfection, cells were plated at low density in 15 cm dishes to allow for the formation of isolated colonies. Once clonal colonies of sufficient size had formed, positions of well-isolated colonies were visually marked on the bottom of the cell culture dish while under a microscope using a marker. Dishes were aspirated and washed with PBS. Forceps were used to dip PYREX 8 × 8 mm glass cloning cylinders in adhesive Dow Corning high-vacuum silicone grease (Millipore Sigma) and one glass cylinder was secured to the dish over each marked colony. One-hundred and fifty microlitres of trypsin was added to each cylinder and returned to the incubator. When cells had rounded up from the plate, the trypsin in each cylinder was pipetted to detach cells and each colony was added to a separate well in a 6 cm culture dish containing culture medium. After colonies were expanded and split into two wells per colony, one well was collected for western blot screening for absence of target proteins, while the remaining well was kept for further experiments.
Luciferase reporter assays for knockout verification
For p53 activity measurement, 106 cells of control (wild-type) and clonally isolated p53-knockout cell lines were electroporated with 3 µg p53 firefly luciferase reporter plasmid pp53-TA-Luc (Clontech/Takara) and 0.3 μg Renilla luciferase control plasmid pRL-CMV (Promega) on an Amaxa Nucleofector 2b (Lonza). Twenty-four hours later, cells were treated with 200 μM etoposide (Sigma) to induce p53 activity. Twenty-four hours following etoposide treatment, cells were collected, and luciferase activity of cell lysates was measured using the Dual-Luciferase Reporter Assay System (Promega) in a GloMax 20/20 Luminometer (Promega) according to manufacturer instructions. For details see Supplementary Table 2.
For RB activity measurement, two different reporters were tested in parallel: pE2F-TA-Luc (Clontech/Takara) to measure E2F transcriptional activity (repressed by RB), and pRb-TA-Luc (Clontech/Takara) (promoter element directly suppressed by RB). One million cells of control (wild-type) and clonally isolated RB-knockout cell lines were electroporated with 3 µg of either pE2F-TA-luc or pRb-TA-luc and 0.3 ug Renilla luciferase plasmid on an Amaxa Nucleofector 2b (Lonza). Following transfection, cells were grown in complete medium for 24 h followed by serum-free medium for 24 h. Cells were then collected, and luciferase activity measured as described above. For details see Supplementary Table 2.
Error-corrected sequencing by SMM-seq of ENU-mutated cells
Skin fibroblasts from mouse, cow, human and whale were isolated and cultured as described before. Confluent cells were treated with 20 mg ml−1 ENU overnight. Then cells were split 1:4 and grown until confluence for collection.
Genomic DNA (gDNA) was isolated from frozen cell pellets using the Quick DNA/RNA Microprep Plus Kit (Zymo D7005). Three hundred nanograms were used for library preparation as described45: in brief, DNA was enzymatically fragmented, treated for end repair before adapter ligation and exonuclease treatment. A size selection step was performed using a 1.5% cassette on a PippinHT machine prior pulse rolling circle amplification (RCA) and indexing PCR. Library quality was determined with a Tape Station (Agilent) and quantified with Qubit (Thermo Fisher). All libraries were sequenced by Novogene on an Illumina platform.
Sequencing analysis and mutation calling were performed as described45, using the following tools: Python v.2.7.18, TrimGalore v.0.4.1, BWA v.0.7.13, Samtools v.1.9, Picard v.1.119, GenomeAnalysisTK v.3.5, Bcftools v.1.9, and tabix v.0.2.6. Mutations were called using SMM (https://github.com/msd-ru/SMM). Downstream analyses were conducted in R v.4.3.3 with MutationalPatterns v.3.12.0. Germline variants were distinguished from somatic mutations by additional filtering steps after alignment to the reference genome.
Graphs were generated and statistical testing was performed using GraphPad Prism.
Next-generation sequencing of CRISPR repair products
Seventy-two hours after transfection, cells were collected, and genomic DNA was isolated with the Wizard Genomic DNA Purification Kit (Promega). DNA concentration was measured on a Nanodrop spectrophotometer and 100 ng of DNA per sample was PCR-amplified with KAPA2G Robust HotStart ReadyMix (Roche) based on findings of low PCR bias for KAPA polymerase46,47. Primers targeted a conserved region surrounding PTEN exon 1 (Extended Data Fig. 4a). PCR was performed according to manufacturer instructions, with an annealing temperature of 66 °C for 30 cycles. To purify samples for next-generation sequencing, PCR products were electrophoresed on a 0.8% agarose gel and post-stained with SYBR Gold Nucleic Acid Gel Stain (Thermo Fisher). Gels were visualized on a blue light tray (Bio-Rad) to minimize damage to DNA. A gel slice for each lane was excised using a scalpel, and each slice was cut to include the region ranging from just above the prominent PTEN PCR band down to and including the ‘primer dimer’ region to ensure inclusion of any deletion alleles. DNA was extracted from gel slices using the QiaQuick Gel Extraction Kit (Qiagen), and triplicate PCR reaction eluates per sample were pooled for sequencing. Sample concentrations were measured by Nanodrop and adjusted as necessary prior to submission for 2× 250 bp paired-end Illumina MiSeq sequencing with target depth of >40,000 reads per sample (Genewiz). For details see Supplementary Table 2.
Analysis of CRISPR NGS data
FASTQ files from each sequenced sample were analysed with both CRISPResso248, which uses an alignment-based algorithm, and CRISPRPic49, which uses a kmer-based algorithm. CRISPResso2 was run using the following parameters: window size = 30, maximum paired-end overlap = 500, bp excluded from left and right ends = 15, minimum alignment score = 50, minimum identity score = 50, plot window size = 20. For CRISPRPic analysis, SeqPrep50 was used to merge overlapping read pairs and trim adapter sequences. CRISPRPic was run on merged FASTQ sequences for each sample with the following parameters: index size = 8, window size = 30.
HPRT mutation assay
For the HPRT mutation assay, cells used were low-passage primary dermal fibroblasts from multiple species that were known to originate from male animals, to ensure single copy number of the X-linked HPRT gene. Each species was tested with three different cell lines from three individual animals. The bowhead HPRT coding sequence was BLASTed against bowhead genome scaffolds13 and neighbouring gene sequences were analysed to confirm mammal-typical localization of HPRT on the bowhead X-chromosome. Cells were cultured in standard fibroblast growth medium, but with FBS being replaced with dialysed FBS (Omega Scientific) and supplemented with Fibroblast Growth Kit Serum-Free (Lonza) to improve growth and viability in dialysed FBS. Dialysed FBS was found in optimization experiments to be necessary for efficient 6-thioguanine selection. Prior to mutagenesis, cells were cultured for 7 days in medium containing HAT Supplement (Gibco) followed by 4 days in HT Supplement (Gibco) to eliminate any pre-existing HPRT mutants. To induce mutations, cells were incubated for 3 h in serum-free MEM containing either 150 µg ml−1 ENU (Sigma), 10 µM MNNG (Selleck Chemicals), or 1,200 µg ml−1 EMS (Sigma), or were exposed to 2 Gy γ-irradiation. Cells were then maintained in ENU-free medium for 9 days to allow mutations to establish and existing HPRT to degrade. One million cells from each cell line were collected and plated in dialysed FBS medium containing 5 µg ml−1 6-thioguanine (Chem-Impex), in parallel with 106 untreated control cells for each cell line. Cells were plated at a density of 105 cells per 15-cm dish (2.5 × 10⁵ cells per 10-cm dish in MNNG and EMS experiments) to allow for efficient selection and colony separation, and to prevent potential ‘metabolic cooperation’51. In tandem, for each cell line 200 cells (50 cells in MNNG and EMS experiments) from untreated and control conditions were plated in triplicate 10-cm dishes in non-selective medium to calculate plating efficiency. After 3–4 weeks of growth, surviving colonies were fixed and stained with a crystal violet/glutaraldehyde solution as previously described52. Colonies were counted, and HPRT mutation rate was calculated as plating efficiency adjusted number of HPRT-negative colonies containing >50 cells. Appropriate concentrations of ENU, MNNG, EMS and 6-thioguanine, as well as optimal plating densities and growth conditions, were determined prior to the experiment described above through optimization and dose titration experiments. For details see Supplementary Table 2.
Digital droplet PCR measurement of CRISPR cleavage rate
A ddPCR assay similar to a previously published method53 was used for time-course quantification of CRISPR DSB induction across species. Quantitative PCR primers at conserved sites flanking the guide RNA target site in the PTEN gene were designed such that cleavage would prevent PCR amplification. As an internal copy number reference control, a second set of previously validated quantitative PCR primers targeting an ultraconserved element present in all mammals as a single copy per genome (UCE.359) was designed based on published sequences54. To allow for multiplexing and copy number normalization of PTEN within each ddPCR reaction, 5’ fluorescent hydrolysis probes (FAM for PTEN and HEX for UCE.359) targeting conserved sequences were designed, with 3‘ Iowa Black and internal ZEN quenchers (Integrated DNA Technologies). All primers and probes were checked for specificity by BLAST against each species’ genome54. Fibroblasts were transfected with PTEN CRISPR RNP as described in ‘Next-generation sequencing of CRISPR repair products’ and returned to cell culture incubators. At the indicated times post-transfection, cells were collected, flash frozen and genomic DNA was isolated with the Wizard Genomic DNA Purification Kit (Promega). During isolation, newly lysed cells were treated with Proteinase K and RNase A for 30 min each at 37 °C to minimize the possibility of residual CRISPR RNP activity. DNA concentration was measured on a Nanodrop spectrophotometer, and genomic DNA was predigested with BamHI-HF (NEB) and XhoI (NEB), which do not cut within target amplicons, to maximize PCR efficiency and distribution across droplets. 15 ng of genomic DNA per sample was added to duplicate PCR reactions using the ddPCR Supermix for Probes (No dUTP) master mix (Bio-Rad). Droplets were prepared and measured according to manufacturer instructions. In brief, each 20 µl reaction was mixed with 70 µl Droplet Generation Oil for Probes (Bio-Rad) and droplets were formed in a QX100 Droplet Generator (Bio-Rad). Forty microlitres of droplets per reaction were transferred to 96-well PCR plates and sealed with a PX1 PCR Plate Sealer (Bio-Rad). The sealed plates were then subjected to PCR using a pre-optimized cycling protocol. Following PCR, the plates were loaded into a QX100 Droplet Reader (Bio-Rad) and each droplet measured on both FAM and HEX channels. PTEN copy number normalized to UCE.359 reference copy number within each well was determined with QuantaSoft software (Bio-Rad). For each species, positive/negative gates in mock-transfected control samples were adjusted as necessary to compensate for differences in multiplex PCR efficiency/specificity and ‘rain’ droplets between species and bring normalized PTEN copy number closer to 1. The control gates were then applied across all samples/time points within the same species and used for PTEN copy number calculation. For details see Supplementary Table 2.
Flow cytometric measurement of CRISPR RNP transfection efficiency
CRISPR RNP transfections were performed as described above, but with ATTO-550 fluorescently labelled trans-activating CRISPR RNA (tracRNA) (Integrated DNA Technologies). At 0 h and 24 h post-transfection, cells were collected, pelleted and analysed by flow cytometry on a CytoFlex S Flow Cytometer (Beckman Coulter). Gain and ATTO-550 positive gates were set based on mock-transfected control cells included in each experiment. For details see Supplementary Table 2.
Senescence-associated β-galactosidase staining
Senescence-associated β-galactosidase (SA-β-gal) staining was performed as previously described55,56. Cells were washed twice with PBS and fixed in a solution containing 2% formaldehyde and 0.2% glutaraldehyde in PBS for 5 min at room temperature. After fixation, cells were immediately washed twice with PBS and stained in a solution containing 1 mg ml−1 X-Gal, 40 mM citric acid/sodium phosphate buffer, pH 6.0, 5 mM potassium ferrocyanide, 5 mM potassium ferricyanide, 150 mM NaCl, and 2 mM MgCl2. Plates were incubated at 37 °C for 16 h without CO2. Colorimetric images were taken from different areas of each plate and quantified. For details see Supplementary Table 2.
Cell survival assay
Percentage of live cells was quantified using the Annexin V FLUOS Staining Kit (Roche) and Annexin V Apoptosis Kit (FITC) (Novus Biologicals) following the manufacturer’s instructions. After staining, cells were analysed on a CytoFlex S flow cytometer (Beckman Coulter). Where indicated cell viability was assessed using a trypan blue exclusion assay. All cells (both floated and attached to the culture dish) were collected into the same tube, centrifuged, and resuspended in PBS. The cells were then mixed in a 1:1 ratio with 0.4% trypan blue solution, and approximately 3 min later, the percentage of dead cells was assessed using the Countess 3FL instrument (ThermoFisher) according to the manufacturer’s instructions. For details see Supplementary Table 2.
Clonogenic assay
The clonogenic assay was performed following a previously published protocol52. In brief, serial dilutions of drug-treated cells were plated immediately after treatment. The cells were incubated until colonies formed, which required two weeks for human cells and three weeks for bowhead whale cells. Colonies were then fixed and stained using a solution containing 6.0% glutaraldehyde and 0.5% crystal violet, followed by counting. Cell survival at each drug dose was expressed as the relative plating efficiency of the treated cells compared to the control cells. Data analyses were performed using GraphPad Prism software.
p53 activity
To test p53 activity in cultured primary fibroblasts, 150,000 cells were seeded in 6-well plates 1 day before transfection with 1 μg pp53-TA-Luc vector (Clontech) and 0.015 μg pRL-CMV-Renilla (Promega) to normalize for transfection efficiency. Transfections were performed using PEI MAX Transfection Grade Linear Polyethylenimine Hydrochloride (MW 40,000) (Polysciences) according to manufacturer instructions. 24 h after transfections cells were lysed using 50 µl passive lysis buffer (Promega) per 105 cells and flash frozen/thawed two times in liquid nitrogen and a 37 °C water bath. Luciferase assays were performed using the Dual-Luciferase Reporter Assay System (Promega) and program DLR-2-INJ on a Glomax 20/20 Luminometer (Promega) with 20 μl cell extract as the input. For details see Supplementary Table 2.
Generation of NHEJ and HR reporter cell lines
NHEJ and HR reporter constructs57 were digested with NheI restriction enzyme and purified with the QIAEX II gel extraction kit (QIAGEN). The same plasmid DNA preparation was used for generating all reporter cell lines of the studied species. Cells with PD < 15 were recovered from liquid nitrogen and passaged once before the integration of the constructs. 0.25 µg of linearized NHEJ and HR constructs were electroporated into one million cells for each cell line. Two days after transfection, media was refreshed, and G418 was applied to select stable integrant clones. Triplicates of each reporter in each cell line were prepared to obtain an adequate number of stable clones. Clones from triplicate plates were pooled to get at least 50 clones per reporter per cell line. For details see Supplementary Table 2.
DSB repair assays and flow cytometry analysis
DSB repair assays were performed as previously described58. In brief, growing cells were co-transfected with 3 µg of plasmid encoding I-SceI endonuclease and 0.03 µg of plasmid encoding DsRed. The same batch of I-SceI and DsRed mixture was used throughout all species to avoid batch-to-batch variation. To test the effect of CIRBP on DSB repair, 3 µg of CIRBP plasmids were co-transfected with I-SceI and DsRed plasmids. Three days after transfection, the numbers of GFP+ and DsRed+ cells were determined by flow cytometry on a CytoFlex S Flow Cytometer (Beckman Coulter). For each sample, a minimum of 50,000 cells was analysed. DSB repair frequency was calculated by dividing the number of GFP+ cells by the number of DsRed+ cells. For details see Supplementary Table 2 and Supplementary Fig. 7.
For NHEJ knockdown experiments, bowhead whale cells containing the NHEJ reporter were transfected with 120 pmol of anti-bwCIRBP or control siRNAs (Dharmacon) three days before I-SceI/DsRed transfections using an Amaxa Nucleofector (U-023 program). For HR knockdown experiments, bowhead whale cells containing the HR reporter were transfected twice every three days with a final concentration of 10 nM anti-bwCIRBP or negative control siRNAs (Silencer Select, Thermo Fisher) using Lipofectamine RNAiMAX transfection reagent (Thermo Fisher) following the manufacturer’s instructions. Cells were further transfected with I-SceI/DsRed plasmids using a 4D-Nucleofector (P2 solution, DS150 program). The efficiency of knockdown was determined by western blot. For details see Supplementary Table 2.
For the extrachromosomal assay and fidelity analysis, NHEJ reporter plasmid was digested with I-Sce1 for 6 h and purified using a QIAEX II Gel Extraction Kit (QIAGEN). Exponentially growing cells were transfected using an Amaxa nucleofector with the U-023 program. In a typical reaction, 106 cells were transfected with 0.25 µg of predigested NHEJ reporter substrate along with 0.025 µg of DsRed to serve as a transfection control. Seventy-two hours after transfection, cells were collected and analysed by flow cytometry on a BD LSR II instrument. At least 20,000 cells were collected for each sample. Immediately after FACS, genomic DNA was isolated from cells using the QIAGEN Blood & Tissue kit. DSB repair sites in the NHEJ construct were amplified by PCR using Phusion polymerase (NEB), cloned using the TOPO Blunt cloning kit (NEB), and sent for Sanger sequencing. At least 100 sequenced clones were aligned and analysed using the ApE software (v.3.1.6). For details see Supplementary Table 2.
Western blotting
All antibodies were checked for conservation of the target epitope in the protein sequence of each included species, and only those targeting regions conserved across these species were used. For a limited number of proteins where the available antibodies with specific epitope information disclosed did not target conserved regions, we selected antibodies based on demonstrated reactivity across a broad range of mammal species and always confirmed these results with multiple antibodies. Information on antibodies is provided in Supplementary Table 2.
Exponentially growing cells were collected with trypsin and counted, and 106 cells were resuspended in 100 µl of PBS containing protease inhibitors. 100 µl of 2× Laemmli buffer (Bio-Rad) was added, and samples were boiled at 95 °C for 10 min. Samples were separated with 4–20% gradient SDS–PAGE, transferred to a PVDF membrane, and blocked in 5% milk-TBS-T for 2 h at room temperature. Membranes were incubated overnight at +4 °C with primary antibodies in 5% milk-TBS-T. After 3 washes for 10 min with TBS-T, membranes were incubated for 1 h at room temperature with secondary antibodies conjugated with HRP or a fluorophore. After 3 washes with TBS-T signal was developed for HRP secondaries with Clarity Western ECL Substrate (Bio-Rad). CIRBP expression was measured with 3 different antibodies targeting conserved epitopes (Extended Data Fig. 7d).
For detecting chromatin-bound proteins, cells were lysed in 1 ml of CSK buffer (10 mM Pipes pH 6.8, 100 mM NaCl, 300 mM sucrose, 3 mM MgCl2, 1 mM EGTA, 0.2% Triton X-100) or CSK + R buffer (10 mM Pipes pH 6.8, 100 mM NaCl, 300 mM sucrose, 3 mM MgCl2, 1 mM EGTA, 0.2% Triton X-100, and 0.3 mg ml−1 RNAse A) at +4 °C for 30 min with gentle rotation. Samples were centrifuged for 10 min at 10,000g at 4 °C, and the supernatant was discarded. Pellets were washed twice with 1 ml of CSK/CSK + R buffer, resuspended in PBS, and an equal volume of 2× Laemmli buffer (Bio-Rad) was added. Samples were boiled at 95 °C for 10 min and subjected to western blotting as described above.
For analysing CIRBP expression in mice and bowhead whale tissues, tissues were pulverized using the cell crusher. For each 5 mg of tissue, 300 µl of 4× Laemmli buffer (Bio-Rad) was added, samples were extensively vortexed, and boiled at 95 °C with 1,000 rpm for 10 min.
To analyse CIRBP expression in flies, 25 flies were homogenized in 250 µl of ice-cold RIPA buffer containing protease inhibitors (ThermoFisher) and incubated for 1 h at 4 °C with continuous shaking. Subsequently, 250 µl of 4× Laemmli buffer (Bio-Rad) was added, the samples were thoroughly vortexed, and then boiled at 95 °C with shaking at 600 rpm for 12 min. Samples were centrifuged at 16,000g for 5 min, and the supernatant was used for western blot analysis.
Antibody dilutions used for this study were as follows: Anti-DNA-PKcs antibody (ab70250, 1:1,000), Rabbit polyclonal anti-Ku80/XRCC5 (NB100-503, 1:500), Ku70 (D10A7) Rabbit monoclonal antibody (4588S, 1:1,000), Rabbit polyclonal anti-Mre11 (NB100-142, 1:5,000), Rabbit polyclonal anti-Rad50 (NBP2-20054, 1:1,000), Rabbit polyclonal anti-Nbs1 (NB100-143, 1:1,000), Rabbit polyclonal anti-PARP1 (NBP2-13732, 1:1,000), SirT6 (D8D12) Rabbit monoclonal antibody (12486S, 1:1,000), RPA34 (RPA2) Mouse Monoclonal Antibody (TA500765, 1:1,000), Rabbit monoclonal (EPR18783) anti-CIRP (ab191885, 1:1,000), Rabbit polyclonal anti-p53 (ab131442, 1:1,000), Rabbit polyclonal anti-RB (ab226979, 1:1,000), PTEN (D4.3) XP Rabbit monoclonal antibody (9188S, 1:1,000), Ras (G12V Mutant Specific) (D2H12) Rabbit monoclonal antibody (14412S, 1:1,000), SV40 large T antigen (D1E9E) Rabbit monoclonal antibody (15729S, 1:1,000), Rabbit polyclonal anti-histone H3 (ab1791, 1:10,000), Rabbit polyclonal anti-beta actin (ab8227, 1:5,000), Poly/Mono-ADP-Ribose (E6F6A) Rabbit monoclonal antibody (83732, 1:1,000), CtIP (D76F7) Rabbit monoclonal antibody (9201S, 1:1,000), Goat anti-mouse IgG H&L (HRP) (ab6789, 1:5,000), Goat anti-rabbit IgG H&L (HRP) (ab6721, 1:5,000).
Expression and purification of bowhead whale CIRBP protein
N-terminal histidine-tagged (6×His) CIRBP was cloned into a pET11a expression vector. The plasmid was transformed into Rosetta gami B (DE3) pLysS competent Escherichia coli for protein expression. Bacteria were grown at 37 °C to an optical density (OD600) of 2.0 and protein expression was induced by adding 0.4 mM isopropyl β-d-1-thiogalactopyranoside (IPTG) for 20 h at 23 °C. Bacteria were collected by centrifugation and pellets were flash frozen on liquid nitrogen and stored at −80 °C. In Bacteria were resuspended in lysis buffer consisting of 50 mM Tris pH 7.5, 2.0 M NaCl, 50 mM imidazole, 10 mg lysozyme, 0.1% Triton X-100, 1 mM DTT and protease inhibitors. The bacterial pellets were sonicated, rotated for 1 h at 4 °C, and sonicated again. The bacterial lysate was clarified by centrifugation at 22,000g for 20 min at 4 °C and the supernatant passed through a 0.45-µm filter. The clarified lysate was purified using Ni-NTA agarose beads (Qiagen) washed with 20 column volumes of water and 20 column volumes of buffer containing 50 mM Tris pH 7.5, 2.0 M NaCl, 1 mM DTT, and 50 mM imidazole (wash buffer 1). The lysate was placed onto the washed beads and transferred to a 50 ml conical tube and rotated for 3 h at 4 °C. The suspended beads were pelleted by centrifugation and washed with 40 column volumes wash buffer 1 and 10 column volumes with buffer containing 50 mM Tris pH 7.5, 150 mM NaCl, 1 mM DTT, and 50 mM imidazole. CIRBP was eluted by adding 5 column volumes of buffer containing 50 mM Tris pH 7.5, 150 mM NaCl, 1 mM DTT, and 500 mM imidazole and rotated the conical tube for 15 minutes at 4 °C. The supernatant was collected by centrifugation and filtered before adding 5% glycerol. The protein was aliquoted, and flash frozen on liquid nitrogen and stored at −80 °C.
NHEJ ligation in vitro assay
The assay was performed essentially as described59,60. Reaction mixtures (10 μl) contained 20 mM Tris-HCl (pH 7.5), 8 mM MgCl2, 0.1 mM ATP, 2 mM DTT, 0.1 M KCl, 2% Glycerol, 4% PEG 8000, 1 nM linearized pUC19 (with cohesive ends via XbaI; 17.3 ng), 10 nM XRCC4–ligase IV complex, and 0.5 or 1 μM human CIRBP. When indicated, reaction mixtures also contained 10 nM Ku70/80 heterodimer, 1 μM XLF dimer, or 1 μM PAXX dimer. The reaction mixtures were incubated for 1 h at 30 °C, followed by the addition of 2 μl of Gel Loading Dye, Purple (6×) (NEB), and incubation for 5 min at 65 °C. Subsequently, 4 μl of each sample was loaded onto a 0.7% agarose gel and subjected to gel electrophoresis (50 V, 50 min). The gel was stained with ethidium bromide, and DNA bands were visualized using a ChemiDoc MP (Bio-Rad).
CIRBP-mediated protection of DNA ends from exonuclease degradation
To assess CIRBP’s ability to protect DNA ends, two complementary in vitro protection assays were performed using either linearized plasmid DNA or a short Cy5-labelled double-stranded oligonucleotide substrate mimicking a DSB end61.
For the plasmid-based assay, a 20 µl reaction containing 2.9 nM of 6.7 kb BamHI-linearized plasmid DNA with cohesive ends was mixed with the indicated concentrations of human recombinant CIRBP in buffer containing 20 mM Tris-HCl (pH 7.5), 20 mM KCl, 10 mM MgCl2, 1 mM DTT, 2.5% glycerol, and 0.5% PEG8000. The reaction was incubated at 25 °C for 30 min. Subsequently, 5 units of T7 exonuclease (NEB) were added, and digestion was carried out for 10 min at 25 °C. Reactions were stopped by adding 6× Gel Loading Dye, Purple (NEB), which contains SDS and EDTA, followed by incubation at 65 °C for 5 min. Samples were analysed by agarose gel electrophoresis and stained with ethidium bromide.
For the short DNA substrate assay, a 20 µl reaction containing 10 nM of a 20 bp Cy5-labelled double-stranded DNA substrate mimicking a DSB end was incubated with human recombinant CIRBP in the same reaction buffer at 25 °C for 30 min. After addition of 5 units of T7 exonuclease, reactions were continued for 10 min at 25 °C. Reactions were stopped by adding 6× loading buffer (20 mM Tris-HCl pH 7.5, 60% glycerol, 1% SDS, 60 mM EDTA) and incubated at 42 °C for 10 min. Samples were resolved on a 20% native polyacrylamide gel and visualized using a ChemiDoc imaging system (Bio-Rad).
The sequences of the DSB-mimicking oligonucleotides were as follows: top strand, /5PHOS/TCACACACGCACGCATTTTT; bottom strand: /5CY5/TTTTTTGCGTGCGTGTGTGA.
For details see Supplementary Table 2.
EMSA
Recombinant human CIRP protein was incubated in the indicated amounts with the indicated nucleic acid substrates in 20 µl EMEM (ATCC) at 37 °C for 1 h. Subsequently, reactions were mixed with 4 µl sucrose loading dye (2 M sucrose + 0.2% Orange G) and loaded into agarose gels immersed in 0.5× TAE buffer followed by electrophoresis at 30 V. Following electrophoresis, gels were stained in 1× SYBR Gold (Thermo Fisher Scientific) and imaged. Extraction of genomic DNA from human primary fibroblasts was with the Monarch HMW DNA Extraction Kit for Cells & Blood (NEB T3050L). To produce the damaged DNA samples and induce PAR formation, cells were treated with H2O2 and UV prior to genomic DNA extraction. For H2O2 treatment, culture medium was replaced with medium containing 400 μM H2O2 that had been diluted into the medium immediately prior to use. For UV treatment, culture medium was aspirated and replaced with a thin layer of PBS. Cells were exposed to 6 J m−2 UVC in a UV Crosslinker (Fisher Scientific) with the culture dish lid removed. During genomic DNA extraction from damaged chromatin, Proteinase K was added per manufacturer instructions, but RNase A was omitted, and Protector Rnase inhibitor (Sigma-Aldrich) was added to the extraction buffers and eluate. Nucleic acids used in reactions were sonicated to uniform size in a QSONICA Sonicator.
For the Ku-binding assays, binding reactions (10 µl) contained 50 nM of a double-stranded DNA substrate (top strand: 5′-Cy5–GATCCCTCTAGATATCGGGCCCTCGATCCG-3′), along with the indicated protein concentrations in a buffer comprising 20 mM Tris-HCl (pH 7.5), 20 mM NaCl, 15 mM KCl, 1 mM EDTA, 1 mM DTT, and 2.5% (vol/vol) glycerol. Reactions were incubated at room temperature for 20 min and then resolved on a native 6% acrylamide gel using 0.5× TBE as the running buffer. The Cy5 fluorescent signal was captured using a ChemiDoc imaging system (Bio-Rad).
For details see Supplementary Table 2.
PARP activity
PARP activity was measured in cell nuclear extracts with the PARP Universal Colorimetric Assay Kit (Trevigen) according to the manufacturer’s instructions. Nuclear extracts were prepared using EpiQuik Nuclear Extraction Kit (EpigenTek) following manufacturer protocol. Total nuclear extract (2.5 µg) was added to measure PARP activity. For details see Supplementary Table 2.
For measurement of PARylation efficiency, cells were treated with 400 µM H2O2 for 15 and 30 min or subjected to 20 Gy γ-radiation. At the end of incubation, cells were placed on ice, washed once with PBS, and lysed directly on a plate with 2× Laemmli buffer. Samples were boiled for 10 min at 95 °C and processed by western blot.
Preparation of fluorescent ligands, binding assays and fluorescence polarization measurements
PAR oligomers of different lengths (PAR16, and PAR28) were synthesized, purified, fractionated, and labelled with Alexa Fluor 488 (AF488) dye at the 1″ end, following as described62,63.
To investigate the binding of human and bowhead whale CIRBPs to the fluorescently labelled PAR and RNA oligomers, titration experiments were conducted. CIRBP proteins were 4:3 serially diluted and titrated into solutions containing a fixed concentration (3 nM) of the fluorescently labelled PAR. The binding reactions were performed in triplicate in a buffer comprising 50 mM Tris-HCl pH 7.5, 100 mM KCl, 2 mM MgCl2, 10 mM β-mercaptoethanol, and 0.1 mg ml−1 BSA. The reactions were incubated in dark at room temperature for 30 min in a Corning 384-well Low Flange Black Flat Bottom Polystyrene NBS Microplate (3575).
After incubation, fluorescence polarization measurements were performed on a CLARIOstar Plus Microplate Reader from BMG LABTECH equipped with polarizers and Longpass Dichroic Mirror 504 nm. The excitation wavelength was set at 482 nm with 16 nm bandwidth, and emission was monitored at 530 nm with 40 nm bandwidth. The fluorescence polarization values were measured three times, the means of which were analysed to determine binding affinities. The binding curves were fitted using a nonlinear regression model to determine dissociation constants (KD). The increase in fluorescence polarization was quantified to indicate the hydrodynamic differences upon proteins binding to ligands. Data analysis and curve fitting were performed using GraphPad Prism.
Immunofluorescence
Exponentially growing cells from humans and bowhead whales were cultured on Lab-Tek II Chamber Slides (ThermoFisher Scientific), followed by treatment with bleomycin at a final concentration of 5 µg ml−1 for 1 h. DNA damage foci were stained with γH2AX and 53BP1 antibodies and quantified at 1 h, 4 h and 24 h. Considering the potential non-specificity of γH2AX and 53BP1 antibodies across species, we used co-localized foci as a more reliable indication of DNA damage.
After bleomycin treatment, cells were washed twice in PBS, fixed with 2% formaldehyde for 20 min at room temperature, washed three times in PBS, and incubated in chilled 70% ethanol for 5 min. After three additional washes in PBS, fixed cells were permeabilized with 0.2% Triton X-100 for 15 min at room temperature, washed twice for 15 min in PBS, and blocked in 8% BSA diluted in PBS supplemented with 0.1% Tween-20 (PBS-T) for 2 h at room temperature. Cells were then incubated with mouse monoclonal anti-γH2AX (Millipore, 05-636, 1:1,000) and rabbit polyclonal anti-53BP1 antibodies (Abcam, ab172580, 1:1,000) diluted in 1% BSA-PBS-T at +4 °C overnight. After incubation with primary antibodies, cells were washed in PBS-T three times for 10 min and incubated with goat anti-rabbit (Alexa Fluor 488) (Abcam, 1:1500) and goat anti-mouse antibodies (Alexa Fluor 568) (Thermo Fisher Scientific, 1:1,000) for 1 h at room temperature. After four washes for 15 min in PBS-T, slides were mounted in VECTASHIELD Antifade Mounting Medium with DAPI.
For chromatin CIRBP association, cells were pre-incubated with CSK/CSK + R buffer for 3 min at room temperature, washed once in PBS, and subjected to the procedure described above using rabbit monoclonal anti-CIRBP antibodies (Abcam, 1:1,000).
Images were captured using the Nikon Confocal system. Confocal images were collected with a step size of 0.5 µm covering the depth of the nuclei. Foci were counted manually under 60× magnification.
For details see Supplementary Table 2.
Construction of lentiviral overexpression vectors and lentivirus production
The coding sequences of hCIRBP and bwCIRBP were amplified by PCR using Phusion polymerase (NEB), digested with EcoRI and NotI, and cloned between the EcoRI and NotI sites of the Lego-iC2 plasmid. The sequence was verified by Sanger sequencing. Lentiviral particles were produced in Lenti-X 293 T cells (Takara). Approximately 10×106 cells were transfected with a mixture of pVSV-G (1.7 µg), psPAX2 (3.4 µg), and Lego-iC2-bwCIRBP (6.8 µg) using PEI MAX (Polysciences). The day after transfection, the DMEM culture medium (ThermoFisher) was replaced with fresh medium, and lentiviral particles were collected from the supernatant for the next 3 days. For details see Supplementary Table 2.
Quantification of micronuclei
To analyse binucleated cells containing micronuclei, 10,000–20,000 cells were plated per chamber slide before irradiation or I-SceI transfection. Immediately after treatment, cytochalasin B was added to the cell culture media at a final concentration of 0.5–1 µg ml−1, and cells were incubated for an additional 72–120 h. At the end of the incubation period, cells were washed with PBS, incubated in 75 mM KCl for 10 min at room temperature, fixed with ice-cold methanol for 1.5–3 min, air-dried, and stored. Immediately before analysis, cells were stained with 100 µg ml−1 acridine orange for 2 min, washed with PBS, mounted in PBS, and analysed by fluorescence microscopy. Alternatively, cells were mounted in VECTASHIELD Antifade Mounting Medium with DAPI. At least 100 binucleated cells were analysed per sample. For details see Supplementary Table 2.
Chromosomal aberration analysis
Metaphase spreads were prepared according to a standard protocol. In brief, 0.06 µg ml−1 colchicine (Sigma) was added to the growth medium for 4 h, and cells were collected with a 0.25% solution of trypsin/EDTA, treated for 10 min with a hypotonic solution (0.075 M KCl/1% sodium citrate) at 37 °C, and fixed with three changes of pre-cooled (−20 °C) methanol/acetic acid mixture (3:1) at −20 °C. Cells were dropped onto pre-cleaned microscope glass slides and air-dried. Metaphase spreads were stained with Giemsa Stain (Sigma) solution in PBS. For each variant, 100 metaphases were analysed. For details see Supplementary Table 2.
Mismatch repair assay
pGEM5Z(+)-EGFP was a gift from L. Sun (Addgene plasmid #65206; http://n2t.net/addgene:65206; RRID:Addgene_65206). p189 was a gift from L. Sun (Addgene plasmid #65207; http://n2t.net/addgene:65207; RRID:Addgene_65207). Preparation of the heteroduplex EGFP plasmid was following a published method64. In brief, pGEM5Z(+)-EGFP plasmid was nicked with Nb.Bpu10I (Thermo Scientific). After phenol/chloroform extraction and ethanol precipitation, the nicked plasmid was digested with Exonuclease III (Thermo Scientific) for 10 min at 30 °C. p189 was linearized with restriction enzyme BstXI (NEB) and mixed with the purified circular ssDNA at a ratio of 1.0:1.5 to generate a heteroduplex EGFP plasmid containing a G/T mismatch and a nick. The heteroduplex EGFP plasmid with high purity was recovered using a DNA cleanup kit.
Exponentially growing cells were transfected using a 4D-nucleofector (Lonza) with the P1 solution using the DS120 program. In a typical reaction, 2 × 10⁵ cells were transfected with 50 ng of heteroduplex EGFP plasmid along with 50 ng of DsRed2 to serve as a transfection control. After transfection (48 h), cells were collected and analysed by flow cytometry on a CytoFlex S flow cytometer (Beckman Coulter).
For details see Supplementary Table 2.
Host cell reactivation assay
A host cell reactivation assay was employed to assess the repair of UV-induced DNA damage via nucleotide excision repair, following previously described methods26.
To evaluate the repair of oxidative DNA damage (base excision repair), a mixture of 20 µg of firefly luciferase (FFL) plasmid and 20–200 µM methylene blue was prepared, with water added to reach a final volume of 0.4 ml. The DNA–methylene blue mixture was dropped onto a petri dish and placed on ice, with another petri dish containing water positioned on top. Subsequently, the DNA–methylene blue mixture was exposed to visible light for 15 min using a 100 W lamp positioned at an 11 cm distance. Damaged DNA was then purified, and the host cell reactivation assay was performed as described for UV-induced DNA damage30. For details see Supplementary Table 2.
Cyclobutane pyrimidine dimer ELISA
Human and bowhead whale skin fibroblasts were cultured until they reached confluency before UVC radiation. Cells were irradiated in PBS at doses of 0, 5, 10, 20 and 30 J m−2 and immediately collected to construct an induction curve. To assess DNA repair, cells were irradiated at 30 J m−2 and then incubated for 6, 24 and 48 h before collecting. Genomic DNA was isolated using the QIAamp Blood Kit (Qiagen). DNA samples were diluted in PBS to a final concentration of 2 µg ml−1, denatured at 100 °C for 10 min, and then incubated in an ice bath for 15 min. Next, 100 ng of denatured DNA solution was applied to ELISA plate wells precoated with protamine sulfate (Cosmo Bio) and dried overnight at 37 °C. Plates were washed five times with PBS supplemented with 0.05% Tween-20 (PBS-T) and then blocked in 2% FBS in PBS-T for 30 min at 37 °C. After five washes with PBS-T, plates were incubated with mouse monoclonal anti-cyclobutane pyrimidine dimer (CPD) antibodies (Clone TDM-2, 1:1,000) in PBS for 30 min at 37 °C. Subsequently, plates were sequentially incubated with goat anti-mouse biotin IgG (Invitrogen, 1:1,000) and streptavidin-HRP (Invitrogen, 1:5,000) in PBS for 30 min at 37 °C each, with five washes with PBS-T before and after each incubation. Plates were then washed with citrate buffer and incubated with a substrate solution (citrate buffer/o-phenylenediamine/hydrogen peroxide) for 30 min at 37 °C. Finally, the reaction was stopped with 2 M H2SO4, and the absorbance was measured at 492 nm using a plate reader. For details see Supplementary Table 2.
CIRBP variant sequence analysis
Identification of rare codons (<10% usage for the corresponding amino acid in human coding sequences) was performed on CIRBP coding sequences using the Benchling Codon Optimization Tool (https://www.benchling.com/). CAI was calculated with human codon frequencies using the E-CAI web server35.
RNA isolation and RNA-seq analysis
RNA from exponentially growing or senescent mouse, cow, human and bowhead whale primary skin fibroblasts was isolated using the RNeasy Plus Mini Kit (Qiagen) according to manufacturer instructions.
Raw reads were demultiplexed using configurebcl2fastq.pl (v.1.8.4). Adapter sequences and low-quality base calls (threshold: Phred quality score <20) in the RNA-sequencing (RNA-seq) reads were first trimmed using Fastp (0.23.4)65. For all species, the clean reads were aligned using Salmon (v.1.5.1)66 to longest coding sequence (CDS) of each gene extracted from corresponding genome assembly based on human-referenced TOGA annotations. The values of read count and effective gene lengths for each gene were collected and integrated into gene sample table according to their orthologous relationship. Salmon transcript counts were used to perform differential expression analysis. Only human genes with orthologues in all species were kept for the downstream species. To filter out low expressed genes, only gene with all sample read counts sum >10 were retained. The filtered count matrix was normalized using median of ratios method67 implemented in DESeq2 package68. The matrix of effective lengths for each gene in each sample was delivered to the DESeq2 ‘DESeqDataSet’ object to avoid biased comparative quantifications resulting from species-specific transcript length variation. Differential expression analysis was performed using DESeq2 and log transformed fold changes were used for gene set enrichment analysis to assess the differential expression of DNA repair pathways in bowhead whale, cow, and mouse compared to human. Genes of DNA repair pathways were compiled from 3 resources: MsigDB database, gene ontology, and a curated gene list (www.mdanderson.org/documents/Labs/Wood-Laboratory/human-dna-repair-genes.html)69,70.
Nanopore sequencing
Seventy-two hours after transfection, cells were collected and genomic DNA was isolated with the Wizard Genomic DNA Purification Kit (Promega). DNA concentration was measured on a Nanodrop spectrophotometer and 100 ng of DNA per sample was PCR-amplified with Q5 High-Fidelity 2× Master Mix (NEB). PCR products were prepared for multiplexed Nanopore sequencing using the Native Barcoding Kit 96 V14 SQK-NBD114.96 (Oxford Nanopore Technologies). Following end prep, barcoding, and adapter ligation, samples were cleaned up using AMPure XP Beads and loaded onto a R10.4.1 flow cell on a MinION Mk1C (Oxford Nanopore Technologies) for sequencing. Raw data was basecalled in Super-High accuracy mode with barcode and adapter trimming enabled, demultiplexed, and aligned to the NHEJ reporter construct reference sequence FASTA in Dorado. A custom Python script was used to parse CIGAR strings from the resulting BAM files and quantify indels.
Genomic DNA extraction and whole-genome sequencing of tumour xenografts
Matching primary cell lines, transformed cell lines, and tumour xenograft samples were prepared as described above. Samples included one mouse cell line, two human cell lines, and two bowhead whale cell lines. One fresh cell pellet was prepared for each primary and transformed cell line. For frozen tumour samples, one tumour for mouse, one tumour for each human cell line (two tumours total), four tumours for whale cell line 14B11SF, and five tumours for whale cell line 18B2SF were included in the analysis. Genomic DNA extraction and whole-genome sequencing were performed as previously described with minor modifications71,72. In brief, DNA was extracted from samples using the QIamp DNA Mini Kit, per manufacturer’s recommendations. Isolated genomic DNA was quantified with Qubit 2.0 DNA HS Assay (ThermoFisher) and quality assessed by agarose gel. Library preparation was performed using KAPA Hyper Prep kit (Roche) per manufacturer’s recommendations. gDNA was sheared to approximately 400 bp using Covaris LE220-plus, adapters were ligated, and DNA fragments were amplified with minimal PCR cycles. Library quantity and quality were assessed with Qubit 2.0 DNA HS Assay (ThermoFisher), Tapestation High Sensitivity D1000 Assay (Agilent Technologies), and QuantStudio 5 System (Applied Biosystems). Illumina 8-nt dual-indices were used. Equimolar pooling of libraries was performed based on QC values and sequenced on an Illumina NovaSeq X Plus (Illumina) with a read length configuration of 150 PE for 60 M PE reads (30 M in each direction) per sample.
Bioinformatic analysis of tumour xenograft whole-genome sequencing
The bioinformatic processing pipeline of raw whole-genome high-throughput sequencing data was adapted for human, mouse and bowhead whale data71. Sequencing FastQ files were applied to FastQC (v.0.11.9; https://www.bioinformatics.babraham.ac.uk/projects/fastqc/) for quality control, adapters were trimmed by Trimmomatic (v.0.39)73, and the genomic fragments were aligned to the human, mouse and whale genome reference (hg19, mm10 and the published bowhead whale genome assembly13) using Burrows–Wheeler Aligner (BWA, v.0.7.19)74, then sorted and indexed by Samtools (v.1.16.1)75. Somatic mutations were detected from tumour samples using MuTect2 (GATK v.4.2.5.0)76 to call somatic SNVs and small indels (<10 bp). Tumour samples from whole-genome sequencing were compared to their respective matched healthy tissue. All mutations were also filtered for depth (tumour sample coverage >30×, normal sample coverage >30×) and variant allele frequency (VAF) ≥ 0.1. Structural variations were called by Manta (v.1.6.0) applying default settings and SV length >6,000 bp were used for downstream analysis77.
Alkaline comet assay
For the alkaline comet assay, we adapted the alkaline comet assay protocol provided by TREVIGEN based on a published in-gel comet assay method78 to increase the number of cell lines and time points assessed and minimize assay variation introduced during sample collection and processing. Slides were precoated with a base layer 50 µl of 1% SeaKem LE Agarose (Lonza) to enhance adhesion. We cultured cells to near 100% confluency and then resuspended them in CometAssay LMAgarose (R&D Systems). We applied 500 cells suspended in 100 µl LMAgarose onto each slide. The slides were then placed in the dark at 4 °C for 10 min to allow the agarose to solidify. After that, slides with live cells were incubated in tissue culture incubators in fibroblast culture medium containing 700 µM freshly diluted H2O2 for 30 min, followed by washing with PBS and incubation for various recovery periods (ranging from 0 min to 12 h) in culture medium. Slides were collected at each time point, washed with PBS, and immersed in CometAssay Lysis Solution (R&D Systems). Before electrophoresis, slides were placed in alkaline unwinding solution prepared according to the TREVIGEN protocol for 10 min. After electrophoresis at 22 V for 30 min, the slides were placed in a DNA precipitation buffer following the TREVIGEN protocol for 10 min and subsequently washed three times with distilled water. The slides were then immersed in 70% ethanol for 10 min and allowed to air dry in the dark. Before imaging, each sample was stained with 50 µl of 1× SYBR Gold (Thermo Fisher Scientific) for 5 min before being washed three times with distilled water. Comet images were acquired through fluorescent microscopy. For scoring, we used profile analysis in OpenComet79 within ImageJ. Outliers automatically flagged by OpenComet were excluded from analysis and remaining incorrectly demarcated comets were further systematically filtered out according to two criteria: a comet area greater than 5,000 or head area greater than 500. For details see Supplementary Table 2.
Tissue processing
Tissues obtained from wild-caught animals were assumed to be of younger/middle age since predation normally precedes ageing in the wild. Postmortem interval was minimized and, in all cases, samples were kept on ice and frozen in less than 24 h. At the earliest opportunity after dissection, tissues from representative animals from each species were flash frozen in liquid nitrogen and stored at −80 °C. Tissues were pulverized to a fine powder within a Biosafety cabinet under liquid nitrogen using a stainless-steel pulverizer Cell Crusher (Fisher Scientific) chilled in liquid nitrogen and delivered to storage tubes with a scoop that had also been pre-chilled in liquid nitrogen and kept on dry ice. Similarly, when sampled for various omics processing, pulverized tissues were removed with a stainless-steel spatula that was pre-chilled in liquid nitrogen. Samples were never thawed after initial freezing until extractions were performed.
Cross-species tissue proteomics
We employed a shotgun-style untargeted data-dependent acquisition label-free quantitative (LFQ) approach. Approximately 5 mg of tissue was mixed with 250 µl of 50 mM TEAB pH7.6; 5% SDS, mixed by pipetting, and briefly vortexed. Samples were sonicated in a chilled cup horn Q800R3 Sonicator System (Qsonica) for a total of 15 min at 30% output and duration of 30 ×30 s pulses (with 30 s in between pulses) at 6 °C using a chilled circulating water bath. When nuclear proteomes were analysed, nuclei were first isolated using a hypotonic lysis approach as in the preparation of histones80. Isolated nuclei were lysed and processed as indicated above with SDS and sonication and then handled similarly for the rest of the prep. Samples were heated to 90 °C for 2 min and allowed to cool to room temperature. Next, samples were centrifuged at 14,000g for 10 min to pellet insoluble debris and the supernatants were transferred to clean tubes. Total protein was quantified by the BCA assay and 100 µg was reduced with 5 mM dithiothreitol (DTT) for 30 min at 60 °C. Samples were cooled to room temperature and then alkylated with 10 mM iodoacetamide (from a freshly prepared stock) for 30 min at room temperature in the dark. Samples were processed using the standard S-trap mini column method (Protifi; Farmingdale, NY). Samples were digested with 4 μg trypsin overnight at 37 °C. Elution fractions were pooled and dried using a Speedvac (Labconco). Peptides were resuspended in 100 μl MS-grade water (resistance ≥18MΩ) and quantified using the Pierce Quantitative Fluorometric Peptide Assay (Thermo). Common internal Retention Time standards (CiRT) peptide mix was added (50 fmol mix/2 µg tryptic peptides) and 2 µg (in 4 µl) of tryptic peptides were injected/analysed by mass spectrometry (MS) on a Orbitrap Tribrid Fusion Lumos instrument (Thermo) equipped with an EASY-Spray HPLC Column (500 mm x 75um 2um 100 A P/N ES803A, Nano-Trap Pep Map C18 100 A; Thermo). Buffer A was 0.1% formic acid and buffer B was 100% acetonitrile with 0.1% formic acid. Flow rate was 300 nl/min and runs were 150 min: 0–120 min, 5% B to 35% B; then from 120–120.5 min, 35–80% B; followed by a 9-minute 80% B wash until 130 min. From 130–130.5 min B was decreased to 5% and the column was re-equilibrated for the remaining 20-min at 5% B. the instrument was run in data-dependent analysis mode. MS2 fragmentation was with HCD (30% energy fixed) and dynamic exclusion was operative after a single time and lasted for 30 s. Additional instrument parameters may be found in the Thermo RAW files.
Computational proteomics analysis
Raw files were analysed directly with the MSFragger (v.3.4)/Philosopher pipeline (v.4.2.1)81,82 and included Peptide and Protein Prophet modules83 for additional quality control. Quantitation at the level of MS1 was performed with the label-free quant–match between runs (LFQ-MBR) workflow using default parameters. This allows for alignment of chromatographic peaks between separate runs. Methionine oxidation and N-terminal acetylation were set as variable modifications. MaxLFQ with a minimum of two ions was implemented and normalization of intensity across runs was selected84.
LC–MS proteomic analysis of fibroblasts
Two 15-cm dishes of growing primary fibroblasts from 2 cell lines for each species were collected for protein. Cells were washed with PBS and pellets were snap frozen and stored in liquid nitrogen until processing. Cells were solubilized with 5% SDS; 50 mM TEAB pH 7 and sonicated at 8 °C with 10× 45 s pulses using 30% power with 15 s rest between each pulse with a cup horn Q800R3 Sonicator System (Qsonica). Soluble proteins were reduced with 10 mM DTT for 30 min at 55 °C, followed by alkylation with 15 mM iodoacetamide at 25 °C in the dark for 30 min. S-trap micro columns (Protifi) were employed after this step for overnight tryptic digestion and peptide isolation according to manufacturer instructions. All solvents were MS-grade. Resulting tryptic peptides were resuspended in MS-grade water and were quantified using a Pierce Quantitative Fluorometric Peptide Assay (Thermo Fisher 23290). Prior to MS, peptides were mixed with a common internal retention time standards115 (CiRT) peptide mix (50 fmol CiRT per 2 µg total tryptic peptides) and acetonitrile and formic acid were added to concentrations of 5% and 0.2% respectively. The final concentration of the peptide mix was 0.5 µg µl−1. Two micrograms (4 µl) of each were resolved by nano-electrospray ionization on an Orbitrap Fusion Lumos MS instrument (Thermo) in positive ion mode. A 30 cm home-made column packed with 1.8 μm C18 beads was employed to resolve the peptides. Solvent A was 0.1% formic acid and solvent B was 80% acetonitrile with 0.1% formic acid and flow rate was 300 nl min−1. The length of the run was 3 h with a 155 min gradient from 10–38% B. HCD (30% collision energy) was used for MS2 fragmentation and dynamic exclusion was operative after a single time and lasted for 30 s. Peptide assignments and quantitation were done using the LFQ-MBR workflow of MSFragger81,82,83. MaxLFQ with a minimum of two ions was implemented and normalization was selected. Additional details are available in MSFragger log files. Searches were performed within the Philosopher/Fragpipe pipeline that incorporates PeptideProphet and ProteinProphet filtering steps to increase the likelihood of correct assignments83. The databases used for searches were predicted proteins from the published bowhead genome13 as well as our custom proteome derived from our de novo sequenced and Trinity30,85-assembled pool of transcriptomes from whale tissues. Human (UP000005640), mouse (UP000000589), and bovine (UP000009136) databases were from the latest build available from Uniprot86. For the searches, databases also included a reverse complement form of all peptides as well as common contaminants to serve as decoys for false discovery rate calculation by the target/decoy approach (decoy present at 50%). Final false discovery rate was below 1%. To distinguish between non-quantifiable and non-detected proteins in figure displays, proteins detected but below the limit of quantification were imputed to an abundance of 104, and proteins not detected were imputed to an abundance of 0.
Doxycycline-inducible I-SceI NHEJ reporter
The plasmid was assembled from several parts. The backbone was amplified from a pN1 plasmid without f1 bacteriophage origin of replication and modified by the addition of short insulator sequences87 (E2, A2 and A4) purchased from Integrated DNA Technologies. The GFP reporter gene with I-SceI endonuclease sites was amplified from the reporter described above and fused via the P2A self-cleaving peptide with TetOn transactivator, amplified from Lenti-X Tet-One Inducible Expression System Puro (Takara, 631847). A bi-directional promoter sequence featuring hPGK and TRE3GS was amplified from the same plasmid and cloned upstream of the GFP reporter, in the orientation for TetOn-P2A-reporter to be driven by the constitutive hPGK promoter. Downstream of the Tre3GS promoter was closed codon-optimized sequence for intron-encoded endonuclease I (I-SceI) with SV40 nuclear localization sequence (NLS) at the N-terminus and nucleoplasmin NLS at the C-terminus fused to the enhanced blue fluorescent protein (eBFP2) via P2A. The fusion was purchased from Integrated DNA Technologies. EBFP2 sequence was derived from eBFP2-N2 plasmid (Addgene #54595). Cloning was done with In-fusion Snap assembly kit (Takara 638947), NEBuilder HiFi DNA Assembly (NEB, E5520) and T4 DNA ligase (NEB, M0202). The efficiency of NHEJ DSB repair was analysed in immortalized normal human dermal fibroblasts (NHDF2T). The expression cassette containing a GFP reporter gene under hPGK promoter and an I-SceI endonuclease under doxycycline-inducible Tre3GS promoter was inserted into the genome by random integration method. The positive clones were selected by G418 for 10 days and the clones were pooled together. The GFP reporter had a short adeno-exon flanked by two I-SceI recognition sites (in inverted orientation) surrounded by the rat Pem1 intron. Upon stimulation with doxycycline (100 ng ml−1), I-SceI produced two non-ligatable DSBs, resulting in excision of the adeno-exon and reconstitution of the functional GFP.
Fly lines, husbandry and lifespan assays
Virgin daughterless-GeneSwitch (daGS)88 female flies were crossed to transgenic male flies harbouring human or whale CIRBP. The human and whale genes were cloned into the pUAStattB plasmid (confirmed by Oxford Nanopore Plasmid sequencing) and injected into the VK1 strain by Genetivision. We then crossed these flies into a ywR background. Sequences of CIRBP were exactly the same as those used for other experiments in this study, apart from a synonymous change in whale where base 303 was changed from G to A to reduce GC content, so that it could be ordered as a whole gBlock.
Crosses were performed in bottles (at 25 °C in incubators), and offspring were mated for two days, prior to separation of sexes under light CO2 anaesthesia (<5 l min−1). Age-synchronized cohorts were split for each cross into the four treatments (control, 50 µM, 100 µM, 200 µM RU486) each day for lifespan experiments. Diets89 consisted of 8% yeast, 13% table sugar, 6% cornmeal, 1% agar, and nipagin 0.225% (w/v) (growing bottles contained an additional 0.4% (v/v) propanoic acid to reduce bacterial growth). Each media cook was split into four, and an equal volume of ethanol (8.6 ml l−1) was added to each batch in which RU486 was dissolved, to generate 0 µM (control), 50 µM (low), 100 µM (medium) and 200 µM (high). We used a cross of daGS against ywR as a wild-type control for the effect of RU486, and no effect on lifespan was found, as we and others have found repeatedly before90,91. Food was stored at 4–9 °C for a maximum of 2 weeks and warmed to room temperature before use.
Lifespan analysis was performed at 25 °C in a climate controlled room with 50–75 female flies per demography cage, with 6–7 replicate cages per treatment per cross. Dead flies were counted every other day, with flies stuck to the food or escaped, right-censored. All lifespan data presented was run concurrently at the same time. Data was analysed using mixed-effects coxme models accounting for the effects of cage and transfer day (to correct for shared environmental effects). In separate experiments, but ran around the same time, and following the same procedure as above, we exposed flies to a lethal dose of X-ray (650 Gy) using RX-650 X-radiator System (Faxitron). This data was analysed using coxph. All treatments were irradiated within the same batches, whilst housed in a 2 ml eppendorf in groups of a maximum of 20. Female flies were irradiated at age 17 days and remaining lifespan was measured in the cage setup as described above.
Statistical analyses
Statistical comparisons were performed as indicated in the figure legends. Unless otherwise specified in the text or legend, n refers to separate biological replicate cell lines, isolated from different individuals for a given species. Exceptions include specific genetically modified cell lines or clones, for example, tumour suppressor knockout lines. In such cases, n refers to technical replicates and indicates the number of times the experiment was repeated with the specified cell line. Details for comparisons done by ANOVA are included in Supplementary Table 1.
Reporting summary
Further information on research design is available in the Nature Portfolio Reporting Summary linked to this article.
Data availability
DNA and RNA-sequencing data have been deposited in the NCBI Sequence Read Archive under BioProject accession PRJNA1314725. Proteomics raw data have been deposited to the ELITE portal at Sage Bionetworks via Synapse (https://www.synapse.org) under the following dataset IDs: bowhead whale: syn69822201, syn69822202, syn69822206, syn69822205, syn69776655, syn69776673, syn69776639, syn65855481, syn65855514, syn65855552, syn69766212, syn69766211, syn69766232, syn69766213, syn69766210, syn69766223; cow: syn69822232, syn69822231, syn69776659, syn69776670, syn69776669, syn65856670, syn65856673, syn65856668, syn69766237, syn69766263, syn69766264, syn69766265, syn69766260, syn69766266; mouse: syn69822242, syn69822243, syn69776661, syn69776671, syn69776686, syn65855200, syn65855231, syn65855263, syn69766378, syn69766379, syn69766374, syn69766380, syn69766375, syn69766435; human: syn69822244, syn69822245; blind mole rat: syn65856679, syn65856678, syn65856666, syn69766519, syn69766522, syn69766523, syn69766526, syn69766527, syn69766528; deer mouse: syn65856677, syn65855101, syn65855170, syn69766563, syn69766565, syn69766564, syn69766583, syn69766582, syn69766584; beaver: syn65855292, syn65855322, syn65855353, syn69766496, syn69766497, syn69766495, syn69766511, syn69766510, syn69766512; rat: syn65855386, syn65855420, syn65855451, syn69766638, syn69766639, syn69766640, syn69766659, syn69766653, syn69766660; chinchilla: syn65855584, syn65855617, syn65855648, syn69766545, syn69766544, syn69766543, syn69766552, syn69766551, syn69766553; naked mole rat: syn65855679, syn65855711, syn65855749, syn69766456, syn69766455, syn69766461, syn69766466, syn69766467, syn69766468; guinea pig: syn65855780, syn65855818, syn65855849, syn69766358, syn69766360, syn69766275, syn69766361, syn69766359, syn69766362.
Code availability
All software used in this study is publicly available, with version numbers and sources listed in the Reporting Summary. Custom Python scripts used to quantify indels from Nanopore sequencing data are available on Zenodo at https://doi.org/10.5281/zenodo.17112093 (ref. 92).
Change history
28 November 2025
A Correction to this paper has been published: https://doi.org/10.1038/s41586-025-09952-6
References
Tacutu, R. et al. Human Ageing Genomic Resources: new and updated databases. Nucleic Acids Res. 46, D1083–D1090 (2018).
Peto, R. in The Origins of Human Cancer, Vol. 4 (eds Hiatt, H., Watson, J. & Winsten, J.) 1403–1428 (Cold Spring Harbor Laboratory, 1977).
TEK & Bowhead Life History and Longevity. The North Slope Borough https://www.north-slope.org/departments/wildlife-management/studies-research-projects/bowhead-whales/traditional-ecological-knowledge-of-bowhead-whales/tek-bowhead-life-history-and-longevity/ (2025).
Rosa, C. et al. Age estimates based on aspartic acid racemization for bowhead whales (Balaena mysticetus) harvested in 1998–2000 and the relationship between racemization rate and body temperature. Mar. Mamm. Sci. 29, 424–445 (2013).
George, J. C. & Bockstoce, J. R. Two historical weapon fragments as an aid to estimating the longevity and movements of bowhead whales. Polar Biol. 31, 751–754 (2008).
Philo, L. M., Shotts, E. B. & George, J. C. Morbidity and mortality—the bowhead whale. Soc. Mar. Mammal. Spec. Publ. 275, 312 (1993).
George, J. C. et al. Age and growth estimates of bowhead whales (Balaena mysticetus) via aspartic acid racemization. Can. J. Zool. 77, 571–580 (1999).
Wetzel, D. et al. Age estimation for bowhead whales, Balaena mysticetus, using aspartic acid racemization with enhanced hydrolysis and derivatization procedures. Paper SC/65b/BRG05 presented to the Scientific Committee of the International Whaling Commission (2014).
George, J. C, et al. A new way to estimate the age of bowhead whales (Balaena mysticetus) using ovarian corpora counts. Can. J. Zool. 89, 840–852 (2011).
Vincze, O. et al. Cancer risk across mammals. Nature 601, 263–267 (2022).
Boddy, A. M. et al. Lifetime cancer prevalence and life history traits in mammals. Evol. Med. Public Health 2020, 187–195 (2020).
Tollis, M., Boddy, A. M. & Maley, C. C. Peto’s paradox: how has evolution solved the problem of cancer prevention?. BMC Biol. 15, 60 (2017).
Keane, M. et al. Insights into the evolution of longevity from the bowhead whale genome. Cell Rep. 10, 112–122 (2015).
Tollis, M. et al. Return to the sea, get huge, beat cancer: an analysis of cetacean genomes including an assembly for the humpback whale (Megaptera novaeangliae). Mol. Biol. Evol. 36, 1746–1763 (2019).
Seim, I. et al. The transcriptome of the bowhead whale Balaena mysticetus reveals adaptations of the longest-lived mammal. Aging 6, 879–899 (2014).
Armitage, P. & Doll, R. The age distribution of cancer and a multi-stage theory of carcinogenesis. Br. J. Cancer 8, 1–12 (1954).
Rangarajan, A., Hong, S. J., Gifford, A. & Weinberg, R. A. Species- and cell type-specific requirements for cellular transformation. Cancer Cell 6, 171–183 (2004).
Sulak, M. et al. TP53 copy number expansion is associated with the evolution of increased body size and an enhanced DNA damage response in elephants. eLife 5, e11994 (2016).
Vazquez, J. M., Sulak, M., Chigurupati, S. & Lynch, V. J. A zombie LIF gene in elephants is upregulated by TP53 to induce apoptosis in response to DNA damage. Cell Rep. 24, 1765–1776 (2018).
Abegglen, L. M. et al. Potential mechanisms for cancer resistance in elephants and comparative cellular response to DNA damage in humans. JAMA 314, 1850 (2015).
Vazquez, J. M. & Lynch, V. J. Pervasive duplication of tumor suppressors in Afrotherians during the evolution of large bodies and reduced cancer risk. eLife 10, e65041 (2021).
Vazquez, J. M. et al. Parallel evolution of reduced cancer risk and tumor suppressor duplications in Xenarthra. eLife 11, e82558 (2022).
Lorenzini, A. et al. Significant correlation of species longevity with DNA double strand break-recognition but not with telomere length. Mech. Ageing Dev. 130, 784 (2009).
Zhang, L. et al. Maintenance of genome sequence integrity in long- and short-lived rodent species. Sci. Adv. 7, eabj3284 (2021).
Article ADS MathSciNet CAS PubMed PubMed Central Google Scholar
Cagan, A. et al. Somatic mutation rates scale with lifespan across mammals. Nature 604, 517–524 (2022).
Tian, X. et al. SIRT6 is responsible for more efficient DNA double-strand break repair in long-lived species. Cell 177, 622–638.e22 (2019).
Fortunato, A., Fleming, A., Aktipis, A. & Maley, C. C. Upregulation of DNA repair genes and cell extrusion underpin the remarkable radiation resistance of Trichoplax adhaerens. PLoS Biol. 19, e3001471 (2021).
Tian, X. et al. Evolution of telomere maintenance and tumour suppressor mechanisms across mammals. Phil. Trans. R. Soc. B 373, 20160443 (2018).
Kucab, J. E. et al. A compendium of mutational signatures of environmental agents. Cell 177, 821 (2019).
Lu, J. Y. et al. Comparative transcriptomics reveals circadian and pluripotency networks as two pillars of longevity regulation. Cell Metab. 34, 836–856.e5 (2022).
Nishiyama, H. et al. A glycine-rich RNA-binding protein mediating cold-inducible suppression of mammalian cell growth. J. Cell Biol. 137, 899–908 (1997).
Sheikh, M. S. et al. Identification of several human homologs of hamster DNA damage-inducible transcripts. Cloning and characterization of a novel UV-inducible cDNA that codes for a putative RNA-binding protein. J. Biol. Chem. 272, 26720–26726 (1997).
Chen, J. K., Lin, W. L., Chen, Z. & Liu, H. wen. PARP-1–dependent recruitment of cold-inducible RNA-binding protein promotes double-strand break repair and genome stability. Proc. Natl Acad. Sci. USA 115, E1759–E1768 (2018).
Wellmann, S. et al. Oxygen-regulated expression of the RNA-binding proteins RBM3 and CIRP by a HIF-1-independent mechanism. J. Cell Sci. 117, 1785–1794 (2004).
Puigbò, P., Bravo, I. G. & Garcia-Vallvé, S. E-CAI: a novel server to estimate an expected value of codon adaptation index (eCAI). BMC Bioinformatics 9, 65 (2008).
Klaric, J. A., Wüst, S. & Panier, S. New faces of old friends: emerging new roles of RNA-binding proteins in the DNA double-strand break response. Front. Mol. Biosci. 8, 668821 (2021).
Ford, D. & Tower, J. in Handbook of the Biology of Aging (eds Masoro, E. J. & Austad, S. N.) 400–414 (Elsevier, 2005).
Lenard, A. J. et al. Phosphorylation regulates CIRBP arginine methylation, transportin-1 binding and liquid–liquid phase separation. Front. Mol. Biosci. 8, 689687 (2021).
Bujarrabal-Dueso, A., Garinis, G. A., Robbins, P. D., Vijg, J. & Schumacher, B. Targeting DNA damage in ageing: towards supercharging DNA repair. Nat. Rev. Drug Discov. 24, 785–807 (2025).
Chen, Y. et al. Fight to the bitter end: DNA repair and aging. Ageing Res. Rev. 64, 101154 (2020).
Seluanov, A., Vaidya, A. & Gorbunova, V. Establishing primary adult fibroblast cultures from rodents. J. Vis. Exp. 44, 2033 (2010).
Elsner, R., Meiselman, H. J. & Baskurt, O. K. Temperature-viscosity relations of bowhead whale blood: a possible mechanism for maintaining cold blood flow. Mar. Mamm. Sci. 20, 339–344 (2004).
George, J. C. Growth, Morphology and Energetics of Bowhead Whales (Balaena mysticetus) (University of Alaska Fairbanks, 2009).
Borowicz, S. et al. The soft agar colony formation assay. J. Vis. Exp. https://doi.org/10.3791/51998 (2014).
Maslov, A. Y. et al. Single-molecule, quantitative detection of low-abundance somatic mutations by high-throughput sequencing. Sci. Adv. 8, eabm3259 (2022).
Quail, M. A. et al. Optimal enzymes for amplifying sequencing libraries. Nat. Methods 9, 10–11 (2012).
Blackburn, M. C. Development of New Tools and Applications for High-throughput Sequencing of Microbiomes in Environmental or Clinical Samples. B. S. thesis, MIT (2010).
Clement, K. et al. CRISPResso2 provides accurate and rapid genome editing sequence analysis. Nat. Biotechnol. 37, 224–226 (2019).
Lee, H. J., Chang, H. Y., Cho, S. W. & Ji, H. P. CRISPRpic: fast and precise analysis for CRISPR-induced mutations via prefixed index counting. NAR Genomics Bioinformatics 2, lqaa012 (2020).
St John, J. et al. SeqPrep: tool for stripping adaptors and/or merging paired reads with overlap into single reads. https://github.com/jstjohn/SeqPrep (2016).
Johnson, G. E. in Genetic Toxicology (eds Parry, J. M. & Parry, E. M.) 55–67 (Humana Press, 2012).
Franken, N. A. P., Rodermond, H. M., Stap, J., Haveman, J. & van Bree, C. Clonogenic assay of cells in vitro. Nat. Protoc. 1, 2315–2319 (2006).
Rose, J. C. et al. Rapidly inducible Cas9 and DSB-ddPCR to probe editing kinetics. Nat. Methods 14, 891 (2017).
Hudon, S. F. et al. Primers to highly conserved elements optimized for qPCR-based telomere length measurement in vertebrates. Mol. Ecol. Resour. 21, 59–67 (2021).
Dimri, G. P. et al. A biomarker that identifies senescent human cells in culture and in aging skin in vivo. Proc. Natl Acad. Sci. USA 92, 9363 (1995).
Debacq-Chainiaux, F., Erusalimsky, J. D., Campisi, J. & Toussaint, O. Protocols to detect senescence-associated beta-galactosidase (SA-βgal) activity, a biomarker of senescent cells in culture and in vivo. Nat. Protoc. 4, 1798–1806 (2009).
Seluanov, A., Mao, Z. & Gorbunova, V. Analysis of DNA Double-strand Break (DSB) repair in mammalian cells. J. Vis. Exp. https://doi.org/10.3791/2002 (2010).
Mao, Z. et al. SIRT6 promotes DNA repair under stress by activating PARP1. Science 332, 1443–1446 (2011).
Vu, D.-D. et al. Multivalent interactions of the disordered regions of XLF and XRCC4 foster robust cellular NHEJ and drive the formation of ligation-boosting condensates in vitro. Nat. Struct. Mol. Biol. 31, 1732–1744 (2024).
Roy, S. et al. XRCC4/XLF interaction is variably required for DNA Repair and is not required for ligase IV stimulation. Mol. Cell. Biol. 35, 3017–3028 (2015).
Conlin, M. P. et al. DNAligase IV guides end-processing choice during nonhomologous end joining. Cell Rep. 20, 2810–2819 (2017).
Dasovich, M. et al. Identifying poly(ADP-ribose)-binding proteins with photoaffinity-based proteomics. J. Am. Chem. Soc. 143, 3037–3042 (2021).
Tan, E. S., Krukenberg, K. A. & Mitchison, T. J. Large-scale preparation and characterization of poly(ADP-ribose) and defined length polymers. Anal. Biochem. 428, 126–136 (2012).
Zhou, B. et al. Preparation of heteroduplex enhanced green fluorescent protein plasmid for in vivo mismatch repair activity assay. Anal. Biochem. 388, 167–169 (2009).
Chen, S., Zhou, Y., Chen, Y. & Gu, J. fastp: an ultra-fast all-in-one FASTQ preprocessor. Bioinformatics 34, i884–i890 (2018).
Patro, R., Duggal, G., Love, M. I., Irizarry, R. A. & Kingsford, C. Salmon provides fast and bias-aware quantification of transcript expression. Nat. Methods 14, 417–419 (2017).
Anders, S. & Huber, W. Differential expression analysis for sequence count data. Genome Biol. 11, R106 (2010).
Love, M. I., Huber, W. & Anders, S. Moderated estimation of fold change and dispersion for RNA-seq data with DESeq2. Genome Biol. 15, 550 (2014).
Lange, S. S., Takata, K. I. & Wood, R. D. DNA polymerases and cancer. Nat. Rev. Cancer 11, 96–110 (2011).
Wood, R. D., Mitchell, M. & Lindahl, T. Human DNA repair genes, 2005. Mutat. Res. 577, 275–283 (2005).
Perelli, L. et al. Interferon signaling promotes tolerance to chromosomal instability during metastatic evolution in renal cancer. Nat. Cancer 4, 984–1000 (2023).
Perelli, L. et al. Evolutionary fingerprints of epithelial-to-mesenchymal transition. Nature 640, 1083–1092 (2025).
Bolger, A. M., Lohse, M. & Usadel, B. Trimmomatic: a flexible trimmer for Illumina sequence data. Bioinformatics 30, 2114–2120 (2014).
Li, H. & Durbin, R. Fast and accurate short read alignment with Burrows-Wheeler transform. Bioinformatics 25, 1754–1760 (2009).
Li, H. et al. The Sequence Alignment/Map format and SAMtools. Bioinformatics 25, 2078 (2009).
Van der Auwera, G. A. et al. From FastQ data to high confidence variant calls: the Genome Analysis Toolkit best practices pipeline. Curr. Protoc. Bioinformatics 43, 11.10.1–11.10.33 (2013).
Chen, X. et al. Manta: rapid detection of structural variants and indels for germline and cancer sequencing applications. Bioinformatics 32, 1220–1222 (2016).
Nickson, C. M. & Parsons, J. L. Monitoring regulation of DNA repair activities of cultured cells in-gel using the comet assay. Front. Genet. 5, 232 (2014).
Gyori, B. M., Venkatachalam, G., Thiagarajan, P. S., Hsu, D. & Clement, M. V. OpenComet: an automated tool for comet assay image analysis. Redox Biol. 2, 457–465 (2014).
Shechter, D., Dormann, H. L., Allis, C. D. & Hake, S. B. Extraction, purification and analysis of histones. Nat. Protoc. 2, 1445–1457 (2007).
da Veiga Leprevost, F. et al. Philosopher: a versatile toolkit for shotgun proteomics data analysis. Nat. Methods 17, 869–870 (2020). 2020 17:9.
Kong, A. T., Leprevost, F. V., Avtonomov, D. M., Mellacheruvu, D. & Nesvizhskii, A. I. MSFragger: ultrafast and comprehensive peptide identification in mass spectrometry–based proteomics. Nat. Methods 14, 513–520 (2017).
Ma, K., Vitek, O. & Nesvizhskii, A. I. A statistical model-building perspective to identification of MS/MS spectra with PeptideProphet. BMC Bioinformatics 13, S1 (2012).
Yu, F., Haynes, S. E. & Nesvizhskii, A. I. IonQuant enables accurate and sensitive label-free quantification with FDR-controlled match-between-runs. Mol. Cell Proteomics 20, 100077 (2021).
Haas, B. J. et al. De novo transcript sequence reconstruction from RNA-seq using the Trinity platform for reference generation and analysis. Nat. Protoc. 8, 1494–1512 (2013).
Bateman, A. et al. UniProt: the universal protein knowledgebase in 2021. Nucleic Acids Res. 49, D480–D489 (2021).
Liu, M. et al. Genomic discovery of potent chromatin insulators for human gene therapy. Nat. Biotechnol. 33, 198–203 (2015). 2014 33:2.
Tricoire, H. et al. The steroid hormone receptor EcR finely modulates Drosophila lifespan during adulthood in a sex-specific manner. Mech. Ageing Dev. 130, 547–552 (2009).
McCracken, A. W., Buckle, E. & Simons, M. J. P. The relationship between longevity and diet is genotype dependent and sensitive to desiccation in Drosophila melanogaster. J. Exp. Biol. https://doi.org/10.1242/jeb.230185 (2020).
Hayman, D. J. et al. Expansion of Drosophila haemocytes using a conditional GeneSwitch driver affects larval haemocyte function, but does not modulate adult lifespan or survival after severe infection. J. Exp. Biol. 228, jeb249649 (2025).
Simons, M. J. P., Hartshorne, L., Trooster, S., Thomson, J. & Tatar, M. Age-dependent effects of reduced mTor signalling on life expectancy through distinct physiology. Preprint at bioRxiv https://doi.org/10.1101/719096 (2019).
Zacher, M. Nanopore indel quantification (version 1). Zenodo https://doi.org/10.5281/zenodo.17112094 (2025).
Acknowledgements
We thank the researchers at the North Slope Borough Department of Wildlife Management, the Alaska Eskimo Whaling Commission, and the Iñupiaq community of Barrow for generously sharing bowhead whale samples, time, resources, skill and knowledge, and without whom the above work would not have been possible. We give a special thanks to John Craighead “Craig” George, whose pioneering field work established the remarkable longevity of the bowhead whale, and whose kind collaboration and insights helped initiate this project, but who sadly was unable to see its completion. We thank A. Rogers, M. Wilmot and R. Kennington for technical support; T. Harrison, L. Duke, the Exotic Species Research Alliance, and Georgia Aquarium for facilitating the collection of the bottlenose dolphin sample; the Marine Mammal Care Center Los Angeles for collecting samples from California sea lions; San Diego Zoo Wildlife Alliance for providing cells from hippopotamus, common dolphin and humpback whale; and L. Palmer and the Marine Mammal Care Center Los Angeles for collecting samples from California sea lions. Experiments on in vitro ligation were supported by the French National Research Agency. Drosophila experiments were supported by Wellcome and Royal Society; 216405/Z/19/Z. Experiments on PAR binding were supported by National Institutes of Health GM104135 to A.K.L.L. L.P. was supported by the Cancer Prevention and Research Institute of Texas RR250083, a Department of Defense Discovery Award PR240469 and a National Institute of Neurological Disorders and Stroke R03 Award R03NS145168.This work was supported by grants from US National Institutes on Aging AG047200 to V.N.G., Zhengdong Zhang, J.V., A.S. and V.G., AG051449 to A.S. and V.G., AG056278 to Z.Z., J.V. and V.G., AG046320 to A.S., AG064704 to V.N.G. and V.G., AG064706 to V.G., and by an award from The Milky Way Research Foundation and the Longevity Impetus Grant to V.G. Additional support was provided by the NIH/NCI (CA285454-01A1, CA288448-01), the Department of Defense (KC200096) and the NIH (CA258226-01) to G.G.
Ethics declarations
Competing interests
VG is a consultant for DoNotAge, MatrixBio, Elysium, Bionic Health, WndrHealth and GenFlow Bio. JV and AYM are founders and shareholders of Singulomics Corp and Mutagentech Inc. Other authors declare no competing interests.
Peer review
Peer review information
Nature thanks Alex Cagan, Robert Shmookler Reis and the other, anonymous, reviewer(s) for their contribution to the peer review of this work. Peer review reports are available.
Additional information
Publisher’s note Springer Nature remains neutral with regard to jurisdictional claims in published maps and institutional affiliations.
Extended data figures and tables
Extended Data Fig. 1 Telomerase activity, cell death, and fibroblast line validation.
a, Telomerase activity in bowhead whale tissues. MSF, mouse skin fibroblasts, and HeLa cells used as a positive control. b, qRT–PCR analysis of hTERT expression in primary and hTERT-immortalized fibroblasts from human and bowhead whale (n = 3 biological replicates per species). Data are presented as mean ± SD. c, Apoptosis and necrosis in fibroblasts from human (n = 3 biological replicates) and bowhead whale (n = 2 biological replicates) following ENU treatment (3 h) at indicated doses. Annexin V/PI staining was performed after 3 days. Data are presented as mean. No statistical tests were applied because n < 3 for bowhead whale samples. d–j, Western blots validating fibroblast cell lines. d, SV40 Large T antigen (LT) and H-RasG12V in transformed vs. untransformed lines (Fig. 2). e, SV40 Small T antigen (ST) in the same lines. f, p53 in colonies after CRISPR-mediated TP53 knockout; clones C13 and C17 were selected. g, Rb in colonies after CRISPR-mediated RB1 knockout using pooled p53–/– clones; clones C1 and C26 were selected. (h) p53 in clones C13 and C17. i, Rb in clones C1 and C26. j, PTEN in colonies after CRISPR-mediated PTEN knockout. For gel source data, see Supplementary Figure 1. k, l, Reporter assays confirming knockout clones. k, p53 activity measured by firefly/Renilla luciferase after etoposide treatment. l, Rb activity measured by E2F-responsive firefly/Renilla luciferase; elevated E2F reflects reduced Rb function. n = 3 biologically independent experiments. Data are presented as mean ± SD; P values were calculated using Welch’s two-sided t-test.
Extended Data Fig. 2 Mutation rates in bowhead whale cells during tumour progression.
a, Schematic of experimental design and sample collection for whole-genome sequencing (WGS). Samples included bowhead whale tumours (n = 9), human tumours (n = 2), and a mouse tumour (n = 1). b, Relative percentages of single-nucleotide variant (SNV) types across species. c–e, Quantification of total SNVs and small indels (1–10 bp) across species. f–h, Large structural variants (SVs > 6 kb) across species. i, Distribution of SV sizes shown as histograms with trend lines. j, Distribution of small (6–50 kb), medium (50–500 kb), and large (> 500 kb) deletions and SVs across species. Data are presented as mean ± SD. P values were calculated using one-way ANOVA with Tukey’s multiple comparisons (c–h) or chi-square test (j). The schematic summary was created with BioRender, Perelli, L. (2025) https://BioRender.com/i3xnjs4.
Extended Data Fig. 3 Bowhead whale fibroblasts show reduced mutagenesis after genotoxic stress.
a, ENU-induced mutational load measured by SMM-seq in fibroblasts from mouse (n = 6 cell lines), cow (n = 7), human (n = 8), and bowhead whale (n = 7). ΔSNV frequency was calculated for each line. Statistical significance was assessed using one-way ANOVA (two-sided, P = 0.0100). b, Mutational spectra showing the ENU-induced signature, including increased A > T transversions (orange) in treated mammalian cells. Same sample numbers as in a. c, HPRT mutagenesis assay after 3 h ENU treatment (n = 3 independent cell lines per species). Mutation frequencies were adjusted for plating efficiency. Data are mean ± SEM.; Welch’s two-sided t-test. d, HPRT mutagenesis assay after 3 h MNNG treatment (n = 3 independent cell lines per species), adjusted for plating efficiency. Data are mean ± SEM.; Welch’s two-sided t-test. e, HPRT mutagenesis assay after 3 h EMS treatment (n = 2 independent cell lines per species), adjusted for plating efficiency. No statistical tests were applied because n < 3. f, HPRT mutagenesis assay after 2 Gy γ-irradiation (n = 2 independent cell lines per species), adjusted for plating efficiency. No statistical tests were applied because n < 3.
Extended Data Fig. 4 DNA repair and PARP activation in bowhead whale and human cells.
a, Nucleotide excision repair (NER) efficiency measured by host cell reactivation of UV-irradiated luciferase reporter. Human, n = 2 biological replicates (6 measurements from independent experiments); whale, n = 2 biological replicates (3 measurements). Data are mean ± SD. b, Cyclobutane pyrimidine dimer (CPD) removal kinetics after 30 J/m² UVC in confluent fibroblasts (n = 2 biological replicates per species). c, Base excision repair (BER) efficiency measured by reactivation of luciferase plasmid treated with methylene blue and light (n = 3 biological replicates per species). Data are mean ± SD. d, e, Poly-ADP-ribosylation in bowhead whale fibroblasts after H2O2 (d) or γ-irradiation (e), assessed by Western blot. Experiments repeated three times with similar results. f, Baseline PARP activity in nuclear extracts (n = 3 biological replicates per species). Data are mean ± SD.; Welch’s two-sided t-test. g, Apoptosis/necrosis 48 h after 700 µM H2O2, measured by Annexin V/PI flow cytometry (n = 3 biological replicates per species across 4 independent experiments; data pooled). Data are mean ± SD.; unpaired two-sided t-test. h, DNA repair after oxidative stress by alkaline comet assay following 700 µM H2O2. Two fibroblast lines per species were analysed; each dot represents an individual cell, pooled for analysis. Data are mean ± SEM. i, Mismatch repair (MMR) measured by reactivation of a heteroduplex eGFP plasmid containing a G/T mismatch, co-transfected with DsRed control. Repair frequency calculated as GFP+/DsRed+ ratio (n = 3 biological replicates per species). Data are mean ± SD; Welch’s two-sided t-test.
Extended Data Fig. 5 NHEJ assays in bowhead whale and human fibroblasts.
a, Schematic of the NHEJ repair reporter construct. The GFP coding sequence, which includes an intron from the rat Pem1 gene, is interrupted by an adenoviral exon (Ad). Splicing of Ad into the GFP transcript renders it non-functional. The Ad sequence is flanked by inverted I-SceI recognition sites. Upon I-SceI-induced double-strand break (DSB) and successful repair by non-homologous end joining (NHEJ), a functional GFP gene is restored. SD, splice donor; SA, splice acceptor. Schematic created by the author (D.F.) in Adobe Illustrator. b, NHEJ frequency measured by extrachromosomal reporter assay. The I-SceI–linearized reporter plasmid was co-transfected with a DsRed control plasmid into fibroblasts. GFP+/DsRed+ ratios were quantified by flow cytometry three days later (n = 5 biological replicates; 3 individuals per species, assayed in two independent experiments). Data are mean ± SD; Welch’s two-sided t-test, P = 0.021. c, Representative confocal microscopy images of human and bowhead whale fibroblasts stained for γ-H2AX and 53BP1 at baseline (no treatment) and at 1–24 h after treatment with bleomycin (5 µg/mL). Scale bar: 10 µm. d, Representative images of binucleated human and bowhead whale fibroblasts containing micronuclei following exposure to 2 Gy γ-irradiation. Scale bar: 20 µm.
Extended Data Fig. 6 Sequencing of DNA DSB repair products in bowhead whale cells.
a, Schematic of possible repair outcomes following I-SceI cleavage with incompatible ends in the NHEJ reporter construct. Schematic created by the author (D.F.) in Adobe Illustrator. b, Allele plot from Sanger sequencing of integrated NHEJ reporter cassettes after I-SceI cleavage, showing repair diversity. c, NHEJ repair fidelity in extrachromosomal assay. The I-SceI–linearized reporter plasmid was co-transfected with a DsRed control into fibroblasts. After 3 days, genomic DNA was amplified, cloned, and sequenced; ≥100 clones were analysed per species. “Correct” indicates precise repair via annealing of two of four protruding nucleotides (see panel a). d, Time course of CRISPR-induced cleavage at the PTEN locus measured by digital droplet PCR (ddPCR). Cutting efficiency was determined from loss of PTEN amplicon signal relative to a single-copy ultraconserved element. Data are presented as mean ± 95% confidence interval (Poisson distribution, QuantaSoft). e, Absolute frequencies of repair alleles grouped by microhomology length (bp) at CRISPR-induced PTEN breaks, shown by species. Data are presented as mean ± SEM. f, Relative proportions of deletion alleles stratified by microhomology length, comparing species after CRISPR editing of PTEN. Data are presented as mean ± SEM.
Extended Data Fig. 7 Proteomic quantification of DNA repair proteins and CIRBP expression across species.
a, Heatmap of LC–MS quantification of DNA repair proteins in primary fibroblasts. Color intensity indicates log10-transformed ion intensities. b, CIRBP protein abundance in whole liver across mammalian species measured by LC–MS (n = 12 per species; 3 biological × 4 technical replicates). N.D., not detected. c, CIRBP protein abundance in nuclear liver extracts measured by LC–MS (n = 3 biological replicates per species). d, Western blot of CIRBP in fibroblasts from three individuals per species using monoclonal and polyclonal antibodies (mAb, pAb). Experiment repeated three times with similar results. e, Western blot of CIRBP in liver and other organs from bowhead whale and mouse. Experiment repeated three times with similar results. f, Western blot of CIRBP in fibroblasts from multiple mammalian species. Experiment repeated three times with similar results.
Extended Data Fig. 8 Transcriptomic analysis of DNA repair pathway genes across species.
Heatmap of relative gene expression levels for components of six major DNA repair pathways across species. Z-scores are scaled by row (gene), allowing comparison of expression patterns across species. Within each pathway, genes are ordered by decreasing expression in the bowhead whale. Genes that show higher expression in the bowhead whale compared to all three other species are labelled in red text to the right of the heatmap. Gene sets for each pathway were compiled from three sources: the MSigDB database, Gene Ontology (GO) annotations, and a curated list of human DNA repair genes from the Wood Laboratory at MD Anderson Cancer Center (www.mdanderson.org/documents/Labs/Wood-Laboratory/human-dna-repair-genes.html).
Extended Data Fig. 9 Bowhead whale CIRBP RNA and protein sequence confer higher expression levels compared to human sequence.
a, Amino acid sequence alignment between human and bowhead whale CIRBP using BLAST analysis. Bowhead whale specific variants are indicated. b, Structural models of human (left, pink) and bowhead whale (right, blue) CIRBP generated using SwissModel and AlphaFold. Side chains of amino acid residues that differ between species are shown, and the corresponding ribbon is highlighted in yellow in the whale model. All substitutions are located in the C-terminal disordered region, while the N-terminal RNA recognition motif (RRM) is conserved and structured. c, Evolution of bowhead whale CIRBP variants. Asterisks indicate the presence of bowhead whale-specific amino acid variants from. Variant positions are colour-coded according to their locations shown in a. d, Bowhead whale specific variants confer higher protein expression. Western blot analysis of CIRBP protein abundance in human cells overexpressing human CIRBP (hCIRBP), bowhead whale CIRBP (bwCIRBP), and reciprocal amino acid substitution mutants. H5BW is a human CIRBP with five bowhead whale substitutions. BW5H is a bowhead whale CIRBP with five human substitutions. Experiment repeated three times with similar results. e, Calculated codon adaptation index (CAI) values for CIRBP coding sequence variants.
Extended Data Fig. 10 CIRBP promotes DNA repair and survival following DNA damage in human fibroblasts.
a, Lentiviral overexpression of CIRBP variants enhances end-joining frequency in GFP-based NHEJ assays (n = 3 independent experiments). Western blot shows CIRBP expression in human and bowhead whale fibroblasts. Data are mean ± SD; Welch’s two-sided t-test. b, Frequency of insertions/deletions >20 bp in NHEJ reporter constructs from human fibroblasts ± bwCIRBP overexpression, quantified by Nanopore sequencing. c, Distribution of PTEN alleles in fibroblasts overexpressing luciferase or bwCIRBP after CRISPR-induced DSBs (n = 3 independent experiments). Data are mean ± SEM; significance indicated by asterisks (****P < 0.0001, two-way ANOVA with Fisher’s LSD). d, Same analysis as b, performed in bowhead whale fibroblasts transfected with control or CIRBP siRNAs. e, Hypothermia (33 °C) increases NHEJ frequency in primary fibroblasts (n = 3 independent experiments). Western blot shows CIRBP induction under hypothermia. Data are mean ± SD; Welch’s two-sided t-test. f, MTT survival assay after bleomycin in fibroblasts overexpressing bwCIRBP (n = 3 independent experiments). Data are mean ± SD; Welch’s two-sided t-test. g, MTT survival assay after etoposide in fibroblasts overexpressing bwCIRBP (n = 3 independent experiments). Data are mean ± SD; Welch’s two-sided t-test. h, Micronucleus formation after I-SceI cleavage. ≥150 binucleated cells were scored per replicate; bars show individual experiments. i, Chromosomal aberrations in fibroblasts ± CIRBP overexpression after 2 Gy γ-irradiation. 100 metaphase spreads were analysed per sample.
Extended Data Fig. 11 In vitro analysis of CIRBP’s role in DNA double-strand break (DSB) repair.
a, Subcellular localization of CIRBP in bowhead whale fibroblasts. In situ staining following CSK buffer pre-treatment ± RNase A. Representative confocal images are shown. b, CIRBP enrichment in the chromatin fraction after NCS-induced DSBs, assessed by Western blot. α-tubulin served as cytoplasmic marker. Experiment repeated three times with similar results. c, CIRBP accumulation in the chromatin fraction after γ-irradiation, analyzed ± RNase A. Experiment repeated three times with similar results. d, Left: label-free LC–MS analysis of recombinant CIRBP to assess purity. Right: Coomassie-stained SDS–PAGE gel of purified human CIRBP (Millipore) and bowhead whale CIRBP. e, CIRBP binding affinity for poly(ADP-ribose) (PAR) measured by fluorescence titration with labelled PAR polymers (n = 3 independent experiments). Data are mean ± SD; Welch’s two-sided t-test. f, Electrophoretic mobility shift assay (EMSA) of recombinant CIRBP with sheared chromatin from fibroblasts treated with UVC and H2O2. Experiment repeated three times with similar results. g, EMSA of CIRBP incubated with purified genomic DNA, RNA, or chromatin. Experiment repeated three times with similar results. h, CIRBP stimulates Ku DNA binding. A Cy5-labelled dsDNA substrate was incubated with recombinant Ku70/80 ± CIRBP. Free DNA and Ku–DNA complexes are indicated. Experiment repeated three times with similar results. i, CIRBP protects dsDNA from exonuclease degradation. A Cy5-labelled 20-bp dsDNA was incubated with CIRBP followed by T7 exonuclease digestion. Reactions were resolved on native PAGE. Experiment repeated three times with similar results.
Extended Data Fig. 12 Bowhead whale CIRBP inhibits anchorage-independent growth and tumour progression.
a, Representative images of colonies in soft agar formed by transformed human fibroblasts (hTERT, SV40 LT, SV40 ST, H-RasG12V) ± bwCIRBP overexpression after 23 days. Scale bar, 100 µm. b, Quantification of soft agar colonies after nitro blue tetrazolium staining, counted with ImageJ (n = 3 independent experiments). Data are mean ± SD; Welch’s two-sided t-test. c, Cell proliferation measured by MTT assay in transformed fibroblasts ± bwCIRBP overexpression. Data are mean ± SD. d, Cell viability measured by Trypan Blue exclusion (n = 3 independent experiments). Data are mean ± SD; Welch’s two-sided t-test. e, Western blot showing SV40 LT, H-RasG12V, p16, and p21 in transformed fibroblasts ± bwCIRBP overexpression. Experiment repeated three times with similar results. f, Chromosomal aberrations in transformed fibroblasts ± bwCIRBP overexpression. 100 metaphase spreads analyzed per sample. g, Volumetric tumour growth curves from xenografts of transformed fibroblasts ± bwCIRBP overexpression. Each curve represents one injection into nude mice. h, Frequency of large deletions ( > 6 kb) in xenograft tumours from fibroblasts overexpressing bwCIRBP or luciferase control (n = 3 tumors control, n = 4 tumours bwCIRBP). Data are mean ± SD; Welch’s two-sided t-test (P = 0.0541).
Extended Data Fig. 13 CIRBP overexpression extends lifespan and enhances stress resistance in Drosophila.
a, Western blot of CIRBP protein levels in adult flies exposed to increasing RU486 doses to induce GeneSwitch-driven transgene expression. Experiment was independently repeated three times with similar results. b, RU486 alone does not affect adult fly survival. GeneSwitch driver flies were crossed to the ywR background line, into which CIRBP constructs were also crossed. c, CIRBP overexpression increases adult survival (bwCIRBP, n = 1,357; hCIRBP, n = 1,730; controls in black). Survival curves shown; proportional hazards analysis in d. d, Lifespan analysis under low, medium, and high CIRBP induction (RU486 doses in panel a). Negative log hazard ratios indicate increased longevity relative to control. Data analysed using mixed-effects Cox proportional hazards models (coxme). e, CIRBP overexpression enhances survival after lethal X-ray irradiation (bwCIRBP, n = 83; hCIRBP, n = 88), except for a non-significant effect at low bwCIRBP induction. Data analysed using standard Cox proportional hazards models (coxph). f, Proportional hazards analysis of post-irradiation survival in females with low, medium, or high CIRBP induction. Negative log hazard ratios indicate increased survival compared to control. Data analysed using coxph models. All tests were two-sided; no adjustments for multiple comparisons were applied.
Supplementary information
Rights and permissions
Open Access This article is licensed under a Creative Commons Attribution-NonCommercial-NoDerivatives 4.0 International License, which permits any non-commercial use, sharing, distribution and reproduction in any medium or format, as long as you give appropriate credit to the original author(s) and the source, provide a link to the Creative Commons licence, and indicate if you modified the licensed material. You do not have permission under this licence to share adapted material derived from this article or parts of it. The images or other third party material in this article are included in the article’s Creative Commons licence, unless indicated otherwise in a credit line to the material. If material is not included in the article’s Creative Commons licence and your intended use is not permitted by statutory regulation or exceeds the permitted use, you will need to obtain permission directly from the copyright holder. To view a copy of this licence, visit http://creativecommons.org/licenses/by-nc-nd/4.0/.
About this article

Cite this article
Firsanov, D., Zacher, M., Tian, X. et al. Evidence for improved DNA repair in the long-lived bowhead whale. Nature 648, 717–725 (2025). https://doi.org/10.1038/s41586-025-09694-5
Received:
Accepted:
Published:
Version of record:
Issue date:
DOI: https://doi.org/10.1038/s41586-025-09694-5