Introduction
Measuring biomarkers, such as blood glucose levels and presence of inflammatory cytokines is essential for identifying the chemical, physical, or biological processes within the body1,2. Such information plays a crucial role in the early detection and prevention of serious diseases and in the management of lifestyle-related diseases, providing insights into personal health status and disease progression. Therefore, the continuous monitoring of these biomarkers is highly important, leading to the development of various detection techniques. Conventionally, biomarker detection has primarily been achieved through intermittent blood sampling, which allows for accurate measurements. However, it is not suitable for long-term continuous monitoring owing to its invasive nature3. Recently, the development of wearable devices has intensified, enabling the long-term, continuous monitoring of health-related biomarkers using sweat, saliva, tears, and interstitial fluid4,5,6,7,8. However, no method is able to monitor biomarkers within the body with high selectivity and sensitivity over long durations.
The cells in living organisms sense environmental stimuli, such as biomarkers and chemicals, with a high sensitivity and selectivity relative to artificial sensors9. Subsequently, the cells respond appropriately, such as expressing proper genes, to these stimuli and maintain the homoeostasis of the organism. The human body is composed of approximately 60 trillion terminally differentiated cells of approximately 200 types, each of which has a unique lifespan. The adult stem cells residing in each tissue can self-renew, differentiate into various cell types, and serve as a source of lost cells10. The properties of stem cells and progeny cells are observed to remain constant. Mutations, a modification of the genome that occurs in stem cells, are maintained after self-renewal and passed on to their progenies through individual lifespans, resulting in changes in their properties. Thus, living cells have the advantage of being highly sensitive, selective, and maintenance-free when compared with mechanical parts.
The skin, the organ with the large area of the body, acts as a barrier against harmful stimuli, such as UVA and dehydration, and as a sensor for multiple biomarkers in vivo. The skin is composed of the epidermis, dermis, and skin appendages. The epidermal structure is maintained by the skin keratinocyte stem cells (KSCs) sparsely present in the basal layer of epidermis, which is only 100 µm away from the skin surface11,12. During the differentiation of keratinocytes, the KSCs divide vertically; the progeny cells push themselves upwards linearly as they proliferate and differentiate, and finally, the progeny die and fall off from the skin surface in approximately 10 and 50 days in mice and humans, respectively13,14. Therefore, when viewed from the body surface, differentiated cells derived from a single stem cell have a columnar structure. Because of the position of the KSCs and their columnar differentiation, changes in the KSCs and their progenies can be easily detected from the surface of the body, compared to that in other adult stem cells.
This study proposes a biomarker monitoring method that utilises living KSCs as sensors and displays simultaneously. They involve genetically modified living cells that can detect signals through membrane proteins and produce fluorescent proteins via cellular signal transduction. This approach allows for the targeting of specific biomarkers with high selectivity owing to the ability of membrane proteins to highly and strictly recognise the substances. The signal is subsequently amplified through multiple stages of transcription and translation within the cell, enabling the sensitive detection of these substances. By creating tissue-engineered skin from KSCs and transplanting this skin, it is possible to monitor changes in the target substances within the body. Furthermore, by transplanting the skin for integration into the body, continuous monitoring of biomarkers can be achieved over the long term, as the cells within the transplanted skin undergo natural turnover by engineered KSCs15. This sensor, capable of displaying internal information externally using living cells, has been named the “Living Sensor Display” (Fig. 1a). Here, we focus on the inflammatory cytokine tumour necrosis factor-α (TNF-α) as the target biomarker. To detect TNF-α, we first genetically engineered human epidermal keratinocytes (NHEK), including KSCs to express NF-κB-EGFP, which is activated by TNF-α stimulation16,17. Next, we used these cells to construct a tissue-engineered skin model and verify its concentration-dependent responsiveness to TNF-α stimulation. Furthermore, we transplanted the skin model into mice and observed changes in the fluorescence intensity of the transplanted skin after the administration of an inflammatory agent. Using these methods, we demonstrated that the Living Sensor Display is an effective technique for measuring the biomarkers within the body.

a Conceptual illustration of the “Living Sensor Display” and b schematic diagram of the Nuclear Factor-κB (NF-κB) pathway. c The Y-axis represents the median fluorescence intensity of EGFP measured by flow cytometry. The X-axis indicates different constructs (1–5), each with two conditions: “-uns.” for unstimulated and “-sti.” for TNF-α-stimulated cells. “Uninfect.” indicates cells without transgene introduction. RE stands for responsible element. Data are presented as median ± SD from n = 3 biologically independent cell culture experiments d Bright-field microscopy images before transfection and fluorescence microscopy images at 12 and 24 h after the addition of TNF-α at 0, 0.2, 20 ng/mL to transgenic cells with No.4 construct shown in (c) (Scale bar = 200 µm). e The time course of fluorescence intensity every hour after the addition of 0, 0.2, and 20 ng/mL TNF-α (Data are presented as mean ± standard deviation, n = 3 biologically independent cell culture experiments, each performed with independently prepared transgenic NHEKs; blue for 0 ng/mL, red for 0.2 ng/mL, and green for 20 ng/mL).
Results
Evaluation of NHEK cells responding to inflammatory cytokines
The nuclear factor-κB (NF-κB) pathway is involved in multiple biological processes, including innate immunity, adaptive immunity, inflammation, stress response, B cell development, and lymphoid tissue formation18. In this pathway, several ligands, including the inflammatory cytokine TNF-α, bind to its receptors resulting in the activation and nuclear transfer of NF-κB, a protein complex (Fig. 1b). Subsequently, NF-κB recognises specific nucleotide sequences, called the responsible element (RE) to transcribe downstream target genes. To generate the Living Sensor Display, we aimed to generate genetically engineered KSCs that have transgene fused with RE and enhanced green fluorescent protein (EGFP) as a readout signal (NF-κB-EGFP NHEK cells). In general, the greater the number of RE and fluorescent protein genes, the higher the fluorescence intensity. Therefore, we investigated the numbers of RE and EGFP genes. To this end, we generated several vector constructs containing different numbers of RE and EGFP genes and transfected them into NHEKs using a lentiviral system. Next, we stimulated these transgenic cells with 20 ng/mL TNF-α for 16 h and analysed the fluorescence intensity by FACS, and found that the construct composed of three repeats of RE and two copies of EGFP gene expressed the highest fluorescence intensity (Figs. 1c and S1a). Therefore, this construct was used in this study.
To assess the expression of EGFP in response to the inflammatory cytokine TNF-α in NHEKs genetically modified with NF-κB-EGFP, we added TNF-α to the culture medium at concentrations of 0 ng/mL, 0.2 ng/mL, and 20 ng/mL, and examined the temporal changes. Bright-field images before the addition of TNF-α and fluorescence images of EGFP before addition and 12 and 24 h after addition are shown in Figs. 1d and S1b. At 0 ng/mL, almost no increase in fluorescence was observed after 12 h or 24 h. Conversely, in cells treated with TNF-α, an increase in the fluorescence intensity from EGFP was observed after 12 h, and further increased after 24 h when compared to that at 12 h. Additionally, the fluorescence was stronger and EGFP was more prominently expressed at both 12 and 24 h at 20 ng/mL compared to that observed at 0.2 ng/mL. The fluorescence intensities measured by a plate reader every hour for 48 h at TNF-α concentrations of 0 ng/mL, 0.2 ng/mL, and 20 ng/mL are shown in Fig. 1e, respectively. Similar to the fluorescence images, the fluorescence intensity increased significantly from 0 ng/mL to 20 ng/mL and from 0.2 ng/mL to 20 ng/mL at 24 h after TNF-α stimulation (Fig. S1b, c), with a steeper increase in the intensity at higher concentrations, indicating that genetically modified NF-κB-EGFP NHEK cells respond to the inflammatory cytokine TNF-α by producing EGFP, leading to an increase in the fluorescence intensity proportional to the TNF-α concentration, but detection below 0.02 ng/ml falls outside the dynamic range (Fig. S1d).
To investigate the cross-selectivity of NHEKs genetically modified with NF-κB-EGFP, we examined the response not only to TNF-α but also to IL-1β, which is involved in the NF-κB signalling pathway, and IL-2 and LPS, which are not directly involved in the NF-κB signalling pathway and lack membrane receptors. These factors were added to the culture medium at a concentration of 20 ng/mL, and changes in fluorescence intensity were observed (Fig. S2a–d). As a result, an increase in fluorescence intensity similar to that seen with TNF-α was confirmed for IL-1β. However, no increase in fluorescence intensity was observed for IL-2 or LPS. These results demonstrate that NHEKs genetically modified with NF-κB-EGFP exhibit high selectivity, responding specifically to target molecules associated with receptors involved in the NF-κB signalling pathway, while showing no cross-reactivity to IL-2 or LPS.
To verify whether NHEKs genetically modified with NF‑κB‑EGFP respond in a human immune environment, we performed co‑culture experiments using a culture insert system with NHEK cells and human‑derived Peripheral Blood Mononuclear Cells (PBMCs). A culture inserts containing 1 × 10⁶ PBMCs was placed over the NHEK cell layer. In another condition, a culture insert containing 1 × 10⁶ PBMCs activated by Lipopolysaccharide (LPS) (final concentration: 10 µg/mL in the well) was used. Changes in fluorescence intensity were then monitored (Fig. S3a, b). As a result, fluorescence intensity remained unchanged with PBMCs alone; however, in the LPS-stimulated condition, it increased after 60 h. These results suggest that NHEKs exhibit fluorescence responses in the presence of PBMCs, particularly under inflammatory conditions induced by LPS stimulation. Although this system does not fully represent a complete human immune system, it is considered to mimic the early stages of acute inflammatory responses, implying that in practical applications, fluorescence responses to cytokines can be observed in humans.
Evaluation of tissue-engineered skin responsive to TNF-α stimulation
To verify whether NF-κB-EGFP NHEK cells have the ability to construct proper skin structure and if so whether tissue-engineered skin is responsive to TNF-α concentrations, we generated tissue-engineered skin by culturing genetically modified NHEK cells and normal human dermal fibroblasts on a culture insert at an air–liquid interface (Fig. 2a). The tissue-engineered skin was circular with a diameter of approximately 20–25 mm. The cross-sectional haematoxylin and eosin (HE) images of the entire tissue-engineered skin are shown in Fig. 2b. The thickness of the tissue-engineered skin was approximately 100 µm to the centre, which thinner compared to actual human skin. Enlarged HE and immunostained fluorescence images of the tissue-engineered skin sections from the marked area are shown in Fig. 2c. The epidermal basal layer marker cytokeratin 14 (CK14)19 was observed on the epidermal part of the tissue-engineered skin, Vimentin20, a fibroblast marker, was found from the bottom to the centre of the tissue-engineered skin, and Type IV collagen, a marker for the basal layer21, was observed between CK14 positive cells and Vimentin-positive cells, indicating the formation of a layer of cells similar to that seen in natural skin across the entire thickness of the tissue-engineered skin. These results suggest that tissue-engineered skin can be constructed using genetically modified NHEK cells. Further, to check whether the TNF-α responsiveness observed in the NHEK was retained after forming tissue-engineered skin, TNF-α was added to the culture medium of the tissue-engineered skin, and the fluorescence response observed in 2D cell culture was also seen after forming 3D tissue-engineered skin. The images of the immunostained sections of tissue-engineered skin fixed at 24 h after the addition of TNF-α at concentrations of 0 and 20 ng/mL are shown in Fig. 2d, e, respectively. Although the difference was small, the EGFP fluorescence in the epidermal layer was stronger at a concentration of 20 ng/mL. Additionally, the fluorescence intensity measured by a plate reader every hour for 48 h at TNF-α concentrations of 0 ng/mL and 20 ng/mL are shown in Fig. 2f. The fluorescence intensity increased significantly from 0 ng/mL to 20 ng/mL at 17 h, peaking at approximately 17 h before gradually decreasing (Fig. S4a). The fluorescence intensity changes with various TNF‑α concentrations were observed in both cultured cells and tissue-engineered skin, indicating that both systems exhibit a dynamic range from 0 to 20 ng/mL (Figs. S1d, S4b). These results suggest that the tissue-engineered skin retained the TNF-α responsiveness observed in cells, indicating successful construction of tissue-engineered skin responsive to TNF-α stimulation.
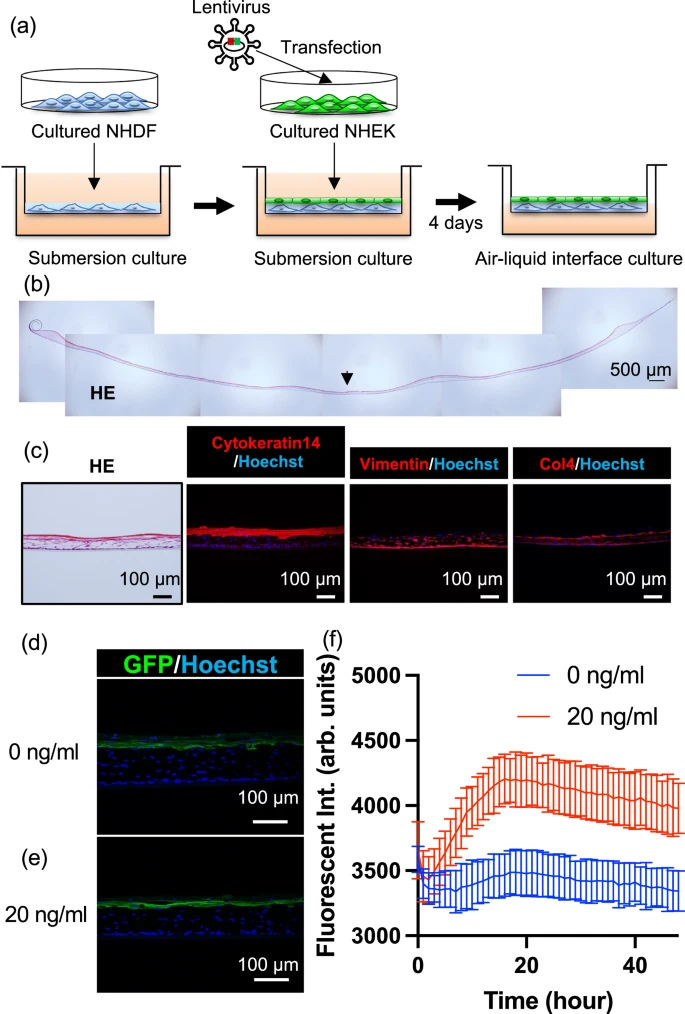
a Schematic diagram of the fabrication process of TNF-α responsive tissue-engineered skin, b Haematoxylin and Eosin (HE) stained overview image of the fabricated tissue-engineered skin (Scale bar is 500 µm). Representative of three biologically independent experiments with similar results. c Section images of tissue-engineered skin, showing HE staining and immunostaining for CK14, Vimentin, and Type IV Collagen. Representative of three biologically independent experiments with similar results. d, e Section images of tissue-engineered skin at 24 h after the addition of 0, 20 ng/mL concentrations of TNF-α, respectively. f Time course of fluorescence intensity every hour after the addition of 0, 20 ng/mL concentrations of TNF-α, respectively (Data are presented as mean ± standard deviation, n = 3 biologically independent tissue-engineered skin constructs, each generated from independently prepared NHEKs and fibroblasts; blue for 0 ng/mL, and red for 20 ng/mL).
Compared to the data obtained from cultured cells, the dynamic range relative to the background in tissue-engineered skin is smaller. This is likely because the fluorescence measurements were conducted through a culture insert and scattering from the culture insert and the tissue-engineered skin may have influenced the results.
Transplantation of TNF-α Responsive Tissue-engineered Skin onto Mice
Next, to confirm whether the TNF-α responsive tissue-engineered skin could stably engraft onto mice, we transplanted the tissue-engineered skin onto SCID Hairless Outbred (SHO) mice (Fig. 3a). Wound healing was observed (Fig. S5a–d). HE-stained images of the skin sections removed from around the transplantation site after four weeks are shown in Fig. 3b, with parts 1 and 2 indicating the remains of the transplant scar, and part 3 indicating the original skin of the mouse. Enlarged HE and immunostained images of each part of the removed skin are shown in Fig. 3c. Since the tissue-engineered skin used human-derived NHEK and fibroblasts, immunostaining for human-specific mitochondria in red revealed its expression in the epidermal part of location i, but not in location ii, indicating that the transplanted NHEK-derived tissue-engineered skin was engrafted in part i, whereas part ii healed with mouse tissue. No adipose tissue was observed beneath the transplanted scar; additionally, it was confirmed that the skin was engrafted on top of the fascia. EGFP expression was also confirmed in areas where human mitochondria were observed, which may have been due to an immune response after transplantation. Notably, a structure similar to the human epidermal papillary layer, which was not observed in mouse skin, was observed at the transplanted site. The TNF-α responsive tissue-engineered skin engrafted onto SHO mice was observed to differentiate into more mature human-like skin. Furthermore, to investigate the inflammatory response state at three and four weeks post-transplantation, immunostaining for the neutrophil marker Ly6g, pan-macrophage marker F4/80, M1 macrophage marker CD86, and M2 macrophage marker CD163 was performed. The infiltration of inflammatory cell groups was observed to have subsided at 3 weeks after transplantation (Fig. S6) compared to 4 weeks after transplantation (Fig. S7), indicating that at least 4 weeks should be waited before fluorescence observation can be performed.

a A snapshot of live imaging of tissue-engineered skin grafted mouse. The transplantation mouse freely moving after the administration of TNF-α. See also supplementary Movie 1. b Overall view of a Haematoxylin and Eosin (HE) stained skin section taken from around the transplantation site at 4 weeks after transplantation of the tissue-engineered skin. Representative of three biologically independent transplantation experiments with similar results. c Magnified view of the HE stained overall image, and immunostaining images for human mitochondria and GFP at the magnified area (Scale bar = 100 µm). The tissue-engineered skin derived from humans had taken root in a shape similar to a papilla structure.
These findings confirm that, while EGFP cells remain at the transplantation site, the inflammatory response caused by transplantation subsides within approximately four weeks, suggesting that fluorescence observation should not be initiated until at least four weeks have passed. Additionally, to observe the size change of the transplanted tissue-engineered skin post-transplantation, EGFP autofluorescence was photographed over time, and the area of observed autofluorescence was calculated through image processing (Fig. S8). The observation system was constructed using a commercially available camera and a parallel light source to keep the optical path length constant, and bright-field and fluorescent images were captured (Fig. S9). The size of the transplantation site tended to decrease up to 30 days post-transplantation; however, there was hardly any change in size over 200 days thereafter, suggesting that once the tissue-engineered skin was engrafted onto the mouse, it maintained a constant size and location. These results suggest that transplanted tissue-engineered skin can be quantitatively assessed for changes in the fluorescence intensity normalised to the area of the transplant site.
TNF-α responsiveness of the transplanted tissue-engineered skin
To verify whether the engrafted tissue-engineered skin in mice could still respond to TNF-α and produce EGFP, a TNF-α solution was administered, and the change in the fluorescence intensity was examined. Bright-field and fluorescence images before administration in mice at more than two months post-transplantation are shown in Fig. 4a, b, respectively, confirming the near disappearance of EGFP fluorescence (Fig. S10). Next, 20 µL of 100 µg/mL TNF-α solution was subcutaneously injected near the transplant site. Day 0 was considered the first day of administration. On day 1 post-administration, an increase in the fluorescence intensity was observed (Fig. 4c), peaking on day 1 or 2 (Fig. 4f). Subsequently, the fluorescence intensity gradually decreased. Once the fluorescence was sufficiently reduced (Fig. 4d, g), 20 µL of TNF-α solution was again subcutaneously injected near the transplant site on day 28. One day after the second administration, on day 29, the fluorescence intensity increased again (Fig. 4e) and the fluorescence intensity was significantly higher than that before 2nd administration (Fig. 4i). The engrafted tissue-engineered skin similarly responded to TNF-α by producing EGFP, showing that the tissue-engineered skin can be repeatedly detected (Fig. 4h). Subsequently, to check the state of the mouse skin one day after TNF-α administration, an observation of the tissue section was conducted. An overall image of the immunostained skin tissue of the mice post-transplantation is shown in Fig. 4j. Strong green EGFP fluorescence was observed only in the transplanted part of the tissue-engineered skin with red-stained human mitochondria-positive papillary structures; neither human mitochondria nor EGFP were observed outside the transplant site (Fig. 4k). Additionally, an investigation of the inflammatory response state through immunostaining (Fig. S11) revealed numerous neutrophils, mature macrophages, M1 macrophages, and M2 macrophages at the transplant site and in normal tissue parts, indicating that the subcutaneous administration of TNF-α elicited an inflammatory response around the transplanted tissue-engineered skin. These results confirm that the engrafted tissue-engineered skin alone responded to TNF-α stimulation.

a Bright-field image of the engrafted tissue-engineered skin before TNF-α stimulation, more than two months post-transplantation. b Fluorescence image of the engrafted tissue-engineered skin before TNF-α administration, c 1 day after administration, d 28 days after administration, e 1 day after the re-administration of TNF-α on the 29th day post-initial administration. f Time course of fluorescence intensity calculated from image analysis of the tissue-engineered skin. The vertical dotted lines indicate the time points of fluorescence observation, and the downward‑pointing triangles indicate the timing of TNF-α administration. g Comparison of fluorescence intensities at 1 day after administration and 28 days after administration. Data are presented as mean ± SD from n = 5 biologically independent mice. P values = 0.0035. The statistical analysis was performed using t-tests (two-tailed). **p < 0.01. h Comparison of fluorescence intensities at 1 day after administration and 29 days after administration. Data are presented as mean ± SD from n = 5 biologically independent mice. i Comparison of fluorescence intensities at 28 days after administration and 29 days after re-administration. Data are presented as mean ± SD from n = 5 biologically independent mice. P values = 0.0115. The statistical analysis was performed using t-tests (two-tailed). *p < 0.05. j Immunostaining image merged for human mitochondria and GFP from a skin section taken from around the engrafted skin at 1 day after TNF-α administration. Representative of three biologically independent experiments with similar results. k Magnified immunostaining images merged for human mitochondria and GFP at the magnified area.
Detection of inflammatory responses in vivo
To examine whether tissue-engineered skin can monitor the inflammatory situation in addition to the presence of TNF-α, substances capable of inducing inflammation in the body were administered to transplanted mice, and changes in the fluorescence intensity were observed. LPS is the major component of the outer membrane of Gram-negative bacteria and is known to induce inflammatory responses, including the activation of macrophages22. In the 2D culture of NF-κB-EGFP NHEK cells, no increase in fluorescence was observed after 48 h post-stimulation by 20 ng/mL LPS, suggesting that LPS itself does not activate NF-κB signalling in these cells (Fig. S2d). To examine whether NF-κB-EGFP NHEK cell can monitor the inflammatory situation in vivo, 20 µL of LPS solution at a concentration of 1 mg/mL was administered intraperitoneally to the tissue-engineered skin-grafted mice (Fig. 5a–e). The response to LPS was slower compared to that of TNF-α, with 2 mice showing an increase in fluorescence intensity on day 2, while 3 mice showed a decrease (Fig. 5f). This could have occurred due to subsiding of the inflammatory reaction caused by the transplant. Next, to examine whether the tissue-engineered skin can repeatedly respond to LPS administration, we again subcutaneously injected 20 µL of 1 mg/mL LPS solution near the transplant site on day 7 after the first administration. After the second administration, a significant increase in the fluorescence intensity was observed in all individuals on day 2 (Fig. 5g, h). Furthermore, LPS solution (0.1 mg/mL) was administered via the tail vein at a dose of 0.1 mg/kg on Day 0 and Day 7. As a result, fluorescence intensity increased (Fig. S2a–e) from the day following administration, with a significant increase on the first day post-administration compared to baseline (Fig. S12f). By the seventh day post-administration, fluorescence had subsided; however, upon re-administration, fluorescence increased again 1 day later. On Day 8, fluorescence intensity was significantly higher than before the Day 7 administration (Fig. S2g). These results indicate that tissue-engineered skin can be used to monitor the inflammatory state of the body and increase the fluorescence intensity in response to inflammatory stimulation. To check the state of mouse skin on day 9 after the first LPS administration and 2 days after the second LPS administration, the tissue sections were observed. An image of an immunostained skin tissue section of a mouse is shown in Fig. 5i. Similar to TNF-α administration, a strong fluorescence of green EGFP overlapping with red-stained human mitochondria-positive papillary structures was observed only in the transplanted part of the tissue-engineered skin. These results indicate that the engrafted tissue-engineered skin responds to LPS-induced inflammation by producing EGFP. Additionally, an investigation of the inflammatory response state on day 9 through immunostaining (Figs. 5j and S13) showed that numerous neutrophils and mature macrophages were observed at the transplant site and in normal tissue parts, while fewer M1 and M2 macrophages were observed compared to during TNF-α administration, as consistent with the delayed and low fluorescence intensity after LPS administration compared to TNF-α injection. These results indicate that the NF-κB-EGFP NHEK cells in tissue-engineered skin can indirectly monitor the inflammatory situation via immune cells, such as macrophages.

a Bright-field images of the engrafted tissue-engineered skin before LPS stimulation, more than 2 months post-transplantation. b Fluorescence images of the engrafted tissue-engineered skin before LPS administration, c 2 days after the intraperitoneal administration of LPS, d 7 days after administration, e Fluorescence image of the engrafted tissue-engineered skin at 2 days after subcutaneous administration of LPS on the 9th day post-initial administration. f Time course of fluorescence intensity calculated from the image analysis of the tissue-engineered skin. The vertical dotted lines indicate the time points of fluorescence observation, and the downward‑pointing triangles indicate the timing of LPS administration. g Comparison of fluorescence intensities at 7 days and 9 days after administration. Data are presented as mean ± SD from n = 5 biologically independent mice. p = 0.00000056. The statistical analysis was performed using t-tests (two-tailed). ***p < 0.001. h Comparison of fluorescence intensities at 2 days and 7 days after administration. The statistical analysis was performed using t-tests (two-tailed). Data are presented as mean ± SD from n = 5 biologically independent mice. p = 0.3898 i Immunostaining image merged for human mitochondria and GFP from a skin section taken from around the engrafted skin at 9 days after LPS administration. Representative of three independent experiments with similar results. j Fluorescence image confirming the localisation of inflammatory cells positive for Ly6g and F4/80 in the magnified area. Representative of three independent experiments with similar results.
Discussion
We demonstrated the ability to continuously monitor inflammatory cytokines in vivo by transplanting tissue-engineered skin into mice. This skin was constructed from NHEK cells that produce EGFP upon stimulation by inflammatory cytokines, such as TNF-α and IL-1β, secreted from human immune cells into mice. The fluorescent protein expressed within the transplanted cells emitted high intensity light that was visible from outside the skin (Fig. 3a). Furthermore, the internal movement and differentiation of cells within the skin due to cellular turnover allows for long-term continuous monitoring without altering the illuminated area.
The tissues and organs are maintained autonomously through appropriate self-renewal and differentiation of adult stem cells. Adult tissue stem cells are tightly regulated both endogenously and extrinsically by the surrounding environment, called niche. In the human skin, epithelial stem cells are located at the bottom of ridges and may act as a niche for the papillary structure of the epidermis23. In the current study, we unexpectedly observed maturation of tissue-engineered skin after transplantation in SHO mice. The epidermis of the tissue-engineered skin before transplantation was approximately 20 µm thick, whereas the epidermis of the engrafted tissue reached a thickness of approximately 100 µm, comparable to the human epidermis. Additionally, unexpectedly, the tissue-engineered skin displayed papillary structures characteristic of human skin that were not found in mouse skin. Moreover, the area of the skin showing a fluorescent response hardly changed and was maintained for over 200 days after engraftment. Generally, the epidermal stem cells in the basal layer of the skin move vertically and differentiate, eventually reaching the stratum corneum, shedding, and undergoing turnover. These findings indicate that the tissue-engineered skin matures after transplantation, transgenic epidermal stem cells are sustained at the bottom of the papillary ridge, and function as a Living Sensor Display for the long term without requiring any maintenance.
In general, the immune response is largely divided into two modes: the innate and adaptive immune responses, which work together to protect against pathogens. The innate immune response is a quick reaction against pathogens and is achieved by multiple components, including physical barriers, such as the skin and mucous membranes; immune cells, such as macrophages; and soluble factors, such as cytokines. The adaptive immune response is slower than the innate immune response and is characterised by the ability to memorise information about pathogens that have invaded once and to learn to respond quickly and strongly when invaded again. Lymphocytes, such as the T and B cells, play an important role in quick and strong responses. Generally, SCID mice, which we used in the current study, lack mature B and T lymphocytes and are considered not to show adaptive immune response. However, in our experiments, whether we administered LPS intraperitoneally initially followed by a subcutaneous challenge one week later, or administered LPS intravenously in two doses separated by one week, the second stimulation induced a markedly stronger inflammatory response compared to the first stimulation (Fig. S8). A previous study reported that 2–23% of SCID mice produce functional B and T cells between 3 and 9 months of age, which is known as leakiness24. Our observation that a stronger GFP signal was observed after the re-administration of LPS might be due to the adaptive immune response. These results indicate that tissue-engineered skin can detect both innate and adaptive immune responses, which normally occur in the living body. Additionally, the pre-administration of multiple doses may be effective in eliminating individual variations (Fig. S14) and achieving more stable long-term monitoring.
Through this work, we demonstrated the effectiveness of detecting substances within the body with high sensitivity, which has been challenging. TNF-α, for example, is a component present in very minute amounts in the body, ranging from a few hundred pg/mL to tens of ng/mL during inflammation, making it challenging to detect such minute components. Traditionally, antigen-antibody reactions like ELISA or mass spectrometry, such as LC-MS/MS have been the main detection methods. Both require whole blood because of the difficulty in collecting sufficient volumes of the interstitial fluid, necessitating preprocessing before measurement. Moreover, TNF-α has a very short half-life of approximately 15 min in the body, further necessitating rapid processing. Here, our proposed method using living cells allows for amplification through multistep reactions in a short time, captured as changes in fluorescence intensity. By changing the receptors, it is conceivable to detect various target substances similarly in the future. We also found that even small-sized patches can exhibit responsiveness; however, as the transplantation area decreases, the total fluorescence signal becomes weaker, leading to a reduced detection limit.
Unlike conventional wearable sensor technologies, this method enables the long-term, real-time acquisition of minute biochemical signals, with potential applications ranging from health management and early disease detection to veterinary medicine and livestock monitoring. The target biological reactions include inflammatory markers, hypoxic and oxidative stress, and hormones, among others. This system is expected to have broad applications beyond human healthcare, such as improving the health management of pets that cannot communicate their medical conditions. However, several challenges remain before widespread implementation. While SHO mice lack mature B and T lymphocytes, the observed innate immune responses (Fig. 5j) suggest that the transplanted tissue remains biologically active. Given reports of EGFP immunogenicity25, future studies using fully immune-competent models will be essential. Potential strategies include using autologous cells or alternative reporter proteins with lower immunogenicity to ensure broader applicability. In addition to biological limitations, societal acceptance may also pose a challenge. Strategies to control the spread of genetically modified organisms may be necessary; however, applications targeting non-human subjects, such as veterinary medicine and livestock health, may be more readily accepted.
In conclusion, our Living Sensor Display leverages the characteristics of receptors to detect unstable and minute biomarkers in vivo with high sensitivity and continuity. By further investigating their invasiveness and safety, engineered cells can be implanted into the body, paving the way for a paradigm in healthcare that includes long-term disease monitoring and health management through early detection.
Methods
Lentivirus vector construction
A sequence containing NF-κB -RE-miniP-EGFP was generated by PCR amplification from pNL3.2 NF-κB -RE plasmid (Promega, USA) and pEGFP-N1 plasmid (Addgene, USA). NF-κB -RE-miniP-EGFP sequence was amplified by PCR from pNL3.2 NF-κB EGFP plasmid (Promega, USA) and was inserted in the ClaI-NotI site of the pLVSIN-CMV-neo vector (Takara, Japan). The RE sequence between the ClaI and SfiI sites of this construct was replaced with a sequence that was repeated RE sequence three times (pNL3.2 NF-κB -REx3). Simultaneously, the EGFP sequence following IRES2 sequence was inserted after EGFP sequence of NF-κB -RE-miniP-EGFP plasmid (pNL3.2 NF-κB -EGFx2). Subsequently, two repeats of EGFP were extracted from pNL3.2 NF-κB -EGFx2 and inserted into pNL3.2 NF-κB -REx3 resulting in the plasmid containing three repeats of RE and two repeats of EGFP (pNL3.2 NF-κB -REx3 EGFPx2).
Flow cytometry data were analyzed using FlowJo software (v10.10.0, FlowJo LLC). After doublet exclusion, SYTOX Blue-negative cells were defined as live cells. GFP fluorescence was quantified as median fluorescence intensity (MFI). For visual comparison across conditions, fluorescence histograms were normalised to mode, with the highest frequency set to 100% on the y-axis.
Cell culture and transfection
Normal human epidermal keratinocytes (NHEKs:KK-4009) were purchased from KURABO Industries LTD (Osaka, Japan). The NHEKs were maintained in HuMedia-KG2 (KURABO) at 37 °C. Normal human dermal fibroblasts (NHDFs:KF-4109) were purchased from KURABO and were maintained in Dulbecco’s modified Eagle’s medium (FUJIFILM Wako Pure Chemical Corporation, Osaka, JAPAN) that was supplemented with 10% foetal bovine serum (Biowest, Rue du Vieux Bour, Nuaillé, France), 100 units mL−1 penicillin, 100 μg mL−1 streptomycin (Thermo Fisher Scientific, MA, USA), and 10 ng ml−1 bFGF (PeproTech, NJ, USA) at 37 °C. The virus solution was produced by co-transfection of the lentivirus vector and lentiviral high-titre packaging mix into Lenti-X 293 T cells using TransIT-293 Transfection Reagent (TAKARA BIO Inc., Japan). Transfection was performed by incubating the NHEK cells in a 10 IFU/cell virus solution for 16 h.
In vitro fluorescence measurement
Normal Human Epidermal Keratinocytes (NHEKs)(KURABO, Japan) were first suspended in HuMedia (KURABO, Japan) at a concentration of 2.4 × 10⁵ cells/mL. The cell suspension was then aliquoted into a 12-well plate and 1 mL of the suspension was added to each well. The plate was incubated overnight at 37 °C in an environment containing 5% CO2 and 20% O2, providing optimal conditions for cell growth and viability. Following to 16 h of incubation, the original medium in each well was replaced with 900 µL of fresh HuMedia supplemented with Polybrene at a final concentration of 8.9 µg/mL. After 24 h after the start of the culture, cells from the three wells were harvested to measure the cell counts and assess the proliferation and condition of the cells before proceeding with viral infection. For the infection process, the virus is diluted with HuMedia in the viral solution to a total volume of 50 μL, achieving a concentration of 10 IFU/cell. The diluted viral solution was added to each well. After 16 h of viral exposure, the medium containing Polybrene was discarded, and each well was replenished with 900 µL of Polybrene-free HuMedia. A day after replacing the medium, TNF-α was added at a concentration ten times higher than the final desired concentration, with 100 µL added to each well. The response of NHEK to the treatments was monitored using an imaging reader (BioTek Citation 5). The cells were observed using brightfield microscopy, fluorescence microscopy, and fluorescence intensity measurements every hour under the conditions of 37 °C, 5% CO2, and 20% O2.
Reconstruction of tissue-engineered skin
A total of 2 × 10⁶ normal human dermal fibroblasts (NHDFs) (2 × 10⁶) were resuspended in 0.6 mL of 4 mg/mL bovine dermis derived native collagen solution (KOKEN CO. Ltd., Japan) mixed with 1× DMEM (Thermo Fisher Scientific, USA), 10 mM HEPES (Dojindo, Japan), 10 mM NaHCO3 (FUJIFILM Wako Pure Chemical Corporation). The cell suspensions were plated in 6-well cell culture inserts (Corning, USA). After solidification of the collagen solution, transgenic NHEKs were seeded at a density of 2.0 × 10⁶ cells on dermal equivalents. The skin equivalents were cultured under submersion conditions for 4 days in a humidified atmosphere at 37 °C with 12.5% O2 and then exposed to the air–liquid interface in a humidified atmosphere. On day 6 of the culture, the percentage of O2 increased to 20%. The medium for culturing skin equivalents consisted of Advanced DMEM/F12 (Thermo Fisher Scientific, USA) supplemented with 10% FBS, 1% penicillin/streptomycin (Thermo Fisher Scientific, USA), 1x GlutaMax Supplement (Thermo Fisher Scientific, USA), 1x HEPES (Thermo Fisher Scientific, USA), 1x N2 supplement (Thermo Fisher Scientific, USA), 1x B-27 supplement (Thermo Fisher Scientific, USA), 50 ng/mL Noggin (PEPRO TECH, USA), 50 ng/mL FGF7 (R&D Systems, USA), 50 ng/mL FGF10 (R&D Systems, USA), and 50 ng/mL SAG (Enzo Life Science, USA).
Histochemical analysis and immunohistochemistry
The immunostaining procedure commenced with delineation of the tissue section perimeter on the glass slide using a Liquid Blocker, ensuring that any OCT compound residues on the slide edges were removed with a moistened Kimwipe. Subsequently, the slides were immersed in PBS for three 5-min washes to ensure thorough rinsing. The tissue sections were then treated with 0.1% Triton X-100 solution for 15 min in a moisture chamber to facilitate permeabilisation. After two 5-min PBS washes, the sections were incubated in a 3% BSA solution for 20 min to 2 h within the moisture chamber to block the non-specific binding sites.
Following the removal of the BSA solution, the tissue sections were incubated with the diluted primary antibody: Cytokeratin 14 Polyclonal antibody (Proteintech・10143-1-AP,CK14), Anti-Collagen IV antibody(abcam・ab6586, Col4),Vimentin (D21H3) XP Rabbit mAb (CST 5741S, Vimentin), Anti-GFP (Rat IgG2a) Monoclonal (GF090R) CC (nacalali,04404-84,GFP), Anti-GFP Antibody (abcam・ab290, GFP), Purified Rat Anti-Mouse CD31 (BD pharmingen・553370, CD31), Anti-Mitochondria antibody (Merck (Sigma)・MAB1273, Human Mitochondria), Rat Anti-Mouse F4/80 antibody (Bio-Rad・MCA497GA, F4/80), Anti-CD86 antibody (Cell Signalling Technology・ #19589S, CD86) Anti-CD163 antibody (abcam・ab182422, CD163), Anti-Ly6g antibody (abcam・ab25377, Ly6g), overnight at 4 °C within the moisture chamber. The next day, the excess primary antibody was washed off with three 5-min PBS washes. Fluorescent-labelled secondary antibodies were subsequently applied, and the sections were incubated for approximately 1.5 h in a light-protected moisture chamber. After another series of three 5-min PBS washes to remove unbound secondary antibodies, a PBS-diluted nucleic acid staining solution, Hoechst 33342 at 5 µg/mL, was applied to the sections. A final incubation of 30 min in a light-protected moisture chamber was conducted for nuclear staining. Next, the slides were mounted, sealed with nail polish, and observed by upright microscope (BX51WI, Olympus).
In vivo fluorescence measurement
To measure the fluorescence intensity of the tissue-engineered skin transplanted into mice, an observation system was constructed by securing a tripod (Velbon 475213, 473264, 500274) with a camera (Canon EOS RP, RF35 mm F1.8 MACRO IS STM) and a collimated light source (Lelmac, IBF-LX40AW), ensuring a constant optical path length. A short-cut filter (Fujifilm SC-52) was placed in front of the camera and a bandpass filter (Edmund #86-363) was positioned in front of the collimated light source (Fig. S9a, b). Edmund #86-363 cuts the wavelength range of the excitation light emitted from the light source that covers the fluorescence/detection light wavelength range, and SC-52 cuts the excitation light component from the detection light component incident on the detection camera. Fluorescence observations were conducted on anaesthetised mice that were positioned to maintain consistent body angles and locations. The fluorescence images were captured using an observation system and analysed using the ImageJ software to calculate the fluorescence intensity per unit area. Additionally, the values were normalised to the initial day’s measurements and presented in a graph.
Transplantation of tissue-engineered skin to the SHO mouse
The SHO mice were obtained from Oriental Yeast Co., Ltd. All mice were housed under a 12-h light-dark cycle. The flanks of the anaesthetised mice were disinfected using a cotton swab with povidone-iodine followed by ethanol. The inner circle of the culture insert was outlined on the flank skin using a pen. The skin within the marked area was excised using scissors. The tissue-engineered skin still on the membrane was then placed in the excised area. The membrane was carefully removed using a cotton swab moistened with culture medium and tweezers. The site was subsequently sutured with each stitch penetrating the tissue-engineered skin, muscle layer, and mouse skin. The muscle layer was kept moist with a saline solution as needed. The transplanted area was disinfected with povidone-iodine and ethanol, using cotton swabs. Protective tape was applied over the transplanted site using a short piece of tape directly over the site and a longer piece wrapped around the torso. Finally, the mice were placed in new cages at a density of approximately two mice per cage.
Ethics
All mouse experiments conducted in this study were approved by the Animal Care Committee at the University of Tokyo (approval number: 02-12) and the Institutional Animal Care and Use Committee of RIKEN Kobe Branch and were performed in accordance with the relevant guidelines and regulations. All animal care and experiments complied with the Guide for Animal Use and Care, published by the University of Tokyo.
Reporting summary
Further information on research design is available in the Nature Portfolio Reporting Summary linked to this article.
Data availability
All data supporting the findings of this study are available within the article and its supplementary files. Any additional requests for information can be directed to, and will be fulfilled by, the corresponding authors. Source data are provided with this paper. The data for this study have been deposited in the figshare with https://doi.org/10.6084/m9.figshare.30497771. Source data are provided with this paper.
References
Juvenile Diabetes Research Foundation Continuous Glucose Monitoring Study Group et al. Continuous glucose monitoring and intensive treatment of type 1 diabetes. N. Engl. J. Med. 359, 1464–1476 (2008).
Buskermolen, A. D. et al. Continuous biomarker monitoring with single molecule resolution by measuring free particle motion. Nat. Commun. 13, 6052 (2022).
Califf, R. M. Biomarker definitions and their applications. Exp. Biol. Med. 243, 213–221 (2018).
Kim, J., Campbell, A. S., de Ávila, B. E.-F. & Wang, J. Wearable biosensors for healthcare monitoring. Nat. Biotechnol. 37, 389–406 (2019).
Xie, Z., Avila, R., Huang, Y. & Rogers, J. A. Flexible and stretchable antennas for biointegrated electronics. Adv. Mater. 32, e1902767 (2020).
Min, J. et al. Skin-interfaced wearable sweat sensors for precision medicine. Chem. Rev. 123, 5049–5138 (2023).
Ma, X. et al. A monolithically integrated in-textile wristband for wireless epidermal biosensing. Sci. Adv. 9, eadj2763 (2023).
Wang, W. et al. Neuromorphic sensorimotor loop embodied by monolithically integrated, low-voltage, soft e-skin. Science 380, 735–742 (2023).
Misawa, N., Mitsuno, H., Kanzaki, R. & Takeuchi, S. Highly sensitive and selective odorant sensor using living cells expressing insect olfactory receptors. Proc. Natl. Acad. Sci. USA. 107, 15340–15344 (2010).
Zakrzewski, W., Dobrzyński, M., Szymonowicz, M. & Rybak, Z. Stem cells: past, present, and future. Stem Cell Res. Ther. 10, 68 (2019).
Blanpain, C. & Fuchs, E. Epidermal stem cells of the skin. Annu. Rev. Cell Dev. Biol. 22, 339–373 (2006).
Watt, F. M. Mammalian skin cell biology: at the interface between laboratory and clinic. Science 346, 937–940 (2014).
Iizuka, H. Epidermal turnover time. J. Dermatol. Sci. 8, 215–217 (1994).
Potten, C. S., Saffhill, R. & Maibach, H. I. Measurement of the transit time for cells through the epidermis and stratum corneum of the mouse and guinea-pig. Cell Tissue Kinet 20, 461–472 (1987).
Li, Y. et al. Genome-edited skin epidermal stem cells protect mice from cocaine-seeking behaviour and cocaine overdose. Nat. Biomed. Eng. 3, 105–113 (2019).
Hayden, M. S. & Ghosh, S. Shared principles in NF-kappaB signaling. Cell 132, 344–362 (2008).
Hayden, M. S. & Ghosh, S. Regulation of NF-κB by TNF family cytokines. Semin. Immunol. 26, 253–266 (2014).
Hayden, M. S. & Ghosh, S. NF-κB in immunobiology. Cell Res. 21, 223–244 (2011).
Moll, R., Franke, W. W., Schiller, D. L., Geiger, B. & Krepler, R. The catalog of human cytokeratins: patterns of expression in normal epithelia, tumors and cultured cells. Cell 31, 11–24 (1982).
Gabbiani, G. Modulation of fibroblastic cytoskeletal features during wound healing and fibrosis. Pathol. Res. Pract. 190, 851–853 (1994).
Kefalides, N. A., Alper, R. & Clark, C. C. Biochemistry and metabolism of basement membranes. Int. Rev. Cytol. 61, 167–228 (1979).
Fujihara, M. et al. Molecular mechanisms of macrophage activation and deactivation by lipopolysaccharide: roles of the receptor complex. Pharmacol. Ther. 100, 171–194 (2003).
Lavker, R. M. & Sun, T. T. Heterogeneity in epidermal basal keratinocytes: morphological and functional correlations. Science 215, 1239–1241 (1982).
Bosma, G. C. et al. Evidence of functional lymphocytes in some (leaky) scid mice. J. Exp. Med. 167, 1016–1033 (1988).
Ansari, A. M. et al. Cellular GFP toxicity and immunogenicity: potential confounders in in vivo cell tracking experiments. Stem Cell Rev. Rep. 12, 553–559 (2016).
Acknowledgements
This work is partly supported by JSPS KAKENHI Grant Number JP22H00284 and JSPS KAKENHI Grant Number JP21H05013.
Ethics declarations
Competing interests
H.F., J.S., M. Takeo, Y.T., M. Ogawa, K.Y., T.T. and S.T., have the following patent pending on this work. Patent filing number: JP2023-141483. Filing date: Aug. 31, 2023. The remaining authors declare no competing interests.
Peer review
Peer review information
Nature Communications thanks Ander Izeta, and the other, anonymous, reviewer(s) for their contribution to the peer review of this work. A peer review file is available.
Additional information
Publisher’s note Springer Nature remains neutral with regard to jurisdictional claims in published maps and institutional affiliations.
Supplementary information
Source data
Rights and permissions
Open Access This article is licensed under a Creative Commons Attribution-NonCommercial-NoDerivatives 4.0 International License, which permits any non-commercial use, sharing, distribution and reproduction in any medium or format, as long as you give appropriate credit to the original author(s) and the source, provide a link to the Creative Commons licence, and indicate if you modified the licensed material. You do not have permission under this licence to share adapted material derived from this article or parts of it. The images or other third party material in this article are included in the article’s Creative Commons licence, unless indicated otherwise in a credit line to the material. If material is not included in the article’s Creative Commons licence and your intended use is not permitted by statutory regulation or exceeds the permitted use, you will need to obtain permission directly from the copyright holder. To view a copy of this licence, visit http://creativecommons.org/licenses/by-nc-nd/4.0/.
About this article

Cite this article
Sawayama, J., Takeo, M., Takayama, Y. et al. Living sensor display implanted on skin for long-term biomarker monitoring. Nat Commun 17, 56 (2026). https://doi.org/10.1038/s41467-025-67384-2
Received:
Accepted:
Published:
Version of record:
DOI: https://doi.org/10.1038/s41467-025-67384-2