Introduction
Food additives encompass a wide range of substances which can be divided into different categories based on their functional properties, e.g., colours, preservatives, sweeteners, emulsifiers, etc. Our group already investigated artificial sweeteners1, emulsifiers2, nitrites and nitrates3, and most recently, food additive mixtures4 in association with type 2 diabetes incidence in the NutriNet-Santé cohort. The present study focuses on preservative food additives, which are massively used by the food industry globally. Among the three and a half million foods and beverages listed in the Open Food Facts World database in 20245, more than 700,000 contain at least one of these additives. Preservatives (European codes usually within the E200s and E300s ranges) are added to prolong the shelf-life of foods. They protect them against deterioration caused by micro-organisms and/or growth of pathogenic micro-organisms, and by oxidation, such as fat rancidity and colour changes6.
From 2004 to 2024, about a sixth (n = 25) of food additive re-evaluations conducted by the European Food Safety Authority (EFSA) concerned preservatives. Sixteen of them led to the derivation of Acceptable Daily Intake (ADI) reference values for these additives or their respective groups7. ADIs were based on a range of toxicological endpoints, including behavioural, carcinogenic, developmental, haematological, reproductive, and thyroid toxicity, as well as growth retardation, increased blood methaemoglobin level, and increased mortality, all relying on experimental data. Moreover, in vivo and in vitro studies highlighted potential metabolic-related generally adverse effects of preservatives on pancreatic tissue8,9, insulin disruption8,9,10,11, the tricarboxylic acid (TCA) cycle11,12, inflammation13,14, and advanced glycation end products (AGEs) activation15, questioning their potential impacts on metabolic disorders such as type 2 diabetes, with direct metabolic aetiology. EFSA suggested that metabolisation of these additives implies conversion into substances, such as acetate into acetyl-CoA, that play a role in the body’s metabolism7. For some of these additives, corresponding substances are naturally present in foods and beverages (e.g., certain antioxidant vitamins such as vitamin C – ascorbic acid). In this case, epidemiological studies investigated the link between their dietary intake, supplementation or nutritional status and the risk of type 2 diabetes (suggesting non-to-low protective evidence16), but to our knowledge, none of these have considered food additives sources, while the impact of the substance may depend on the matrix in which it is integrated. Plus, no consumption data is available for other preservative food additives due to the important variability in additive composition between commercial products and the lack of brand-specific data in previous cohorts. Thus, this study aimed to comprehensively quantify the time-dependent exposure to preservative food additives available on the French/European market and examine any potential associations with the incidence of type 2 diabetes in a large prospective cohort.
Results
Descriptive characteristics
The population study included 108,723 participants (Fig. 1), 79.2% women. On average, they completed 21 24HDRs (SD 18); median = 17; 25th–75th percentiles = 6–32; maximum = 84. Participants had a mean age at baseline of 42.5 years (SD 14.6) (range = 15.2–99.0). Compared to lower consumers (tertile 1), higher consumers of food additive preservatives (tertile 3) tended to be younger, slightly less exposed to a family history of diabetes, with a lower prevalence of metabolic diseases (cardiovascular disease, dyslipidaemia, and hypertension), a lower physical activity level, they were more likely to be current smokers, consumed less alcohol and had higher energy intakes (Table 1—descriptive unadjusted analysis).

Flowchart of participants included from the NutriNet-Santé cohort, 2009–2023 (n = 108,723).
Intakes of preservative food additives are displayed in Tables 2 and 3. A total of 99.7% of participants exhibited a non-null intake of food additive preservatives in the first 2 years of follow-up. Out of the 58 preservative food additives detected and quantified in our databases, 17 were consumed by at least 10% of the participants and thus were individually investigated in relation with type 2 diabetes incidence (Tables 2 and 3), to allow sufficient statistical power in Cox models (but all 58 additives were accounted for in sums of preservative categories). In terms of proportion of consumers, the main preservative food additives were: citric acid (E330) (91.8% consumers), lecithins (E322) (87.1%), total sulfites (83.6%), ascorbic acid (E300) (83.5%), sodium nitrite (E250) (73.7%), potassium sorbate (E202) (65.5%), sodium erythorbate (E316) (52.7%), sodium ascorbate (E301) (50.2%), potassium metabisulfite (E224) (44.4%), and potassium nitrate (E252) (32.6%). No strong correlation between preservative food additives was identified (Supplementary Fig. 1).
Manufacturers use preservatives ubiquitously across a wide range of food groups (Fig. 2 and Supplementary Table 1). Some are nonetheless more specific to given food groups: 22.2% of sorbates were found in fruit- and vegetable-based foods; 85.5% of sulfites in alcoholic drinks; 53.7% of nitrites, 80.4% of nitrates, and 42.2% of erythorbates in processed meat; 43.6% and 30.5% of propionates in refined and whole grains and cereals, respectively; 50.6% of ascorbates and 25.7% of citrates in fruit- and vegetable-based foods; and 30.3% of tocopherols in breakfast cereals. In all, 34.6% of food additive preservatives were consumed through ultra-processed foods in this population study.

The magnitude of the food group contribution to the preservative food additive intake is reflected by the colour (gradient from yellow to red, the higher the contribution, the redder the circle) and size point (the higher the contribution, the bigger the circle). aGroups of preservative food additives were defined as follows (European codes): total sorbates (E200, E202, E203), total benzoates (E210, E211, E212), total sulfites (E220, E221, E222, E223, E224, E225, E228), total nitrites (E249, E250), total nitrates (E251, E252), total acetates (E260, E261, E262, E263), total propionates (E280, E281, E282), total ascorbates (E300, E301, E302, E304), total tocopherols (E306, E307, E307b, E307c), total erythorbates (E315, E316), total butylates (E319, E320, E321), and total EDTA (E385, E386). bDetailed % are presented in Supplementary Table 1. Source data are provided as a Source Data file.
For food additive substances that also naturally occurred in the diet, the relative contribution of the food additive source varied depending on the compound: from 1% for tocopherols or 5% for acetates on average, to 17% for citric acid, 29% for ascorbates, and 63% for sulfites.
No participant exceeded the ADIs set by EFSA7 for sorbates, erythorbates or nitrates. However, 90 participants exceeded the ADI set for sulfites with a mean intake of 0.88 mg of sulfur dioxide/kg body weight per day (SD 0.33, median = 0.80, 25th–75th percentiles [0.75–0.92]) and 55 exceeded the ADI for nitrites with a mean consumption of 0.10 mg nitrite ion/kg body weight per day (0.03, 0.08, [0.08–0.10]).
Associations between preservative additives and incidence of type 2 diabetes
Participants’ median follow-up time was 8.05 years (841,296 person-years). Between 2009 and 2023, 1131 incident type 2 diabetes cases were identified. Schoenfeld residuals did not refute the proportional hazard assumption (Supplementary Fig. 2).
Restricted cubic spline plots (Supplementary Fig. 3) did not indicate departure from linearity for sodium acetates (E262), total tocopherols, tocopherol-rich extract (E306), alpha-tocopherol (E307), phosphoric acid (E338), and extracts of rosemary (E392) (p values for non-linearity ≥0.05), in this case p values for trend are provided in the following paragraph. For others, restricted cubic splines suggested a plateau effect (p values for non-linearity <0.05); therefore, the likelihood ratio overall p values (requiring no underlying hypothesis of linearity) are displayed thereafter. The retained p values are provided for all tested additives in Supplementary Table 2 for the main model and in Supplementary Table 3 for sensitivity analyses.
The results of Cox models are presented in Fig. 3 and Supplementary Table 2. Higher intakes of the following additives were associated with a higher incidence of type 2 diabetes: total preservatives (HRcategory 3 vs. 1 = 1.47, 95% CI [1.26–1.73], p < 0.001), total preservatives (non-antioxidant) (1.49[1.27–1.74], <0.001), total sorbates (1.85[1.57–2.18], <0.001), potassium sorbate (E202) (2.15[1.76–2.63], <0.001), potassium metabisulfite (E224) (1.29[1.10–1.51], <0.001), total nitrites (1.50[1.26–1.78], <0.001), sodium nitrite (E250) (1.50[1.26–1.78], <0.001), total acetates (1.36[1.16–1.59], <0.001), acetic acid (E260) (1.31[1.08–1.60], <0.001), sodium acetates (E262) (1.23[1.01–1.50], 0.003), total propionates (1.43[1.21–1.68], <0.001), calcium propionate (E282) (1.44[1.22–1.70], <0.001), total preservatives (antioxidant) (1.40[1.19–1.65], <0.001), total ascorbates (1.17[1.00–1.38], 0.01), sodium ascorbate (E301) (1.41[1.19–1.66], <0.001), total tocopherols (1.27[1.07–1.50], <0.001), alpha-tocopherol (E307) (1.30[1.05–1.60], 0.001), total erythorbates (1.42[1.20–1.69], <0.001), sodium erythorbate (E316) (1.43[1.20–1.69], <0.001), citric acid (E330) (1.29[1.11–1.51], 0.003), phosphoric acid (E338) (1.39[1.10–1.75], <0.001), and extracts of rosemary (E392) (1.20[1.02–1.41], 0.01). Overall, these results were stable across all sensitivity analyses testing mutual adjustment for other preservative food additives, additional adjustment for the proportion of ultra-processed foods in the diet, diagnosis and/or treatment for at least one prevalent non-diabetes metabolic disorder, time-dependent intakes of total emulsifier and total artificial sweetener food additives, vitamins C and E supplements, trans fatty acids, dietary patterns rather than individual food groups, polyunsaturated fatty acids and heme iron; models with start of follow-up after the first 2-year period; models not excluding energy under-reporters; marginal structural model; and model using splines for covariates (Supplementary Table 3). An exception was for total ascorbates, which became non-significant with p = 0.4 in the marginal structural model, maybe due to loss of statistical power (however, the specific ascorbate E301 remained stable with this model, p < 0.001). As expected, no association was detected with the hip fracture negative control model (613 incident cases, all p values > 0.05).
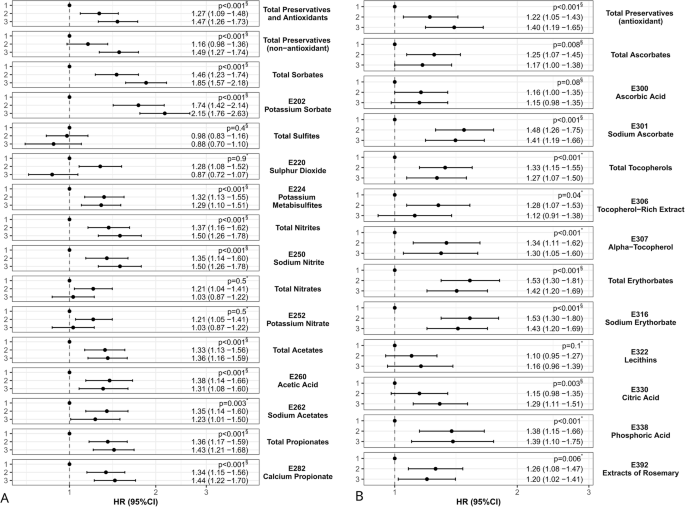
HR hazard ratio, CI confidence interval. The dot represents the estimates of HR, and the error bars represent the 95%CI of the estimates. The dashed line indicates the reference value (HR = 1). Associations between total preservatives and non-antioxidant preservatives and type 2 diabetes are presented on the left-hand side (A) of the figure, and between antioxidant preservatives and type 2 diabetes on the right-hand side (B). aThe three food additive categories were defined as follows: sex-specific tertiles (tertile 1 = reference) for total preservatives, total preservatives (non-antioxidant), total sorbates, total sulfites, total nitrites, sodium nitrite (E250), total preservatives (antioxidant), total ascorbates, ascorbic acid (E300), lecithins (E322), and citric acid (E330); and otherwise: 1/ non-consumers (=reference), 2/ lower, and 3/ higher consumers, the latter two being separated by the sex-specific median. Cut-offs were re-calculated for each period and are available in Supplementary Table 6. bThe detail of all investigated associations between preservative food additive intakes and type 2 diabetes risk with corresponding HRs, 95% CIs and number of cases/participants per category is provided in Supplementary Table 2. When the log-linearity assumption was not rejected (p for non-linearity ≥0.05 in the Restricted Cubic Splines models), the p for linear trend (marked with *) was retained (obtained by coding the exposure as an ordinal categorical variable 1, 2, 3). When the assumption of log-linearity was not met (p for non-linearity <0.05), it was not adapted to calculate a p for linear trend, thus, the likelihood ratio overall p value (marked with §) was retained (obtained by coding the exposure as a non-ordinal categorical variable and calculating likelihood ratio test between models with and without the studied food additive exposure variable). cMultivariable Cox proportional hazard models (two-sided, statistically significant p value < 0.05) (see Methods for adjustment strategy). Source data are provided as a Source Data file. FDR-corrected p values for multiple test correction are available in footnote e of Supplementary Table 2.
We also tested associations between intakes of acetic acid, citric acid, nitrates, nitrites, sulfites, vitamin C, and vitamin E from naturally occurring sources and type 2 diabetes incidence. Naturally occurring acetic acid and nitrates from drinking water were associated with increased type 2 diabetes incidence, while natural sulfites were associated with lower incidence (Supplementary Table 4).
In this population study, ultra-processed food exposure (% weight in the diet) was associated with higher type 2 diabetes incidence (HR = 1.20, 95% CI [1.11–1.29], p value < 0.001). We computed a mediation analysis to assess the proportion of this association mediated by preservative food additives that were related to type 2 diabetes in this study (i.e., potassium sorbate (E202), potassium metabisulfite (E224), sodium nitrite (E250), acetic acid (E260), sodium acetates (E262), calcium propionate (E282), sodium ascorbate (E301), tocopherol-rich extract (E306), alpha-tocopherol (E307), sodium erythorbate (E316), citric acid (E330), phosphoric acid (E338), and extracts of rosemary (E392)). In all, 17% of the association between ultra-processed food and type 2 diabetes was mediated by exposure to these preservatives (p value of the mediated proportion = 0.01).
Discussion
This large prospective cohort study revealed associations of higher type 2 diabetes incidence with higher intakes of several widely used preservative non-antioxidant food additives (potassium sorbate, potassium metabisulfite, sodium nitrite, acetic acid, sodium acetates, and calcium propionate) and preservative antioxidant food additives (sodium ascorbate, tocopherol-rich extract, alpha-tocopherol, sodium erythorbate, citric acid, phosphoric acid, and extracts of rosemary).
For some preservative food additives, EFSA data were available to compare intake levels with those observed in our population study (Supplementary Table 5). The order of magnitude was consistent overall. Relatively similar intakes were observed for sorbates (E200-E203), ascorbates (E300-E302), extracts of rosemary (E392), nitrates (E251-E252), propionates (E280-E283), and lecithins (E322). Compared to EFSA, intake tended to be lower in NutriNet-Santé for sulfites (E220-E228), nitrites (E249-E250), and alpha-tocopherol (E307) and higher for erythorbates (E315-E316). These differences may be due to: (1) the differences between exposure assessment methods (with more precise data in the NutriNet-Santé cohort, based on brand-specific repeated 24HDRs versus generic food items and a generally lower number of records or recalls in studies on which EFSA estimates are based); (2) the differences in dates of assessment and study populations, with for instance more women, older, and more-health conscious participants in NutriNet-Santé compared to the French general population.
No other cohort study investigated the associations between intakes of preservative food additives and type 2 diabetes incidence, probably due to a lack of data regarding specific industrial foods consumed and thus their additive content, which varies greatly from one brand to another. Thus, comparison with epidemiological literature is not straightforward. Consistent with our findings, a recent meta-analysis observed a higher risk of type 1 or 2 diabetes associated with higher exposure of dietary nitrites and no association with nitrates. This meta-analysis included five studies based on food frequency questionnaires (not enabling differentiation between naturally occurring and food additive sources) as well as previous NutriNet-Santé results (based on brand-specific data, enabling differentiation between sources)17. Indeed, our group previously published a specific study on nitrites and nitrates and type 2 diabetes incidence in NutriNet-Santé3. Despite an updated methodology (now using time-dependent cumulative exposure) and longer follow-up (+2 years), the results remain consistent. As several public health authorities consider a possible ban of nitrites and nitrates as food additives, altogether, these data consolidate the conclusions that higher exposure to additive-originated nitrites was associated with higher type 2 diabetes incidence, while no association with nitrate additives was detected3. To our knowledge, no other study investigated nitrite/nitrate additives and type 2 diabetes incidence. Regarding antioxidants, a recent systematic review and meta-analysis of randomised controlled trials (RCTs) showed no benefit of vitamins E, C or beta-carotene supplementation on type 2 diabetes risk16. None of the included studies provided data specifically on preservative antioxidant food additives. An RCT conducted in Iran focused on patients with non-alcoholic fatty liver disease and detected no effect of rosemary leaf extract on glycaemic status18. Some prospective studies investigated the associations between blood or urinary biomarkers of some compounds that may partly result from exposure to exogenous preservative food additives, but also largely from endogenous metabolism, greatly limiting the comparison with our results. For instance, a nested case-control from the Women’s Interagency HIV Study in the United States observed that plasma sorbic acid was associated with greater odds of incident type 2 diabetes19. Another US prospective study showed that elevated serum calcium phosphate, a derived compound of phosphoric acid, was associated with an increased risk of developing type 2 diabetes20.
As shown in Supplementary Fig. 4, many mechanisms may underpin the associations detected in this study, including metabolic and inflammatory disruption and/or altered insulin signalling pathway. An in vitro study (hepatic cells) on food additives revealed that lecithins showed no cytotoxicity or genotoxicity, while potassium sorbate, sodium nitrite, sodium ascorbate, and sodium erythorbate were cytotoxic21. Potassium sorbate specifically acts as an AGE activator with and without glucose15, while high AGE intake is linked to type 2 diabetes22. Mouse model studies showed that coadministration of sorbate and fructose (a monosaccharide naturally found in many foods and drinks) leads to altered liver function (steatosis, inflammation, fibrosis) associated with altered expression of genes involved in lipid metabolism23. These observations are associated with disturbances in intestinal myco- and microbiota, while other studies have confirmed sorbate’s potential proinflammatory effects at hepatic and microbiota levels24. Investigating the impact of potassium sorbate on pancreatic inflammation, related to type 2 diabetes onset25, would be interesting.
Regarding the insulin (INS) pathway, experiments on rat models showed the particular role of N-nitroso compounds in the development of INS resistance via disruption of both INS and IGF pathways and dysfunction of pancreatic β-cells8,9 and that co-exposure to N-nitrosodiethylamine (NDEA) and fat (found in nitrited-processed meat) causes INS and IGF-1 resistance associated with type 2 diabetes26. Studies on mice and humans also reported that propionate impaired insulin action27. In a rodent study, chronic supplementations of pharmacological doses of vitamins C and E increased fasting blood glucose, insulin, and homoeostasis model assessment index for insulin resistance (HOMA—a method used to quantify insulin resistance and beta-cell function)10. Vitamin C impaired glucose tolerance by disrupting upstream hepatic insulin action, while vitamin E acted downstream insulin receptors, reducing, for example, glucose transporter-2 expression. Sodium ascorbate, which converts to vitamin C, and vitamin C isomers like erythorbates may share similar roles in metabolism. In contrast, an in vitro study found that alpha-tocopherol decreases superoxide anion release in human monocytes under hyperglycaemic conditions via inhibition of protein kinase C-alpha28. The effects of one substance may vary based on factors such as food matrix (of which composition, structure, pH and other characteristics may affect the way bioactive compounds are assimilated and digested by gut microbiota and host organisms), dosage, and interaction with other elements, impacting the bioavailability of oil-soluble vitamins like vitamin E, for instance29,30.
The TCA cycle is connected to several metabolisms (including fat, amino acid, glucose metabolisms)—changes in the levels of its metabolites may impact the overall metabolism. For example, inhibiting citrate cotransporter Slc13a5/mINDY improved hepatic insulin sensitivity11. Interestingly, several food additives like citrate, propionate (after conversion into succinyl-CoA), and acetate (after conversion into acetyl-CoA) connect with the TCA cycle12, and it would be interesting to test the links between such exposure and the activity of this specific metabolism. No direct comparison was possible concerning phosphoric acid; however, a US cross-sectional study found that the phosphate-regulating hormone fibroblast growth factor (FGF23) may be considered a biomarker for declining metabolic function linked to inflammation14.
In our study, both linear and non-linear relationships were observed. Overall, for substances showing a non-linear relationship, restricted cubic splines suggested a plateau effect (i.e., the higher the intake, the higher the incidence until a certain threshold, a point from which, even if the intake increases, the incidence globally does not vary much). Other epidemiological and experimental studies are needed to confirm and understand these dose-response relationships and underlying mechanisms.
In terms of public health implications, these results suggest that a reduction in food additive preservative exposure might be beneficial to type 2 diabetes prevention. As per the NOVA definition, food preservatives are not necessarily markers of ultra-processing (unlike other food additives such as artificial sweeteners or colours). The proportion of additive preservatives from ultra-processed foods in this population study was 34.6%. This probably contributed to the fact that results were still statistically significant after adjustment for the proportion of ultra-processed foods in the diet. However, this is not incompatible with the fact that some of these additives could contribute to explaining part of the association between ultra-processed foods and elevated risk of type 2 diabetes31,32. In practice, to reduce exposure to certain food additive preservatives such as sulfites or nitrites, for which the primary sources are specific food groups that, in addition, have no particular nutritional value (i.e., alcoholic beverages and processed meats, respectively), it is advisable to limit consumption of these food/beverage groups. However, several preservative food additives (e.g., potassium sorbate, calcium propionate, erythorbates) are ubiquitously used across many food groups, with a huge variability in ingredient lists depending on the brands for the same generic food item. This has two public health implications. First, in terms of recommendations to the public, this leads to the formulation of a general guideline aimed at limiting unnecessary preservative additives (choosing preservative-free alternatives whenever possible). This applies to all food groups, including processed and ultra-processed fruit and vegetables. For example, cooking at home and consuming only unprocessed or minimally processed fruit and vegetables would avoid around 25% of total food preservatives. Second, this reinforces the idea that measures targeting individuals (such as disseminating recommendations) will not be sufficient and that policy actions must be implemented in parallel to deeply transform the food supply and reduce exposure. This includes, for example, re-evaluating these additives and, if necessary, amending regulations on authorised substances and doses in order to better protect the population.
This study was based on a large and prospective cohort with highly detailed brand-specific 24HDRs along 14 years of follow-up (allowing time-dependent cumulative exposure assessment), thereby providing access to unique information on exposure to preservative food additives. However, several limitations should be acknowledged. First, the observational design does not allow causal interpretation for the studied associations based on this study alone. Residual confounding cannot be fully ruled out. Yet, multivariable models have been adjusted for a broad spectrum of potential confounding factors, thereby limiting the potential for bias. In particular, the food vectors of preservative additives were very diverse, encompassing contrasted nutritional profiles in terms of sugar, salt, fat and fibre content. For instance, for potassium sorbate, 26.3% of the intake came from fruit- and vegetable-based products while 21.6% came from fats and sauces. To limit as much as possible confounding bias linked to nutritional profiles of vector foods, all models were carefully adjusted for energy, saturated fats, sodium, dietary fibre, and sugar intakes. Second, as in other studies investigating health and diet in which people enroll voluntarily, this study included more women, with a higher educational level and healthier lifestyles than the general French population33,34. Therefore, caution is needed in generalising the findings. However, daily energy intake as well as proportion of energy by ultra-processed foods were similar in our population study compared to estimates from French nationally representative surveys, supporting the generalisability of our findings35,36. Ethnic representation race/ethnicity and religion were not available in the cohort due to a very restrictive ethical/legal regulation policy regarding the collection of these data in French epidemiological studies (specific authorisations needed). But overall, the geographical distribution of the cohort also matches that one of the general population in mainland France37. Nearly 95% of the French population has access to the Internet38, and we have shown that the study population was not limited to digitally fluent individuals (with about a quarter of participants reporting being inexperienced in terms of computer use)39. In aetiological studies, the diversity of the population is more important than the representativeness itself. In NutriNet-Santé, we aimed to have enough contrast between different categories of dietary exposures to conduct aetiological analyses, while accounting for a wide diversity of lifestyle profiles. Third, besides the characteristics of this population (more women, more highly educated, healthier lifestyles), combined with a young minimum age of enrollment (15+), potentially explains the observed low rate of ascertained type 2 diabetes (1.04% in this study against 5.6% people being medicated for diabetes in France40). Multisource case ascertainment combining participant declaration of a medical diagnosis of type 2 diabetes by a physician with yearly registration of all medication use linked to the Vidal® database and the link with medico-administrative databases limited the risk of not detecting diagnosed cases. Moreover, nationally-representative French data estimated that only 1.7% adults had undiagnosed diabetes in France41, limiting the potential bias due to undiagnosed diabetes cases. Fourth, classification bias can never be totally excluded. However, the estimation of dietary intakes (nutrients and food additives) in NutriNet-Santé is among the most accurate globally in a cohort study. This is due to the high level of the 24HDRs used (3500 generic foods including the distinction between raw vs. cooked, organic vs. conventional etc. + commercial brands), and their update during follow-up. Dietary records were validated against interviews by a trained dietitian and against blood and urinary biomarkers for energy and key nutrients42,43,44. Nevertheless, specific exposure to preservative food additives was not part of these validation studies. Indeed, validation of additive exposure versus plasmatic or urinary biomarkers would be ideal; however, it can be challenging, and even impossible for most food additives, including most preservatives, due to the lack of measurable biomarkers, since most additives are metabolised into substances that are non-specific and/or ubiquitous in human biofluids. However, the accuracy of the qualitative and quantitative food additive exposure assessment of the NutriNet-Santé cohort represents an important strength of the study, thanks to detailed and repeated 24HDRs, linked to multiple food composition databases (OQALI, Open Food Facts, GNPD, EFSA, and GSFA), ad-hoc laboratory assays in food matrices, and dynamic matching to account for reformulations of industrial food items over time. Besides, intakes of food additive preservatives in this study mostly aligned with EFSA estimates. Using the Australian Food Composition Database to estimate naturally occurring acetic and citric acids was not optimal since country variations may occur, but French/European composition tables were not available or less complete for these natural sources. Similarly, quantifying the natural intake of some substances was impossible due to limited data (e.g., natural lecithins). Fifth, participants were invited to complete three 24HDRs every 6 months. Since the dietary record update was not mandatory, not all participants completed all records (in this case, their intakes of the previous period were kept). Therefore, we used updated intake values for each participant whenever available, making the most of all follow-up data, and systematically adjusting for the number of answered 24HDRs in all models. Next, it was not feasible to examine the association of several less frequently consumed preservative food additives with type 2 diabetes. However, these limited proportions of consumers reflected a low occurrence in the French market, indicating a reduced potential public health impact for these substances. Last, results were presented with and without adjustment for multiple testing by the False Discovery Rate method, with mostly stable results. If adjusting for multiple testing decreases type I error, it also increases type II error (risk of false negative) and may lead miss out on existing associations, which is why this adjustment is debated45. Besides, our results were supported by mechanistic plausibility, and all detected associations in our study showed HRs >1, strongly suggesting they were not going in random directions (which would have been the case if they were due to chance).
This large prospective cohort showed associations between exposure to several preservative food additives and higher type 2 diabetes incidence. These findings may have important public health implications given the ubiquitous use of preservatives in a wide range of foods and drinks. Although these results need to be confirmed by other epidemiological studies (since no causal conclusion can be drawn from a single observational study), they are consistent with experimental data suggesting adverse metabolic-related effects of several of these compounds. This calls for a re-evaluation of the safety of these additives and supports recommendations for consumers to favour fresh and minimally processed foods and limit superfluous additives whenever possible.
Methods
The study is registered at https://clinicaltrials.gov/ct2/show/NCT03335644 and is conducted according to the Declaration of Helsinki guidelines and approved by the Institutional Review Board of the French Institute for Health and Medical Research (IRB-Inserm) and the “Commission Nationale de l’Informatique et des Libertés” (CNIL n°908450/n°909216). Each participant provides an electronic informed consent form before enrollment. This research does not result in discrimination in any kind to our participants.
Study population
This study relied on the data from the French NutriNet-Santé prospective e-cohort, launched in 2009, to investigate the association between nutrition and health46. Participants aged 15 and above are invited to participate in the study via a dedicated web-based platform (https://etude-nutrinet-sante.fr/) and regularly answer questionnaires on their dietary intakes, health, anthropometric47,48, physical activity49, lifestyle, and socio-demographic data50. Sex was self-reported by participants. No compensation was offered to the participants. The term “sex” is used throughout the study as we aimed to reflect the biological attribute rather than the gender shaped by social and cultural circumstances. There was no specific hypothesis of an interaction between studied preservatives and sex, thus results are presented overall. However, all cut-offs for exposure categories were sex-specific (and presented by sex in Supplementary Table 6).
Dietary data collection
Upon registration and every 6 months, participants were asked to complete in sequences of three validated42,43,44 web-based 24-h dietary records (24HDRs). At each period, 24HDRs were randomly assigned to three non-consecutive days over 2 weeks (2 weekdays and 1 weekend day, to account for variability in the diet across the week and the seasons). At all times throughout their assigned dietary record period, participants had access to a dedicated interface on the study website to declare all foods and beverages consumed during 24 h: three main meals (breakfast, lunch, dinner) and any other eating occasion. Participants were asked to estimate portion sizes either by directly entering the weight consumed in the platform or by using validated photographs or usual containers51. The NutriNet-Santé food composition database (>3500 items) was used to estimate mean daily energy, alcohol, macro- and micro-nutrient intakes (including vitamins C and E)52. This database integrated all available data from the French national composition database (CIQUAL53), and further added information on additional components (e.g., food additive, trans fatty acids, etc.). These estimates included contributions from composite dishes using French recipes validated by food and nutrition professionals. The web-based questionnaires used in the study have been tested and validated against both in-person interviews by trained dietitians and urinary and blood markers42,43. In this analysis, we included participants having at least two 24-h dietary records during the first 2 years of follow-up. Participants who underreported their energy intake were excluded from the analyses and were identified using the method from Black, based on the original method developed by Goldberg et al.54,55. This method relies on the hypothesis that the maintenance of a stable body weight requires a balance between energy intake and expenditure. The equations developed by Black account for the reported dietary energy intake, basal metabolic rate (calculated using Schofield’s equations), sex, age, height, weight, number of dietary records, physical activity level (PAL), and intra/inter-individual variability56. As recommended by Black, the intra-individual coefficients of variation for BMR and PAL were fixed at 8.5% and 15%, respectively. In addition, a PAL of 1.55 was used to reflect a “light” physical activity, which is assumed to be attained by healthy, normally active individuals living a sedentary lifestyle. Finally, some individuals identified as under-reporters of energy intakes using Black’s method were not excluded if they also reported recent weight variations, adherence to weight-loss restrictive diets, or declared the consumptions entered in their dietary records as unusually low compared to their habitual diets. This ensured that flagged under-reporters have true incoherent reporting, and must be excluded. Although their exclusion may limit the generalisability of the findings, it was necessary to avoid important exposure classification bias.
In this study, 23,098 participants (corresponding to 17.2% of the subjects) were considered under-energy reporters and were excluded from the study. This proportion of under-reporters is common, for instance, in the nationally representative INCA 3 study conducted in 2016 by the French Food Safety Agency, 18% of adult participants were identified as under-reporters using the Black method35.
Several quality control operations were performed to account for over-reporting. Limitations in the online tool were set when participants reported the quantities of food consumed, aiming to alert them that the number they were about to enter was potentially an outlier, thereby encouraging double-checking and correction. Later on, during the data cleaning process, limitations were set per food category within one eating episode and per record for quantities; for instance, limitations for fruits were set for 3000 grams/day, 1500 grams/day for fish, 2000 grams/day for yoghurts, etc. These limitations are based on the 99th percentile of energy intake and are updated every 10,000 new dietary records added to the cohort if more than 10% of reported food items had outliers, then the full record was excluded. Otherwise, values were corrected to the maximum authorised values or standardised. In this study, 54 participants (corresponding to 0.04% of the subjects) were considered over-energy reporters and were excluded from the analyses.
Participants’ intakes of naturally occurring acetic and citric acids, nitrites, nitrates, and sulfites were quantified using multiple sources (see the Methods on Preservative Food Additive Intakes).
Preservative food additive intakes
Assessment of food additive intake in the NutriNet-santé cohort through brand-specific data of the 24HDRs has been previously described57. Each industrial food item consumed and reported in a specific dietary record was matched against three databases to assess the presence of any food additive: OQALI, a national database whose management has been entrusted to the National Research Institute for Agriculture, Food and Environment (INRAE) and the French food safety authority (ANSES) to characterise the quality of the food supply (https://www.oqali.fr/); Open Food Facts, an open collaborative database containing millions of food products marketed worldwide (https://world.openfoodfacts.org/); and the Mintel Global New Products Database (GNPD), an online database of innovative food products in the world (https://www.mintel.com). In a second step, the dose of food additive contained in each food item was estimated based on (1) ad hoc laboratory assays quantifying additives in specific food items (n = 2677 food-additive pairs analysed), (2) doses in generic food categories provided by the European Food Safety Authority (EFSA), or (3) generic doses from the Codex General Standard for Food Additives (GSFA)58. Dynamic matching was applied, meaning that products were matched date-to-date: the date of consumption of each food or beverage declared by each participant was used to match the product to the closest composition data available, thus accounting for potential reformulations.
The 80 preservative food additives listed in the Codex General Standard for Food Additives database59 or UK Food Standard Agency60 were eligible for the present study. However, the occurrence of some of them was very low in the French/European markets, thus the proportion of consumers was null; their list is provided in the footnote to Tables 2 and 3. We decided to include as food additive preservatives both preservatives per se as defined by Regulation (EC) No 1333/20086 and antioxidant food additives, as both prevent the spoilage of food (food additive antioxidants preserving food via an antioxidant mode of action). In this paper, the term “preservative food additives” includes both “preservative non-antioxidant food additives” and “preservative antioxidant food additives”. Some preservative food additives possess additional key properties (e.g., some emulsifiers). All food additives with preservative properties are included in the present paper. We summed individual preservative food additives with similar chemical structures into the following groups: total sorbates (European codes E200, E202, E203), total benzoates (E210, E211, E212), total sulfites (E220, E221, E222, E223, E224, E225, E228), total nitrites (E249, E250), total nitrates (E251, E252), total acetates (E260, E261, E262, E263), total propionates (E280, E281, E282), total ascorbates (E300, E301, E302, E304), total tocopherols (E306, E307, E307b, E307c), total erythorbates (E315, E316), total butylates (E319, E320, E321), total citrates (E330, E332, E333), and total EDTA (E385, E386).
The strength of our methodology relies on the precise qualitative assessment of additive exposure, i.e., the presence/absence of a specific preservative food additive in the food consumed. This unique level of detail is permitted by the fact that commercial names/brands of industrial products consumed were collected and matched with Open Food Facts, OQALI, and GNPD databases, providing the ingredient list and thus, the presence of the specific food additive, at the time when the product was consumed. Thus, we only attribute a non-null dose of a specific additive to a given product declared by a participant if this specific product contains this specific additive. Then, the quantitative assessment of the doses of additives in the products that contain a specific additive is challenging since manufacturers are not compelled to declare this information on the packaging. Hence, the 3-step method was used to assess doses in our cohort. In all, in the framework of the ADDITIVES project, we performed 2677 quantified analyses, corresponding to a total of 61 food additives in 196 different (generic) food items. “Pairs” (i.e., a specific additive in a specific food vector) selected for laboratory assays corresponded to the most frequently consumed and most emblematic commercial food/beverage items for a given additive. Specifically, for preservative food additives, we had access to 1138 laboratory quantified analyses corresponding to 58 preservative food additives (E200, E202, E203, E210, E211, E212, E220, E221, E222, E223, E224, E225, E228, E234, E235, E239, E242, E249, E250, E251, E252, E260, E261, E262, E263, E280, E281, E282, E285, E290, E300, E301, E302, E304, E306, E307, E307b, E307c, E310, E315, E316, E319, E320, E321, E322, E325, E326, E330, E332, E333, E334, E338, E385, E386, E392, E472c, E942, E1105) in 128 (generic) food items (several commercial brands were tested per food item, e.g., in the case of milk chocolate, milk chocolate with nuts, creamy desserts, omega-3 enriched margarines, sausages, jams, chocolate mousse…). In addition to the assays carried out by certified laboratories, which were sent to us by the consumer association UFC Que Choisir, we contacted two companies (Mérieux & Eurofins) and the Direction Générale de la Consommation, de la Concurrence et de la Répression des Fraudes (DGCCRF) to carry out these assays. Only the additives listed in their catalogue could be measured.
If data were unavailable from this source, EFSA and GSFA doses were only applied if the specific food item contained the specific food additive in its ingredient list. We used 3122 preservative food additive data from EFSA (data available online in each EFSA Opinion + transmission of specific information by EFSA following an official Public Access to Document request PAD 2020/077), related to 46 preservative food additives present in 977 food categories. EFSA collects much information from manufacturers related to their specific commercial products, but for confidentiality reasons, only transfers information for generic food items or food groups (no brand-specific data). As regards GSFA, we used 5149 preservative food additive data concerning 42 preservative food additives coming from 226 food categories. As for EFSA, data from GSFA are not brand-specific but relate to generic food items or food categories (Supplementary Fig. 5).
Overall, quantitative dose data from ad hoc assays and from databases were similar in magnitude (e.g., for food additive potassium sorbate (E202) in the brand-specific pre-packed carrot salad that we selected: laboratory assay = 0.987 mg/100 g vs. 1 mg/100 g in the EFSA database for the corresponding generic food item), which was not surprising since EFSA doses for instance correspond to an average of laboratory assay data received by the Agency from EU member states, manufacturers and various contributors.
Food additive sulfites are present in many foods and drinks exempted from mandatory nutritional/ingredient declaration (e.g., wines or vinegar), making it sometimes impossible to determine which specific sulfite additive was used. Therefore, in this study, specific food additive codes (E220-E228) were used when the information was available on the packaging, i.e., for food items with mandatory ingredient declaration. The total sulfite variable accounts for all sulfite additives, i.e., both from foods and drinks with a mandatory ingredient list and from other food items with added sulfite (unspecified code). This strategy was established to avoid counting twice the same dose of sulfite (e.g., wine with declared ingredients).
In order to adjust for intake from non-additive sources of a given substance, whenever composition data were available:
Participants’ intake of naturally occurring acetic and citric acids was quantified using the Australian Food Composition Database61, which has been matched to the NutriNet-Santé food composition database for this specific study.
The methodology used to quantify intakes from non-food additive sources of nitrites and nitrates in foods and beverages has been previously described3,62,63. Briefly, food-originated nitrites and nitrates were determined by food category using EFSA’s concentration levels for natural sources and contamination from agricultural practices7. The publicly available data from the French official regional sanitary control of tap water was used to estimate intakes via water consumption by region of residence64, via a municipality-specific merging according to the NutriNet-Santé participants’ postal code, as well as a dynamic temporal merge according to the year of dietary records.
Participants’ intakes of naturally occurring and food additive sulfites were quantified using the corresponding EFSA Opinion7 and matching to the NutriNet-Santé database for this study.
Intakes of non-food additive dietary vitamins C and E were computed from the NutriNet-Santé food composition database52.
Type 2 diabetes ascertainment
A multi-source approach was used to detect incident type 2 diabetes cases. Throughout follow-up, participants could report any health-related events, medical treatments, and examinations via the health questionnaires every 6 months or, at any time, directly via the health interface of their profile. Besides, the NutriNet-Santé cohort was linked to the national health insurance system database to collect additional information regarding medical treatments and consultations, and to the French national mortality registry to identify the occurrence and cause of death. We did not perform ad hoc biochemical assessment. Participants were asked to declare major health events through the yearly health questionnaire, through a specific health check-up questionnaire every 6 months, or at any time through a specific interface on the study website. They were also asked to declare all currently taken medications and treatments via the check-up and yearly questionnaires. A search engine with an embedded exhaustive Vidal® drug database is used to facilitate medication data entry for the participants. Besides, our research team was the first in France to obtain authorisation by Decree in the Council of State (n°2013-175) to link data from our general population-based cohorts to medico-administrative databases of the National Health Insurance. Thus, data from the NutriNet-Santé cohort were linked yearly to these medico-administrative databases, providing detailed information about the reimbursement of medication and medical consultations. An incident type 2 diabetes case is detected when a participant has either reported the pathology at least twice or reported it once along with the use of a related medication.
All 1131 type 2 diabetes incident cases were primarily detected through the declaration by the participants of a type 2 diabetes diagnosed by a physician and/or diabetes medication use, in follow-up questionnaires. The questions were: “Have you been diagnosed with type 2 diabetes (if yes, indicate the date of diagnosis)” and “Are you treated for type 2 diabetes?”. ATC codes considered for type 2 diabetes medication were A10AB01, A10AB03, A10AB04, A10AB05, A10AB06, A10AC01, A10AC03, A10AC04, A10AD01, A10AD03, A10AD04, A10AD05, A10AE01, A10AE02, A10AE03, A10AE04, A10AE05, A10AE30, A10BA02, A10BB01, A10BB03, A10BB04, A10BB06, A10BB07, A10BB09, A10BB12, A10BD02, A10BD03, A10BD05, A10BD07, A10BD08, A10BD10, A10BD15, A10BD16, A10BF01, A10BF02, A10BG02, A10BG03, A10BH01, A10BH02, A10BH03, A10BX02, A10BX04, A10BX07, A10BX09, A10BX10, A10BX11, A10BX12.
In addition to the abovementioned questions about the diagnosis of type 2 diabetes mellitus and/or a medication report, two additional sources of confirmation were considered. First, linkage with the medico-administrative databases confirmed more than 80% of the cases surveyed (ICD-10 codes E11). Second, among participants who provided a blood sample at the clinical/biological examination, 85.3% of those with elevated fasting blood glucose (i.e., ≥1.26 g/L) had consistently reported a diagnosis of type 2 diabetes mellitus and/or medication. However, elevated blood glucose without any declaration of type 2 diabetes diagnosis or treatment was not considered specific enough to classify the participant as a type 2 diabetes case.
Statistical analyses
Participants from the NutriNet-Santé cohort who completed at least two 24HDRs during their first 2 years of follow-up, those who were not under- or over-energy reporters, and who did not have any prevalent type 1 or 2 diabetes at enrollment were included in the analysis (flowchart of participants presented in Fig. 1). Baseline participants’ characteristics were described as mean (SD) for quantitative variables and n (%) for qualitative variables for the overall population and per baseline sex-specific tertiles of total preservative food additives. A correlation matrix was generated to visualise the Spearman correlations between intakes of individual food additives (Supplementary Fig. 1). For each studied additive or group of additives, participants were categorised into lower, medium, and higher consumers defined as sex-specific tertiles if the additive was consumed by at least 66% of participants, or non-consumers, and consumers separated by the sex-specific median otherwise (cut-offs provided in Supplementary Table 6). The relationship between preservative food additive intake coded as categorical a cumulative time-dependent exposure and the incidence of type 2 diabetes were investigated using multivariable proportional hazard cause-specific Cox models with age as the time scale to account for the competing mortality risk during the follow-up period. Hazard ratios (HR) and 95% confidence intervals (95%CI) were calculated. Participants contributed person-time to the models from their age at enrollment in the cohort (which corresponds to the completion of the first set of 24HDRs) until their age at the date of type 2 diabetes ascertainment, type 1 diabetes diagnosis, death, last contact, or 31 December 2023, whichever occurred first. A counting process structure was used with cumulative time-dependent dietary variables updated every 2 years. Exposure during a specific period was calculated using a weighted average of the most recent 2-year period and prior periods, thereby using all available dietary record data. The time-to-event data structure was used with time-dependent dietary variables updated every 2 years. Exposure during one period was computed using a weighted average of the most recent 2-year period and prior periods. Each period contained averaged food additive intakes from the available dietary records within each 2-year period. The maximum number of 2-year periods was seven, to cover the maximum follow-up period of 14 years. A cumulative exponential decay weighting scheme was used to attribute lower weights to recent periods and higher weights to more ancient ones, given the fact that physio-pathological mechanisms underlying potential causal associations between additive intake and diabetes onset are expected to take several years (food additive intake consumed the month before diagnosis is less likely to have caused diabetes onset than more ancient usual exposure). Thus, for instance, intake during period 3 (years 5–6 of follow-up) = [intake during period 1 (years 1–2) + intake during period 2 (years 3–4) / 2 + intake during period 3 (years 5–6) / 4] / (1 + 1/2 + 1/4). The same methodology was applied to all dietary data. Cut-offs for food additives were updated for each follow-up period and are provided in Supplementary Table 1. For incident cases, dietary data collected during periods after type 2 diabetes diagnosis were not accounted for.
For incident cases, dietary data collected during periods after type 2 diabetes diagnosis were not accounted for. The principal model was adjusted for age (time-scale), sex, baseline BMI, height, physical activity, smoking status, number of smoked cigarettes in pack-years, educational level, family history of diabetes, number of dietary records completed, time-dependent daily intakes of energy without alcohol, alcohol, saturated fats, sodium, fibre, sugars, fruits and vegetables, dairy products, red and processed meats or heme iron (for nitrites and nitrates models only). Missing values for covariates were handled by a multiple imputation approach using additive regression, followed by bootstrapping, and predictive mean matching (n = 20 imputed dataset) as implemented in the Hmisc R package (version 5.1-0)65. Specifically, the imputation model included a comprehensive set of predictors deemed relevant to the missing covariates. Variables were incorporated to capture the underlying relationships and patterns. The choice of predictors (i.e., age, sex, family history of diabetes, physical activity, incident type 2 diabetes, education level, smoking status, BMI, energy intake, and alcohol intake) was guided by their known or hypothesised associations with the variables containing missing values. Missing values were imputed for the following variables: physical activity level (13.59% of missing values), BMI (2.76%), height (2.76%), smoking status (0.29%), number of smoked cigarettes in pack years (0.30%), education level (0.96%), and family history of diabetes (0.31%).
Moreover, whenever relevant, models were adjusted for the intake of the corresponding substance coming from naturally occurring sources. Associations between intakes from these natural sources and type 2 diabetes incidence were also tested. The proportional hazard assumption was tested using the Schoenfeld residual method (Supplementary Fig. 2) implemented in the survival R package (version 3.5-8)66. Restricted cubic splines with three knots covering each food additive distribution: 27.5th, 72.5th and 95th percentiles (Supplementary Fig. 3)67 were employed to investigate potential non-linear dose-response associations. When the log-linearity assumption was not rejected (p for non-linearity ≥0.05 in the Restricted Cubic Splines models), the p for linear trend was retained (obtained by coding the exposure as an ordinal categorical variable 1, 2, 3). When the assumption of log-linearity was not met (p for non-linearity <0.05), it was not adapted to calculate a p for linear trend; thus, the likelihood ratio overall p value was retained (obtained by coding the exposure as a non-ordinal categorical variable and calculating the likelihood ratio test between models with and without the studied food additive exposure variable). We have tested the associations between food preservative additive exposures and hip fracture (i.e., outcome with no expected causal relationship) as a “negative outcome control model”. We tested the proportion of the association between ultra-processed food68 intake and type 2 diabetes incidence that was mediated by food additive preservatives found associated with diabetes in this study, using the CMAverse R package (version 0.1.0)69 and the same adjustment variables as the main model. Sensitivity analyses were tested based on the main model: additional mutual adjustment for other preservative food additives intakes except the studied one (continuous, mg/d) (model 1); additional adjustment for the baseline weight proportion of ultra-processed food intake (model 2); additional adjustment for the diagnosis and/or treatment for at least one prevalent metabolic disorder (i.e. cardiovascular disease, dyslipidemia or hypertension) (model 3); additional adjustment for time-dependent intakes of total emulsifier and total artificial sweetener food additives (continuous, mg/d) (model 4) (these two categories of food additives have been associated with type 2 diabetes risk in NutriNet-Santé); additional adjustment for baseline intake of vitamin C (continuous, mg) and vitamin E (continuous, mg) from dietary supplements (model 5); additional adjustment for trans fatty acids intake (continuous, mg) (model 6); adjustment for PCA-derived dietary patterns rather than individual food groups (continuous, see Method for deriving dietary patterns by principal component analysis and corresponding factor loadings for determination of dietary patterns) (model 7); additional adjustment for time-dependent intakes of polyunsaturated fatty acids (continuous, g/d) and heme iron (continuous, mg/d) (model 8) (for preservative antioxidant food additives only, since antioxidant may counteract polyunsaturated fatty acid peroxidation by heme iron); follow-up starting at the end of the first 2-year period (model 9); without exclusion of under-reporters (model 10); use of marginal structural models with stabilised and truncated at 99th percentile inverse probability of treatment weighting as recommended by Young et al.70 (model 11); relaxing log-linearity assumption on covariates adding splines with the R package splines (version 4.3.3) (model 12). All statistical tests were two-sided, and p values < 0.05 were considered statistically significant. All statistical analyses were conducted with R version 4.3.3, except for the restricted cubic spline method, which was implemented with SAS version 9.467.
Method for deriving dietary patterns by principal component analysis and corresponding factor loadings
Dietary patterns were identified based on 20 food categories, using a principal component analysis conducted with the R package FactoMineR (version 2.8)71. The principal component analysis creates linear combinations (called principal components) of the initial set of variables, with the aim to group those that are correlated while explaining as much variation from the dataset as possible. We used the scree plot generated by the principal component analysis to select the retained principal components (with eigenvalues ≥ 2). For easier interpretation, we used the R “varimax” option to rotate the principal components orthogonally and maximise the independence of the retained principal components. The variable coefficients derived from the selected principal components are called factor loadings. A positive factor loading indicates a positive contribution of the variable to the principal component, whereas a negative factor loading indicates a negative contribution. For the interpretation of the two principal components selected, we considered the variables contributing the most to the component, i.e., with loading coefficients under −0.25 or over 0.25. We then label the principal components descriptively, based on the most contributing variables. Finally, we calculated an adherence score for each principal component and for each participant, using the food categories factor loadings to weigh the sum of all observed intakes. Thus, the adherence score measures a participant’s diet conformity to the identified dietary pattern intake pattern. In the analyses of dietary patterns, we identified a healthy pattern (explaining 10.88% of the variance), which was characterised by higher intakes of fish and seafood, fruits, unsweetened soft drinks, vegetables, and wholegrains, along with lower intakes of sweetened soft drinks. In contrast, we identified a Western pattern (explaining 7.9% of the variance), which was characterised by higher intakes of fat and sauces, potatoes and tubers, and soups and broths.
Reporting summary
Further information on research design is available in the Nature Portfolio Reporting Summary linked to this article.
Data availability
The raw data underlying this study are protected and are not available due to data privacy laws, since they are part of a running cohort with multiple ongoing investigations and are subject to national and European regulations for the protection of individual sensitive health data. However, researchers from public institutions without financial conflict of interest can submit a request to have access to the data for strict reproducibility analysis (systematically accepted) or for a new collaboration, including information on the institution and a brief description of the project and sources of funding to collaboration@etude-nutrinet-sante.fr. All requests will be reviewed by the steering committee of the NutriNet-Santé study, and an answer will be provided within 2 months. If the collaboration is accepted, a data access agreement will be necessary, and appropriate authorisations from the competent administrative authorities may be needed. The duration of data access is decided on a case-by-case basis, depending on the complexity of analyses to be run. In accordance with existing regulations, no personal identifying data will be accessible. Source data are provided with this paper.
Code availability
The R and SAS code used in this study is provided in Supplementary Materials R and SAS code for statistical analyses and on Code Ocean.
References
Debras, C. et al. Artificial sweeteners and risk of type 2 diabetes in the prospective NutriNet-Santé cohort. Diab. Care 46, 1681–1690 (2023).
Salame, C. et al. Food additive emulsifiers and the risk of type 2 diabetes: analysis of data from the NutriNet-Santé prospective cohort study. Lancet Diab. Endocrinol. 12, 339–349 (2024).
Srour, B. et al. Dietary exposure to nitrites and nitrates in association with type 2 diabetes risk: results from the NutriNet-Santé population-based cohort study. PLoS Med. 20, e1004149 (2023).
Payen De La Garanderie, M. et al. Food additive mixtures and type 2 diabetes incidence: results from the NutriNet-Santé prospective cohort. PLoS Med. 22, e1004570 (2025).
Open Food Facts. https://world.openfoodfacts.org/discover. Accessed 19 Jan 2024.
European Parliament & Council. Regulation (EC) No 1333/2008 of the European Parliament and of the Council of 16 December 2008 on Food Additives. Regulation (EC) No 1333/2008 (European Parliament & Council, 2008).
European Food Safety Authority (EFSA). Food additives. EFSA. https://www.efsa.europa.eu/en/topics/topic/food-additives (2024).
Tong, M. et al. Nitrosamine exposure causes insulin resistance diseases: relevance to type 2 diabetes mellitus, non-alcoholic steatohepatitis, and Alzheimer’s disease. J. Alzheimers Dis. 17, 827–844 (2009).
Tong, M., Longato, L. & de la Monte, S. M. Early limited nitrosamine exposures exacerbate high fat diet-mediated type 2 diabetes and neurodegeneration. BMC Endocr. Disord. 10, 4 (2010).
Ali, M. A., Eid, R. M. H. M. & Hanafi, M. Y. Vitamin C and E chronic supplementation differentially affect hepatic insulin signaling in rats. Life Sci. 194, 196–204 (2018).
Brachs, S. et al. Inhibition of citrate cotransporter Slc13a5/mINDY by RNAi improves hepatic insulin sensitivity and prevents diet-induced non-alcoholic fatty liver disease in mice. Mol. Metab. 5, 1072–1082 (2016).
Arnold, P. K. & Finley, L. W. S. Regulation and function of the mammalian tricarboxylic acid cycle. J. Biol. Chem. 299, 102838 (2023).
Panyod, S. et al. Common dietary emulsifiers promote metabolic disorders and intestinal microbiota dysbiosis in mice. Commun. Biol. 7, 1–14 (2024).
Hanks, L. J., Casazza, K., Judd, S. E., Jenny, N. S. & Gutiérrez, O. M. Associations of fibroblast growth factor-23 with markers of inflammation, insulin resistance and obesity in adults. PLoS ONE 10, e0122885 (2015).
Taghavi, F. et al. Potassium sorbate as an AGE activator for human serum albumin in the presence and absence of glucose. Int. J. Biol. Macromol. 62, 146–154 (2013).
Lampousi, A.-M., Lundberg, T., Löfvenborg, J. E. & Carlsson, S. Vitamins C, E, and β-carotene and risk of type 2 diabetes: a systematic review and meta-analysis. Adv. Nutr. 15, 100211 (2024).
Nguyen, N. N. et al. Dietary nitrate, nitrite, and nitrosamine in association with diabetes: a systematic review and meta-analysis. Nutr. Rev. 82, 1473–1481 (2024).
Akbari, S. et al. Effect of rosemary leaf powder with weight loss diet on lipid profile, glycemic status, and liver enzymes in patients with nonalcoholic fatty liver disease: a randomized, double-blind clinical trial. Phytother. Res. 36, 2186–2196 (2022).
Yu, E. A. et al. Plasma metabolomic analysis indicates flavonoids and sorbic acid are associated with incident diabetes: A nested case-control study among Women’s Interagency HIV Study participants. PLoS ONE 17, e0271207 (2022).
Lorenzo, C., Hanley, A. J., Rewers, M. J. & Haffner, S. M. Calcium and phosphate concentrations and future development of type 2 diabetes: the Insulin Resistance Atherosclerosis Study. Diabetologia 57, 1366–1374 (2014).
Recoules, C., Touvier, M., Pierre, F. & Audebert, M. Evaluation of the toxic effects of food additives, alone or in mixture, in four human cell models. Food Chem. Toxicol. 196, 115198 (2025).
Lu, X. et al. Effect of dietary intake of advanced glycation end products on biomarkers of type 2 diabetes: a systematic review and meta-analysis. Crit. Rev. Food Sci. Nutr. 0, 1–10 (2024).
Hrncir, T., Trckova, E. & Hrncirova, L. Synergistic effects of fructose and food preservatives on metabolic dysfunction-associated steatotic liver disease (MASLD): from gut microbiome alterations to hepatic gene expression. Nutrients 16, 3722 (2024).
Xiao, N. et al. Effects of potassium sorbate on systemic inflammation and gut microbiota in normal mice: a comparison of continuous intake and washout period. Food Chem. Toxicol. 184, 114443 (2024).
Xourafa, G., Korbmacher, M. & Roden, M. Inter-organ crosstalk during development and progression of type 2 diabetes mellitus. Nat. Rev. Endocrinol. 20, 27–49 (2024).
de la Monte, S. M., Tong, M., Lawton, M. & Longato, L. Nitrosamine exposure exacerbates high fat diet-mediated type 2 diabetes mellitus, non-alcoholic steatohepatitis, and neurodegeneration with cognitive impairment. Mol. Neurodegener. 4, 54 (2009).
Tirosh, A. et al. The short-chain fatty acid propionate increases glucagon and FABP4 production, impairing insulin action in mice and humans. Sci. Transl. Med. 11, eaav0120 (2019).
Venugopal, S. K., Devaraj, S., Yang, T. & Jialal, I. α-Tocopherol decreases superoxide anion release in human monocytes under hyperglycemic conditions via inhibition of protein kinase C-α. Diabetes 51, 3049–3054 (2002).
Tan, Y. & McClements, D. J. Improving the bioavailability of oil-soluble vitamins by optimizing food matrix effects: a review. Food Chem. 348, 129148 (2021).
Spreadbury, I. Comparison with ancestral diets suggests dense acellular carbohydrates promote an inflammatory microbiota, and may be the primary dietary cause of leptin resistance and obesity. Diab. Metab. Syndr. Obes. 5, 175–189 (2012).
Srour, B. et al. Ultraprocessed food consumption and risk of type 2 diabetes among participants of the NutriNet-Santé prospective cohort. JAMA Intern. Med. 180, 283–291 (2020).
Lane, M. M. et al. Ultra-processed food exposure and adverse health outcomes: umbrella review of epidemiological meta-analyses. BMJ 384, e077310 (2024).
Smith, L. H. Selection mechanisms and their consequences: understanding and addressing selection bias. Curr. Epidemiol. Rep. 7, 179–189 (2020).
Andreeva, V. A. et al. Comparison of dietary intakes between a large online cohort study (Etude NutriNet-Santé) and a Nationally Representative Cross-Sectional Study (Etude Nationale Nutrition Santé) in France: addressing the issue of generalizability in E-epidemiology. Am. J. Epidemiol. 184, 660–669 (2016).
ANSES. Etude Individuelle Nationale des Consommations Alimentaires 3 (INCA 3) (ANSES, 2017).
Calixto Andrade, G. et al. Consumption of ultra-processed food and its association with sociodemographic characteristics and diet quality in a representative sample of French adults. Nutrients 13, 682 (2021).
Kesse-Guyot, E. et al. Lessons learned from methodological validation research in E-epidemiology. JMIR Public Health Surveill. 2, e5880 (2016).
INSEE. Internet Access and Use in the European Union. https://www.insee.fr/fr/statistiques/2385835. Accessed 14 Feb 2025.
Pouchieu, C. et al. How computer literacy and socioeconomic status affect attitudes toward a Web-based cohort: results from the NutriNet-Santé study. J. Med. Internet Res. 17, e34 (2015).
Le diabète en France continue de progresser. Santé publique France. https://www.santepubliquefrance.fr/les-actualites/2024/le-diabete-en-france-continue-de-progresser. Accessed 14 Nov 2024.
Lailler, G. et al. Prevalence of prediabetes and undiagnosed type 2 diabetes in France: results from the National Survey ESTEBAN, 2014–2016. Diab. Res. Clin. Pract. 165, 108252 (2020).
Lassale, C. et al. Correlations between fruit, vegetables, fish, vitamins, and fatty acids estimated by web-based nonconsecutive dietary records and respective biomarkers of nutritional status. J. Acad. Nutr. Diet. 116, 427–438.e5 (2016).
Lassale, C. et al. Validation of a web-based, self-administered, non-consecutive-day dietary record tool against urinary biomarkers. Br. J. Nutr. 113, 953–962 (2015).
Touvier, M. et al. Comparison between an interactive web-based self-administered 24 h dietary record and an interview by a dietitian for large-scale epidemiological studies. Br. J. Nutr. 105, 1055–1064 (2011).
Rothman, K. J. No adjustments are needed for multiple comparisons. Epidemiology 1, 43 (1990).
Hercberg, S. et al. The Nutrinet-Santé Study: a web-based prospective study on the relationship between nutrition and health and determinants of dietary patterns and nutritional status. BMC Public Health 10, 242 (2010).
Lassale, C. et al. Validity of web-based self-reported weight and height: results of the Nutrinet-Santé study. J. Med. Internet Res. 15, e152 (2013).
Touvier, M. et al. Comparison between web-based and paper versions of a self-administered anthropometric questionnaire. Eur. J. Epidemiol. 25, 287–296 (2010).
Committee, I. R. Guidelines for data processing and analysis of the International Physical Activity Questionnaire (IPAQ)-Short and Long Forms. http://www.ipaq.ki.se/scoring.pdf; https://cir.nii.ac.jp/crid/1573950400545533440 (2005).
Vergnaud, A.-C. et al. Agreement between web-based and paper versions of a socio-demographic questionnaire in the NutriNet-Santé study. Int. J. Public Health 56, 407–417 (2011).
Moullec, N. et al. Validation du manuel-photos utilisé pour l’enquête alimentaire de l’étude SU.VI.MAX. Nutr. Clin. Metab. https://www.semanticscholar.org/paper/Validation-du-manuel-photos-utilis%C3%A9-pour-l%27enqu%C3%AAte-Moullec-Deheeger/3e18905fb9584e0766662ae6a052cac245eb1807 (1996).
Arnault, N. et al. Table de composition des aliments, étude NutriNet-Santé. [Food composition table, NutriNet-Santé study] (in French) (2013).
ANSES. Ciqual French Food Composition Table (ANSES, 2020).
Black, A. E. Critical evaluation of energy intake using the Goldberg cut-off for energy intake:basal metabolic rate. A practical guide to its calculation, use and limitations. Int. J. Obes. Relat. Metab. Disord. 24, 1119–1130 (2000).
Black, A. E. The sensitivity and specificity of the Goldberg cut-off for EI:BMR for identifying diet reports of poor validity. Eur. J. Clin. Nutr. 54, 395–404 (2000).
Schofield, W. N. Predicting basal metabolic rate, new standards and review of previous work. Hum. Nutr. Clin. Nutr. 39, 5–41 (1985).
Chazelas, E. et al. Exposure to food additive mixtures in 106,000 French adults from the NutriNet-Santé cohort. Sci. Rep. 11, 19680 (2021).
Codex General Standard for Food Additives (GSFA, Codex STAN 192-1995). Codex Alimentarius Commission (2018).
GSFA Online Food Additive Index. https://www.fao.org/gsfaonline/additives/index.html?lang=en (2025).
Approved additives and E numbers. Food Standards Agency. https://www.food.gov.uk/business-guidance/approved-additives-and-e-numbers. Accessed 19 Jan 2024.
Food Standards Australia & New Zealand. Australian Food Composition Database. Accessed 08 Sep 2024.
Chazelas, E. et al. Nitrites and nitrates from food additives and natural sources and cancer risk: results from the NutriNet-Santé cohort. Int. J. Epidemiol. 51, 1106–1119 (2022).
Srour, B. et al. Nitrites, nitrates, and cardiovascular outcomes: are we living “La Vie en Rose” with pink processed meats? J. Am. Heart Assoc. 11, e027627 (2022).
Résultats du contrôle sanitaire de l’eau du robinet - data.gouv.fr. https://www.data.gouv.fr/fr/datasets/resultats-du-controle-sanitaire-de-leau-du-robinet/. Accessed 16 Feb 2021.
Harrell, F. E. & Dupont, C. Harrell miscellaneous. R Package Version 4–0 (2018).
Therneau, T. A package for Survival Analysis in R. R package version 3.8-3. https://CRAN.R-project.org/package=survival (2024).
Desquilbet, L. & Mariotti, F. Dose-response analyses using restricted cubic spline functions in public health research. Stat. Med. 29, 1037–1057 (2010).
Martinez-Steele, E. et al. Best practices for applying the Nova food classification system. Nat. Food 4, 445–448 (2023).
Yaun, J. & VanderWeele, T. CMAverse: A Suite of Functions for Causal Mediation Analysis. (2021).
Young, J. G., Stensrud, M. J., Tchetgen, E. J. T. & Hernán, M. A. A causal framework for classical statistical estimands in failure time settings with competing events. Stat. Med. 39, 1199–1236 (2020).
Husson, F., Josse, J., Le, S. & Mazet, J. FactoMineR: Multivariate Exploratory Data Analysis and Data Mining. 2.12 https://doi.org/10.32614/CRAN.package.FactoMineR (2006).
Acknowledgements
We thank Thi Hong Van Duong, Régis Gatibelza, Amelle Aitelhadj and Aladi Timera (computer scientists) and Selim Aloui (IT manager); Julien Allegre, Nathalie Arnault, Nicolas Dechamp (data managers/statisticians); Paola Yvroud (health event validator & operational coordinator); Maria Gomes and Mirette Foham (participant support); and Marie Ajanohun, Tassadit Haddar (administration and finance) and Nadia Khemache (administrative manager) for their technical contribution to the NutriNet-Santé study. Finally, we warmly thank all the volunteers of the NutriNet-Santé cohort. The NutriNet-Santé study was supported by the following public institutions: Ministère de la Santé, Santé Publique France, Institut National de la Santé et de la Recherche Médicale (INSERM), Institut National de la Recherche pour l’agriculture, l’alimentation et l’environnement (INRAE), Conservatoire National des Arts et Métiers (CNAM), and University Sorbonne Paris Nord. This project has received funding from the European Research Council (ERC) under the European Union’s Horizon 2020 research and innovation program (grant agreement No 864219, ADDITIVES, M.T.), the French National Cancer Institute (INCa_14059, M.T.), the French Ministry of Health (arrêté 29.11.19, M.T.), the IdEx Université de Paris (ANR-18-IDEX-0001, M.T.), and a Bettencourt-Schueller Foundation Research Prize 2021 (M.T.). A.H. is funded by a PhD grant from the French Ministry of Health/Sorbonne Paris Nord University. This project was awarded the NACRe (French Network for Nutrition and Cancer Research) Partnership Label (M.T.). B.C.’s laboratory is supported by a Starting Grant (grant agreement No. ERC-2018-StG- 804135 INVADERS) and a Consolidator Grant (grant agreement No. ERC-2024-CoG-101170920) from the European Research Council (ERC) under the European Union’s Horizon 2020 research and innovation program, and the national program “Microbiote” from INSERM. This work only reflects the authors’ view, and the funders are not responsible for any use that may be made of the information it contains. Researchers were independent from funders. Funders had no role in the study design, the collection, analysis, and interpretation of data, the writing of the report, and the decision to submit the article for publication. Where authors are identified as personnel of the International Agency for Research on Cancer/World Health Organization, the authors alone are responsible for the views expressed in this article and they do not necessarily represent the decisions, policy or views of the International Agency for Research on Cancer/World Health Organization.
Ethics declarations
Competing interests
The authors declare no competing interests.
Peer review
Peer review information
Nature Communications thanks Emily Sonestedt, and the other, anonymous, reviewer(s) for their contribution to the peer review of this work. A peer review file is available.
Additional information
Publisher’s note Springer Nature remains neutral with regard to jurisdictional claims in published maps and institutional affiliations.
Supplementary information
Source data
Rights and permissions
Open Access This article is licensed under a Creative Commons Attribution-NonCommercial-NoDerivatives 4.0 International License, which permits any non-commercial use, sharing, distribution and reproduction in any medium or format, as long as you give appropriate credit to the original author(s) and the source, provide a link to the Creative Commons licence, and indicate if you modified the licensed material. You do not have permission under this licence to share adapted material derived from this article or parts of it. The images or other third party material in this article are included in the article’s Creative Commons licence, unless indicated otherwise in a credit line to the material. If material is not included in the article’s Creative Commons licence and your intended use is not permitted by statutory regulation or exceeds the permitted use, you will need to obtain permission directly from the copyright holder. To view a copy of this licence, visit http://creativecommons.org/licenses/by-nc-nd/4.0/.
About this article

Cite this article
Hasenböhler, A., Javaux, G., Payen de la Garanderie, M. et al. Associations between preservative food additives and type 2 diabetes incidence in the NutriNet-Santé prospective cohort. Nat Commun 16, 11199 (2025). https://doi.org/10.1038/s41467-025-67360-w
Received:
Accepted:
Published:
Version of record:
DOI: https://doi.org/10.1038/s41467-025-67360-w