ChatGPT launched ads in January 2026. 800 million users, $20 billion in annualized revenue, all sitting in continuous embedding space. No keywords, no categories, no auction machinery that fits.
Everyone’s treating this as a product problem: ad formats, placement, user experience. The harder problem is mathematical: how do you run an auction when the thing being sold is a region of continuous, high-dimensional space?
I think the answer is computational geometry.
There’s an interactive prototype where you can drag advertisers around and watch territories shift in real time.
Keywords Had Clean Markets
Google’s keyword auction is one of the most elegant market mechanisms ever deployed.
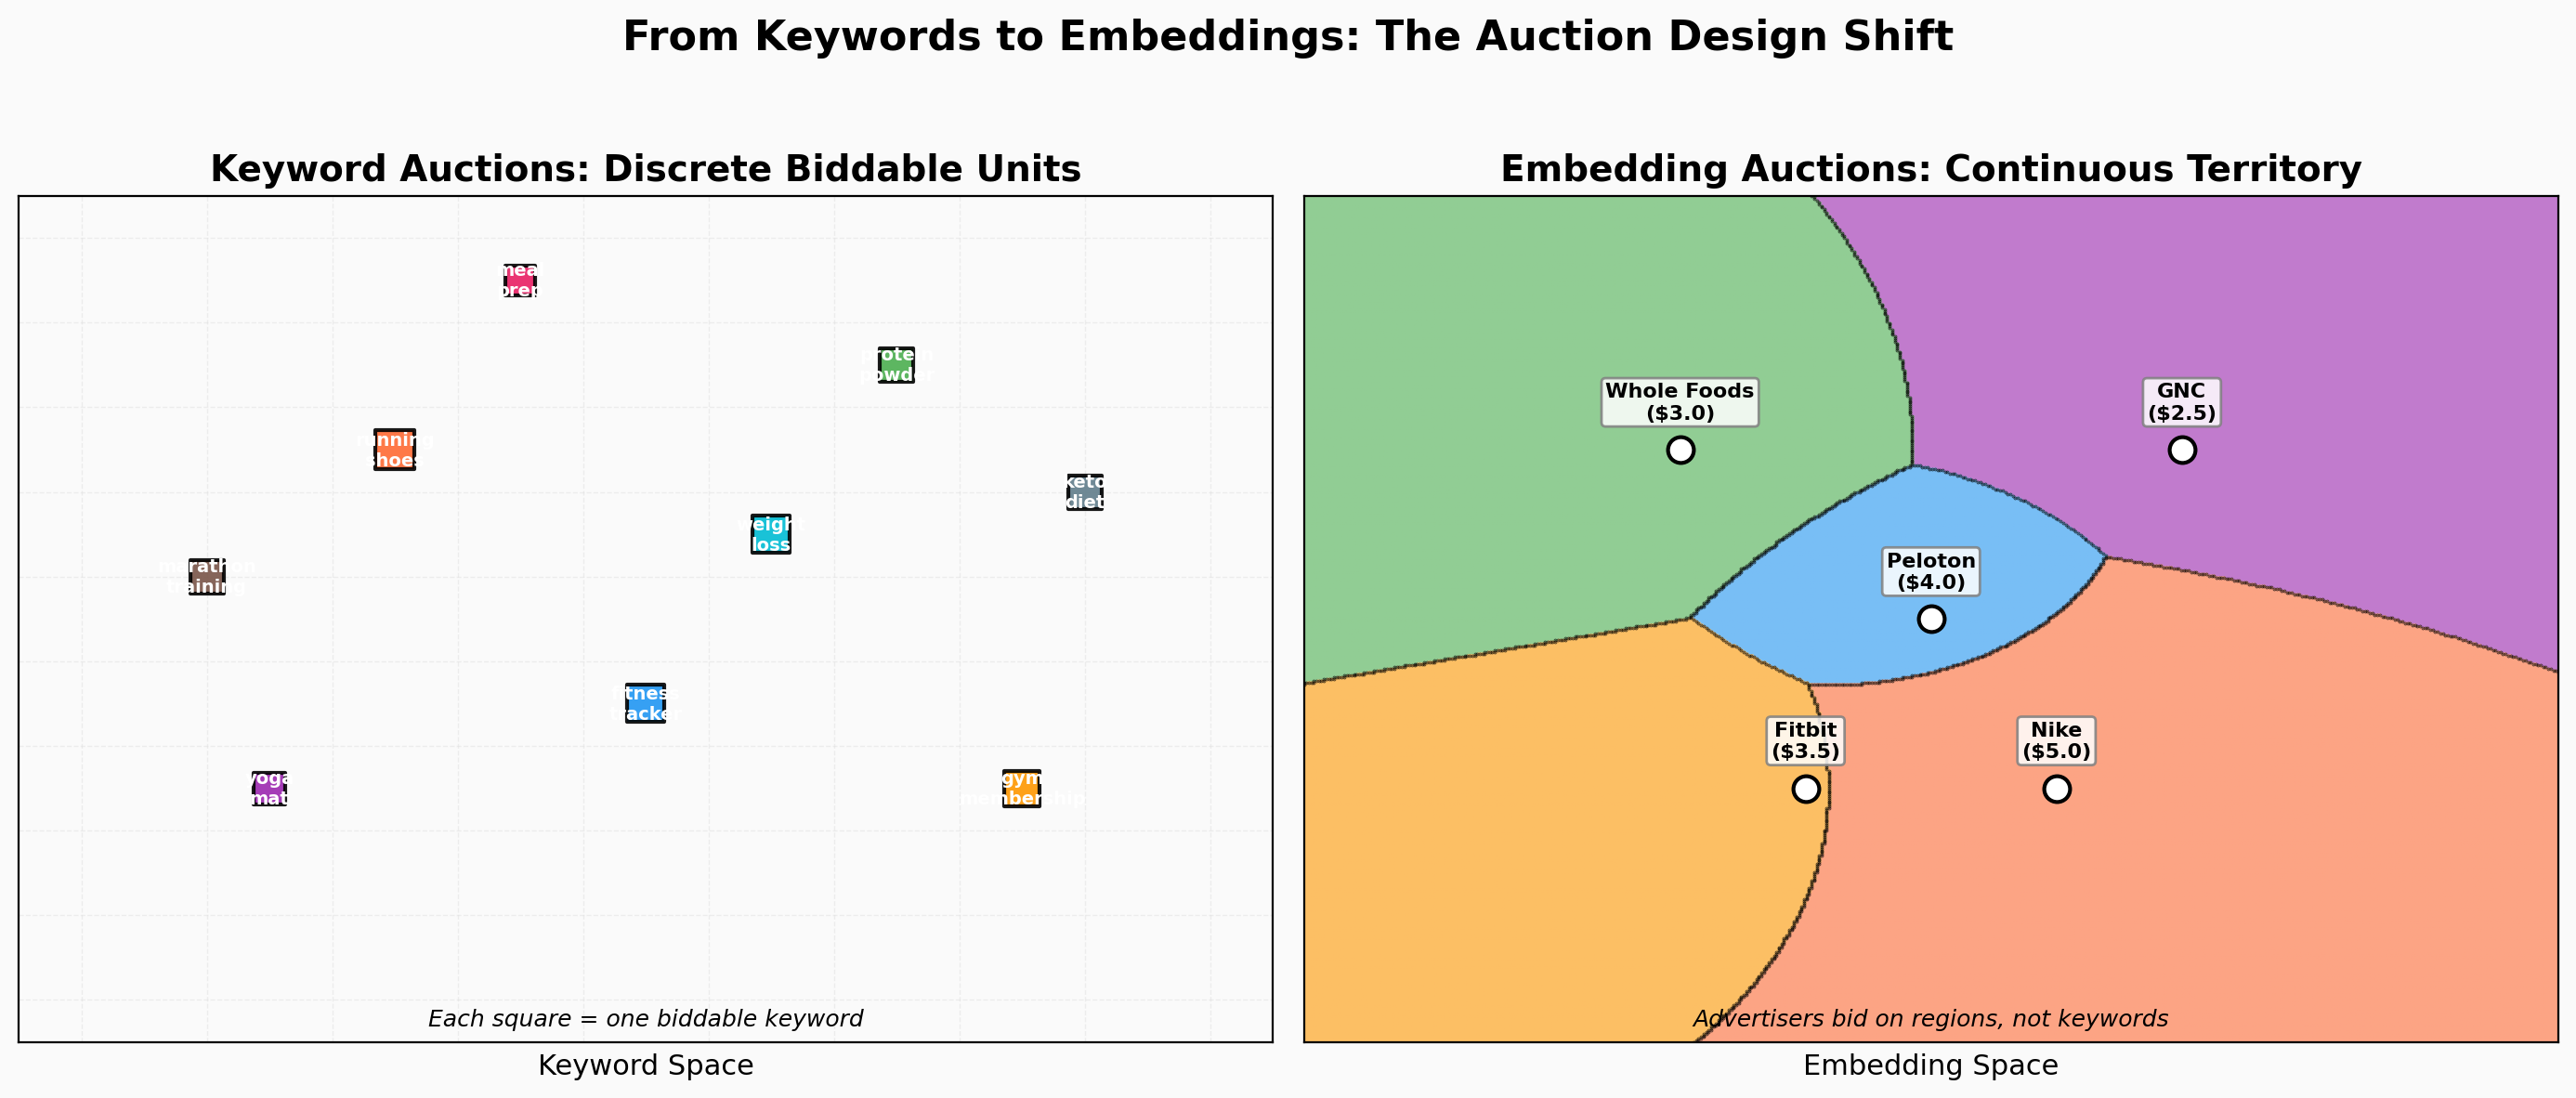
“Mesothelioma lawyer” costs ~$200 per click. That price exists because the mechanics are clean. A keyword is a discrete, atomic unit. You bid on it or you don’t. No ambiguity.
Second-price auctions clear efficiently. The winner pays the second-highest bid plus a penny. Edelman, Ostrovsky & Schwarz (2007) showed that the resulting equilibria in Google’s Generalized Second-Price auction are efficient and generate revenue at least as high as VCG, explaining why the mechanism survived at scale. Truthful bidding is approximately dominant. No game theory PhD required.
Budget forecasting is tractable: count searches, multiply by win rate, multiply by bid. Predict next month’s spend within 10-15%.
This machinery generated $238 billion in Google search ad revenue in 2025. It works because keywords are discrete and unambiguous.
Embeddings Break Everything
A ChatGPT conversation is a trajectory through continuous space.
“What’s a good running shoe for someone training for their first marathon who has flat feet and a budget under $150?” That doesn’t map to a keyword. It maps to a point in high-dimensional embedding space, encoding topic (running, footwear), intent (purchase-ready), specificity (first marathon, flat feet), and price sensitivity (budget constraint) simultaneously.
An “impression” is a point in continuous space. Advertisers want a region.
Nike wants every conversation about running shoes. But also marathon training, fitness gear comparisons, athletic lifestyle content. Their interest is a fuzzy, continuous region that bleeds into adjacent topics. Two advertisers compete fiercely for “running shoes” but not at all for “trail running philosophy.” Their regions overlap in complex ways.
Three things that worked with keywords now break:
- What do you bid on? There’s no discrete unit. You can’t enumerate “all possible conversation embeddings.”
- How do you clear the market? Overlapping fuzzy regions don’t have clean winner determination.
- How do you predict spend? Your win rate depends on the geometry of every competitor’s value function.
Power Diagrams
Here’s the end-to-end picture. An advertiser says: “I want budget-conscious marathon beginners.” The platform embeds that into the same space as user conversations. It becomes a point (center) with a radius (reach). A bid determines how much territory that point commands. The power diagram partitions the entire embedding space into advertiser territories, and VCG payments tell each advertiser what their territory costs.
Natural language in, price out, geometry in the middle. No keywords. No categories.
The math: if you model each advertiser’s value as a function of distance in embedding space, the optimal allocation has a known geometric structure called a power diagram.
Picture a 2D map: “topic” on one axis, “intent” on the other. Each advertiser sits at a point (their ideal customer) with a bid that determines how far their influence extends.
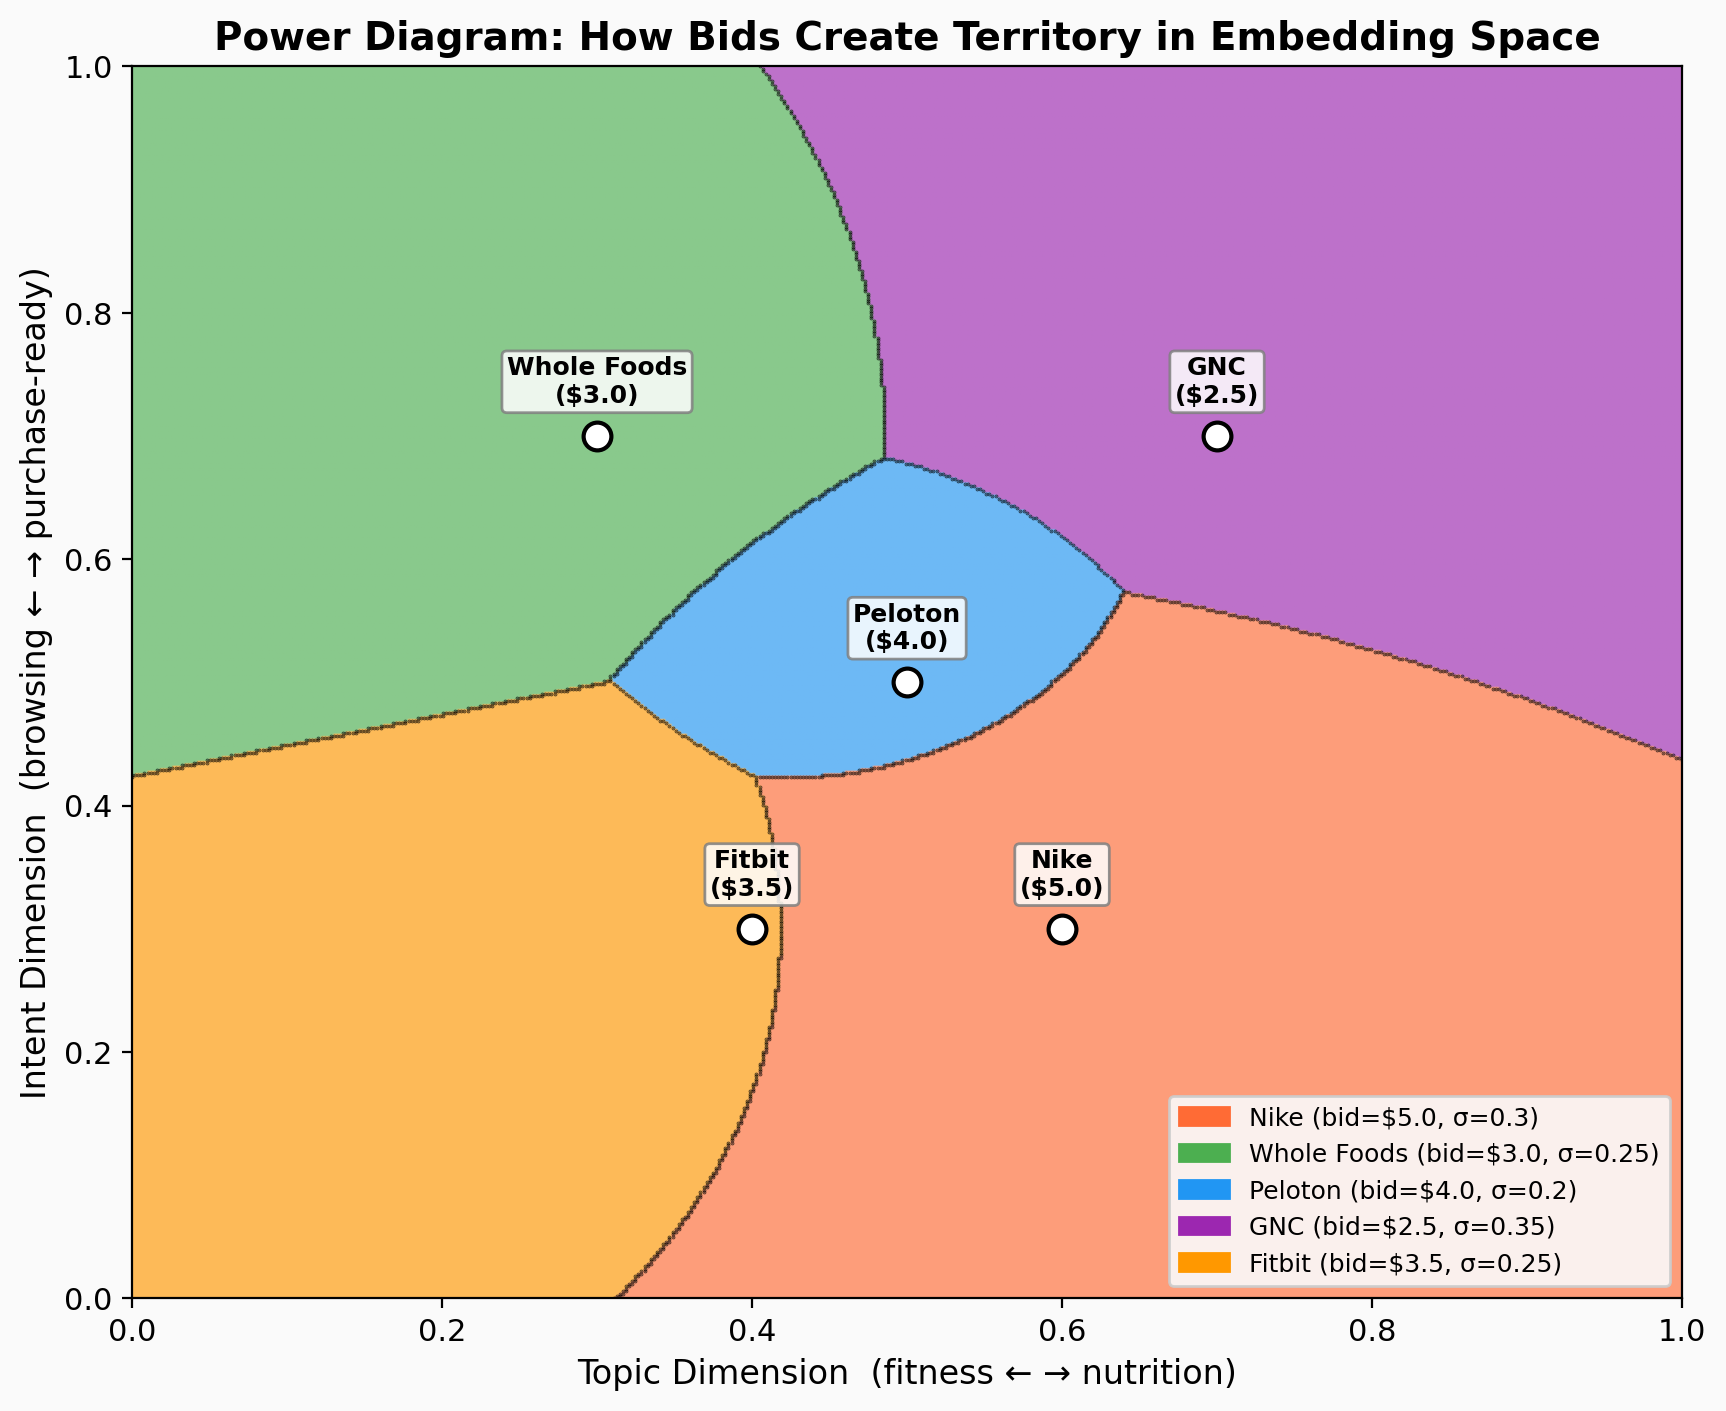
At any point, the winner is the advertiser with the highest bid-adjusted proximity. For each advertiser i with center c_i, bid b_i, and reach σ_i, the score at point x is:
score_i(x) = log(b_i) - ||x - c_i||² / σ_i²
Highest score wins. This creates a power diagram, a generalization of Voronoi diagrams where weights (bids) shift the boundaries.
Concrete example. Nike at center (0.6, 0.3) with bid $5.00 and reach σ=0.3. Peloton at (0.5, 0.5) with bid $4.00 and σ=0.2. At point x=(0.45, 0.35):
Nike’s score: log(5.0) − (0.45, 0.35) − (0.6, 0.3) ² / 0.09 = 1.61 − 0.28 = 1.33 Peloton’s score: log(4.0) − (0.45, 0.35) − (0.5, 0.5) ² / 0.04 = 1.39 − 0.63 = 0.76
Nike wins. Higher bid and closer proximity both contribute. Move the point toward (0.5, 0.5) and Peloton’s proximity advantage eventually overcomes Nike’s bid advantage. That crossover is the power diagram boundary.
Properties:
- Higher bids = bigger territory. Double your bid, your boundaries push outward.
- Boundaries are where bid-adjusted distances equal. The border between Nike and Peloton is where Nike’s bid advantage exactly offsets Peloton’s proximity advantage. These boundaries are hyperplanes (straight lines in 2D).
- The math is well-studied. Power diagrams have been around since the 1980s. Algorithms for constructing, querying, and integrating over them are known and efficient.
The d²/σ² penalty is a conversion model. Gaussian decay: P(convert) = exp(-d²/2σ²). Conversion probability is highest at center and drops with distance. If the bid is the advertiser’s margin, the scoring function ranks by expected value: margin × P(conversion).
Why Gaussian? If you know two things about a conversion curve (where it peaks and how wide it is), the Gaussian is the maximum entropy distribution: the least biased guess you can make. Anything else imports assumptions you don’t have evidence for.
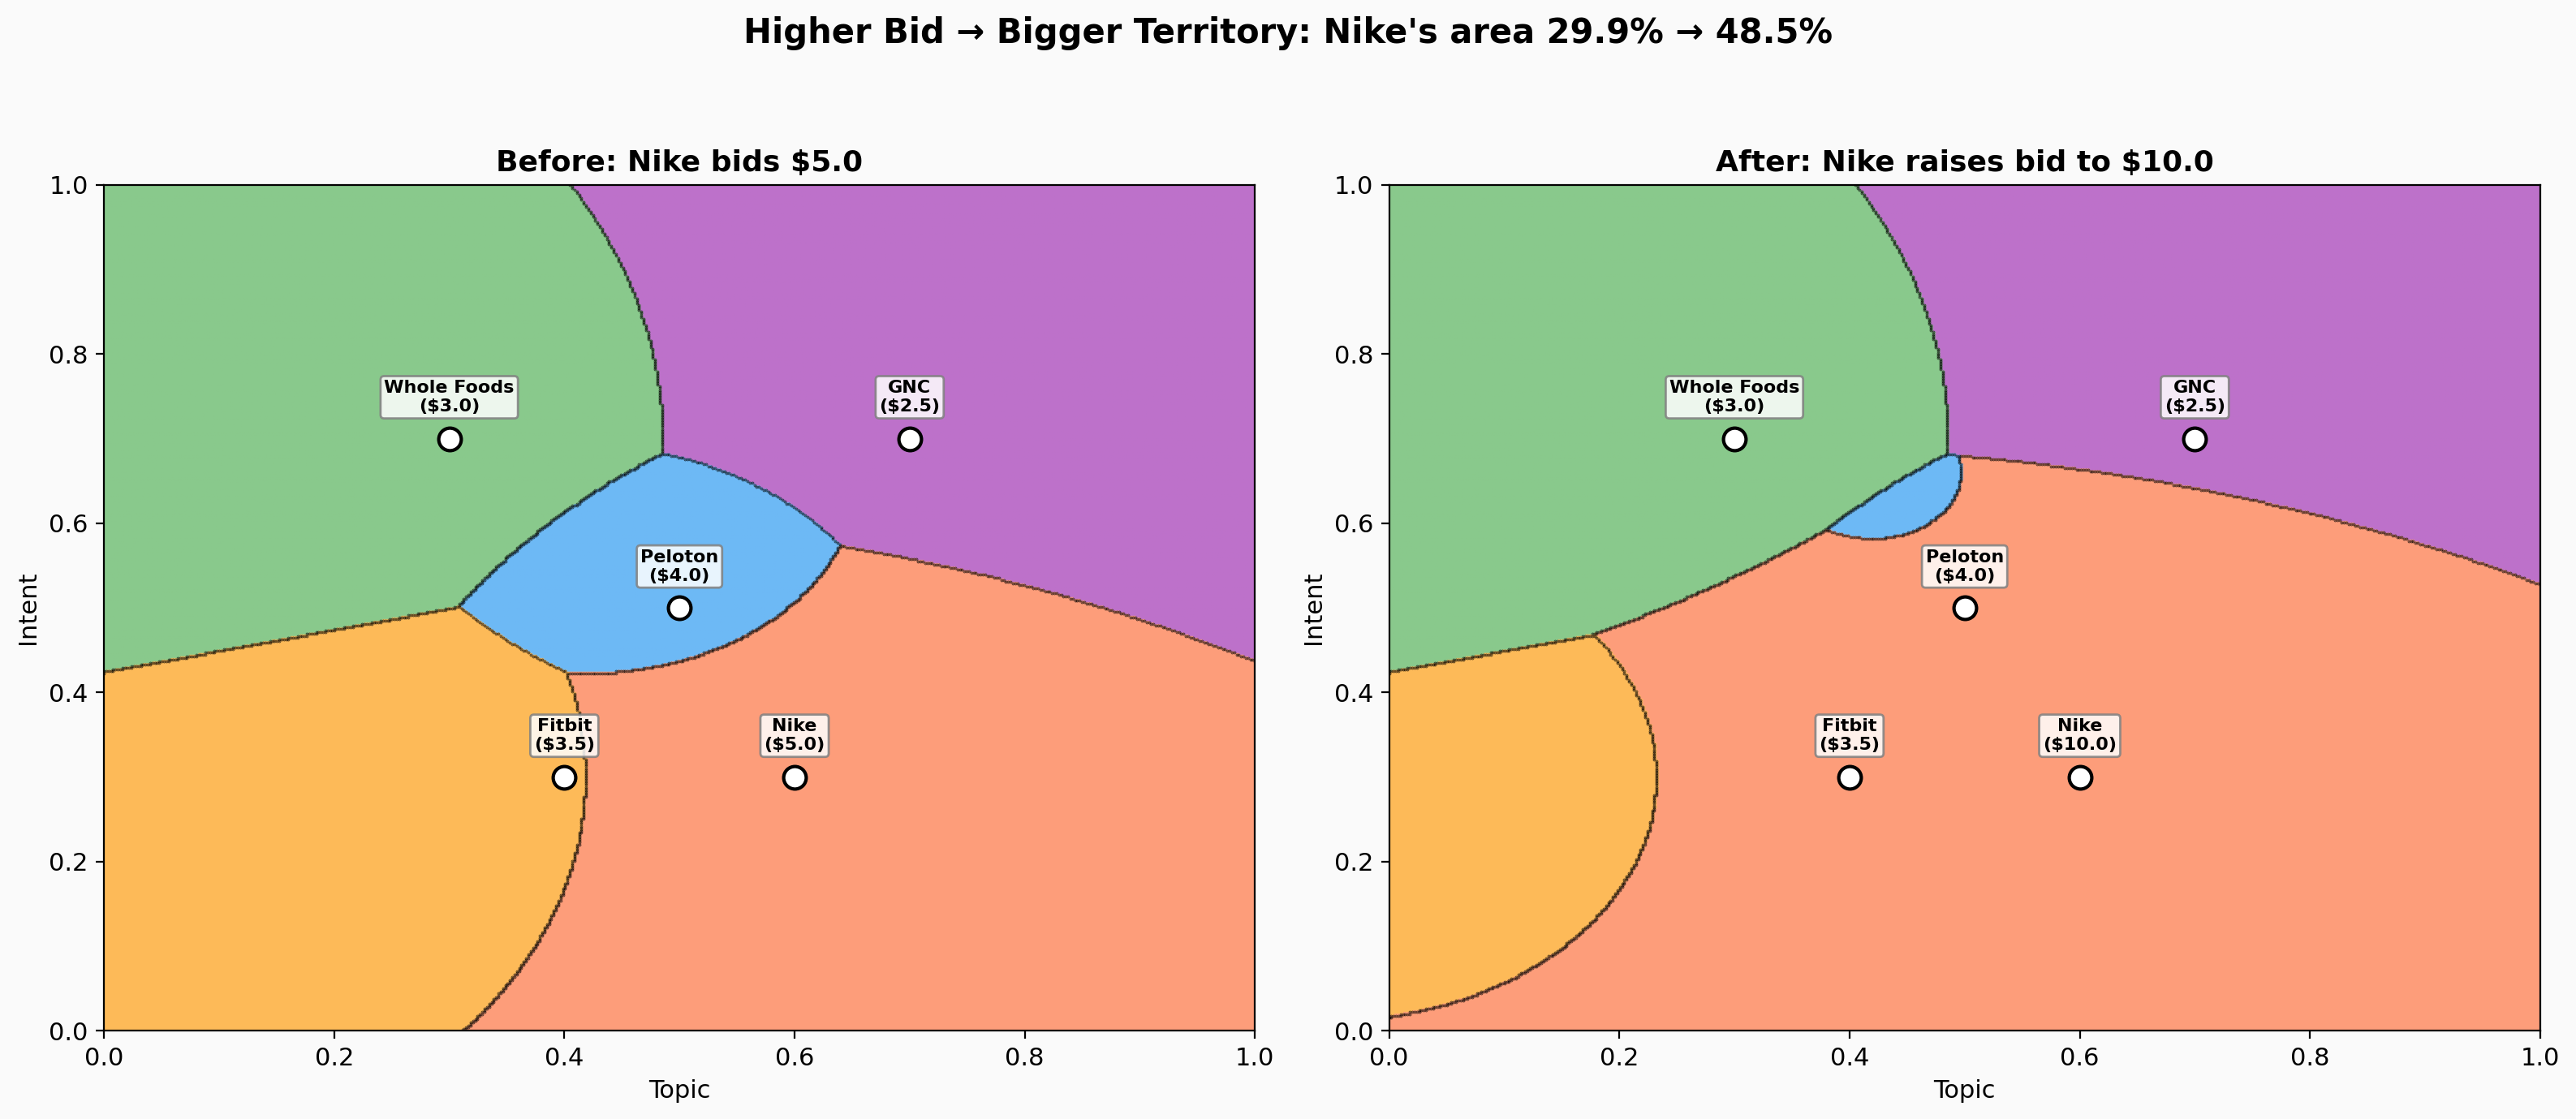
When Nike doubles its bid from $5 to $10, its territory expands from 30% to nearly 50% of the space — eating into every competitor’s region. This is the continuous analog of outbidding someone on a keyword, except it happens along a frontier, not at a single point.
Three Levers, Three Players
The scoring function has three parameters: σ, τ, and log(b). Each belongs to a different player and protects against a different failure.
Why It Gets Hard
The clean story holds when advertisers have isotropic preferences: they care equally about all dimensions, symmetric bell curve around their ideal point. Real preferences are messier.
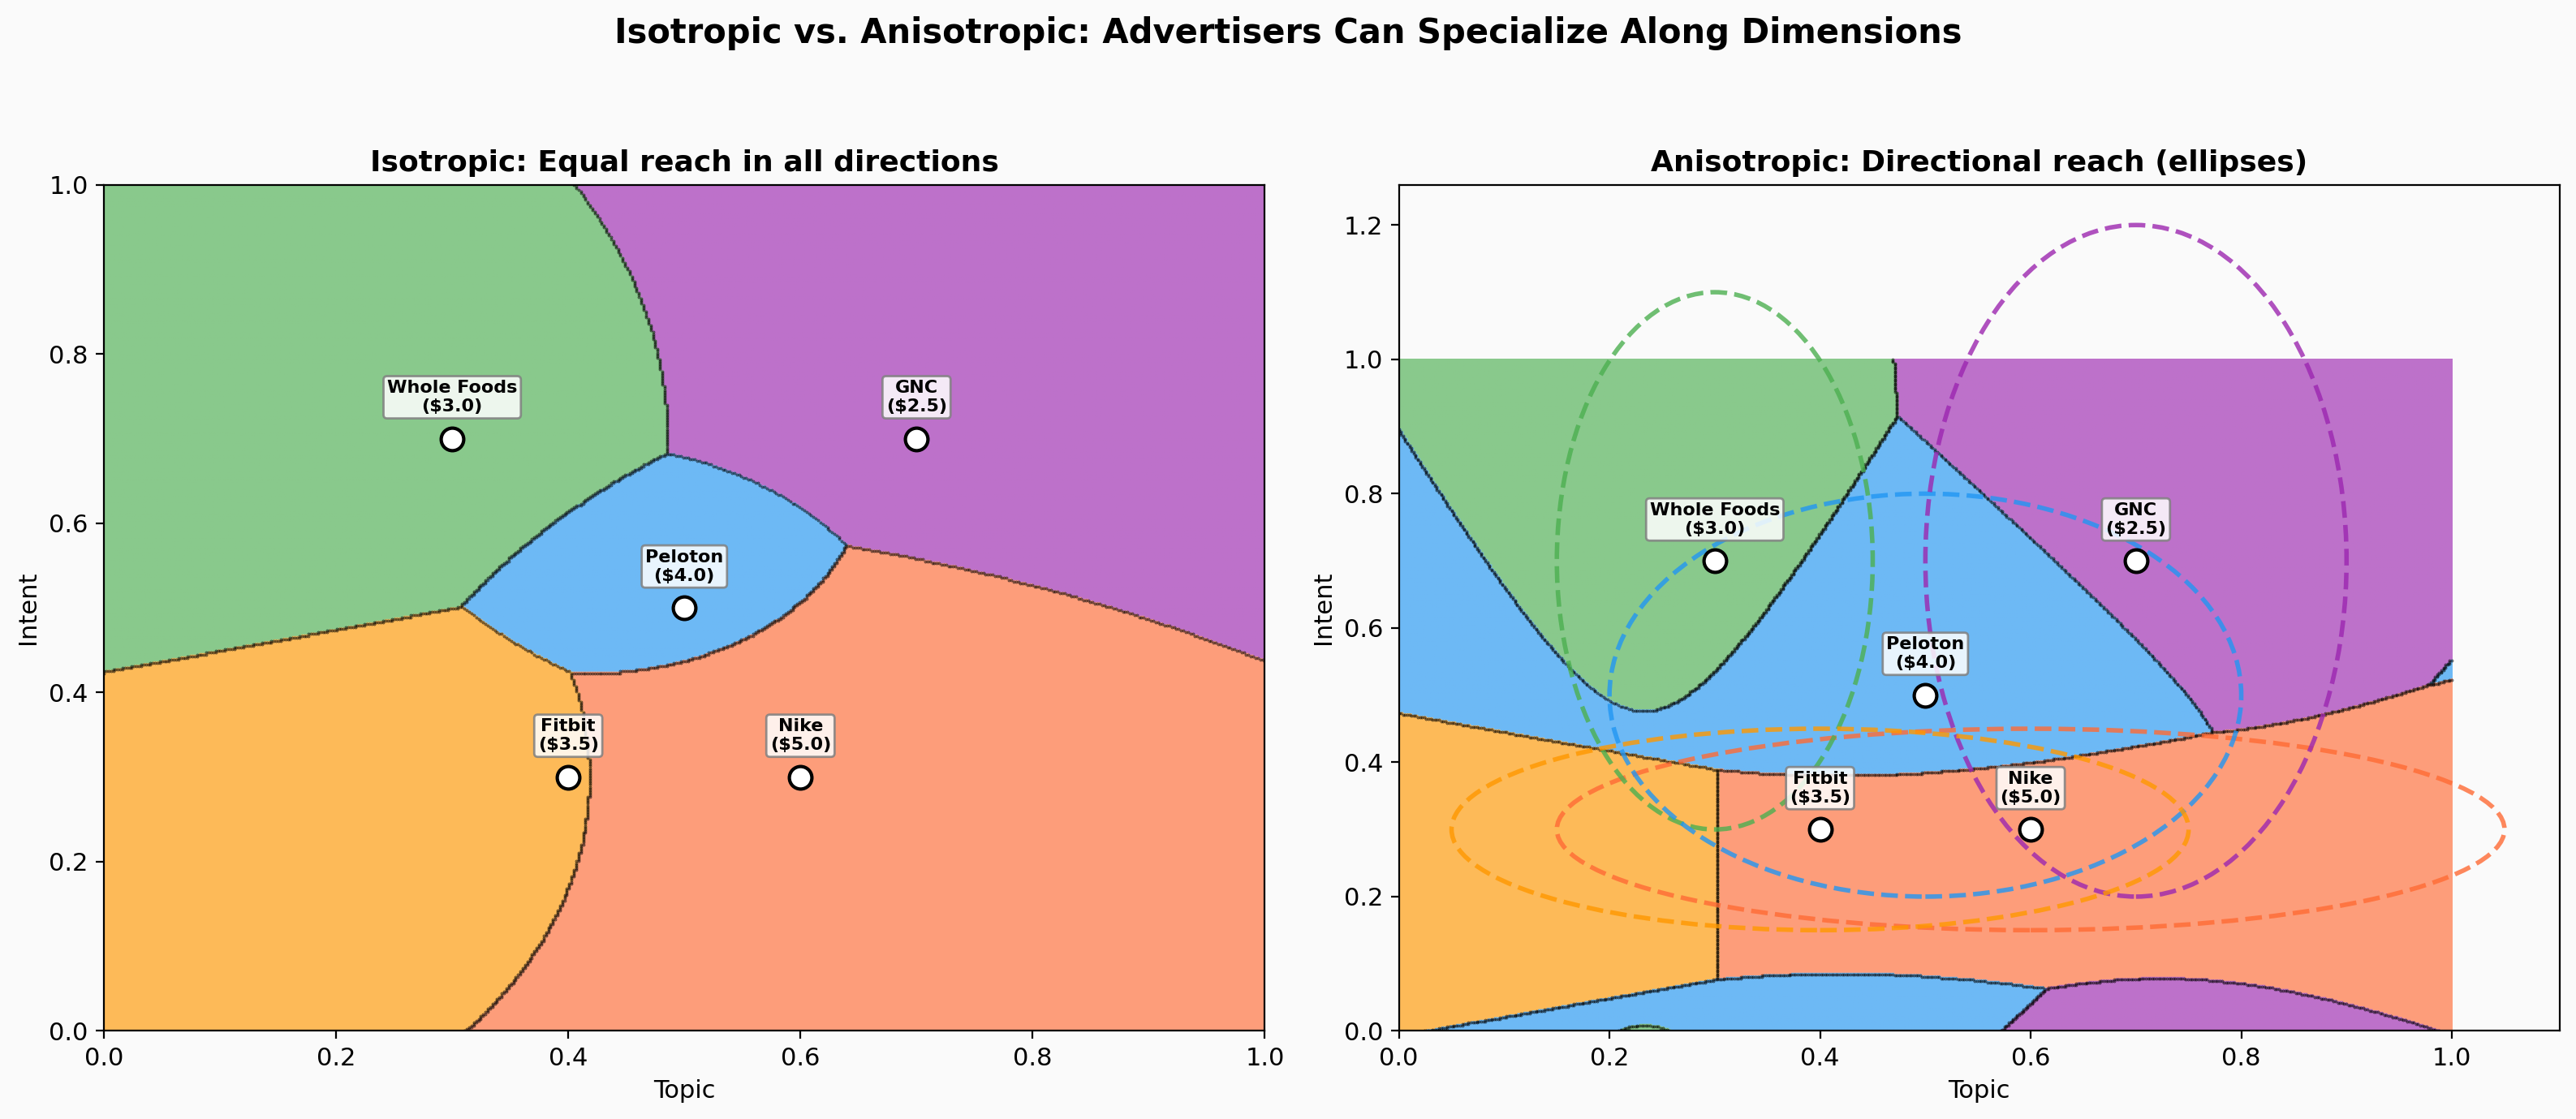
Anisotropic preferences. Nike cares far more about purchase intent than the specific sport. Their value function is an ellipse, not a circle. When advertisers have directional preferences, boundaries become quadric surfaces (curved lines in 2D). Still computable, but the clean hyperplane structure is gone.
Multimodal preferences. A bank wants “mortgage calculators” AND “retirement planning,” two separate clusters. Their value function is a mixture of Gaussians. Boundaries become level sets of Gaussian mixture sums, arbitrarily complex. The clean geometry breaks down.
Real-time constraints. An ad auction needs a winner in under 10ms. For the isotropic case, you precompute a spatial index and find the winner in O(log N). For anisotropic or mixture cases, you’re evaluating every advertiser, O(N) per impression. Thousands of advertisers blow the latency budget.
| Preference Type | Boundary Shape | Winner Determination | Incentive Compatible? |
|---|---|---|---|
| Isotropic Gaussian | Hyperplanes | O(log N) | Yes (VCG) |
| Anisotropic Gaussian | Quadric surfaces | O(N) | Approximately |
| Mixture of Gaussians | Arbitrary level sets | O(NK) | Open question |
It’s Real Estate
Embedding space is real estate.
Different regions have wildly different property values based on traffic density. “General fitness” gets heavy foot traffic. “Niche hobby” is quieter but visitors are deeply engaged.
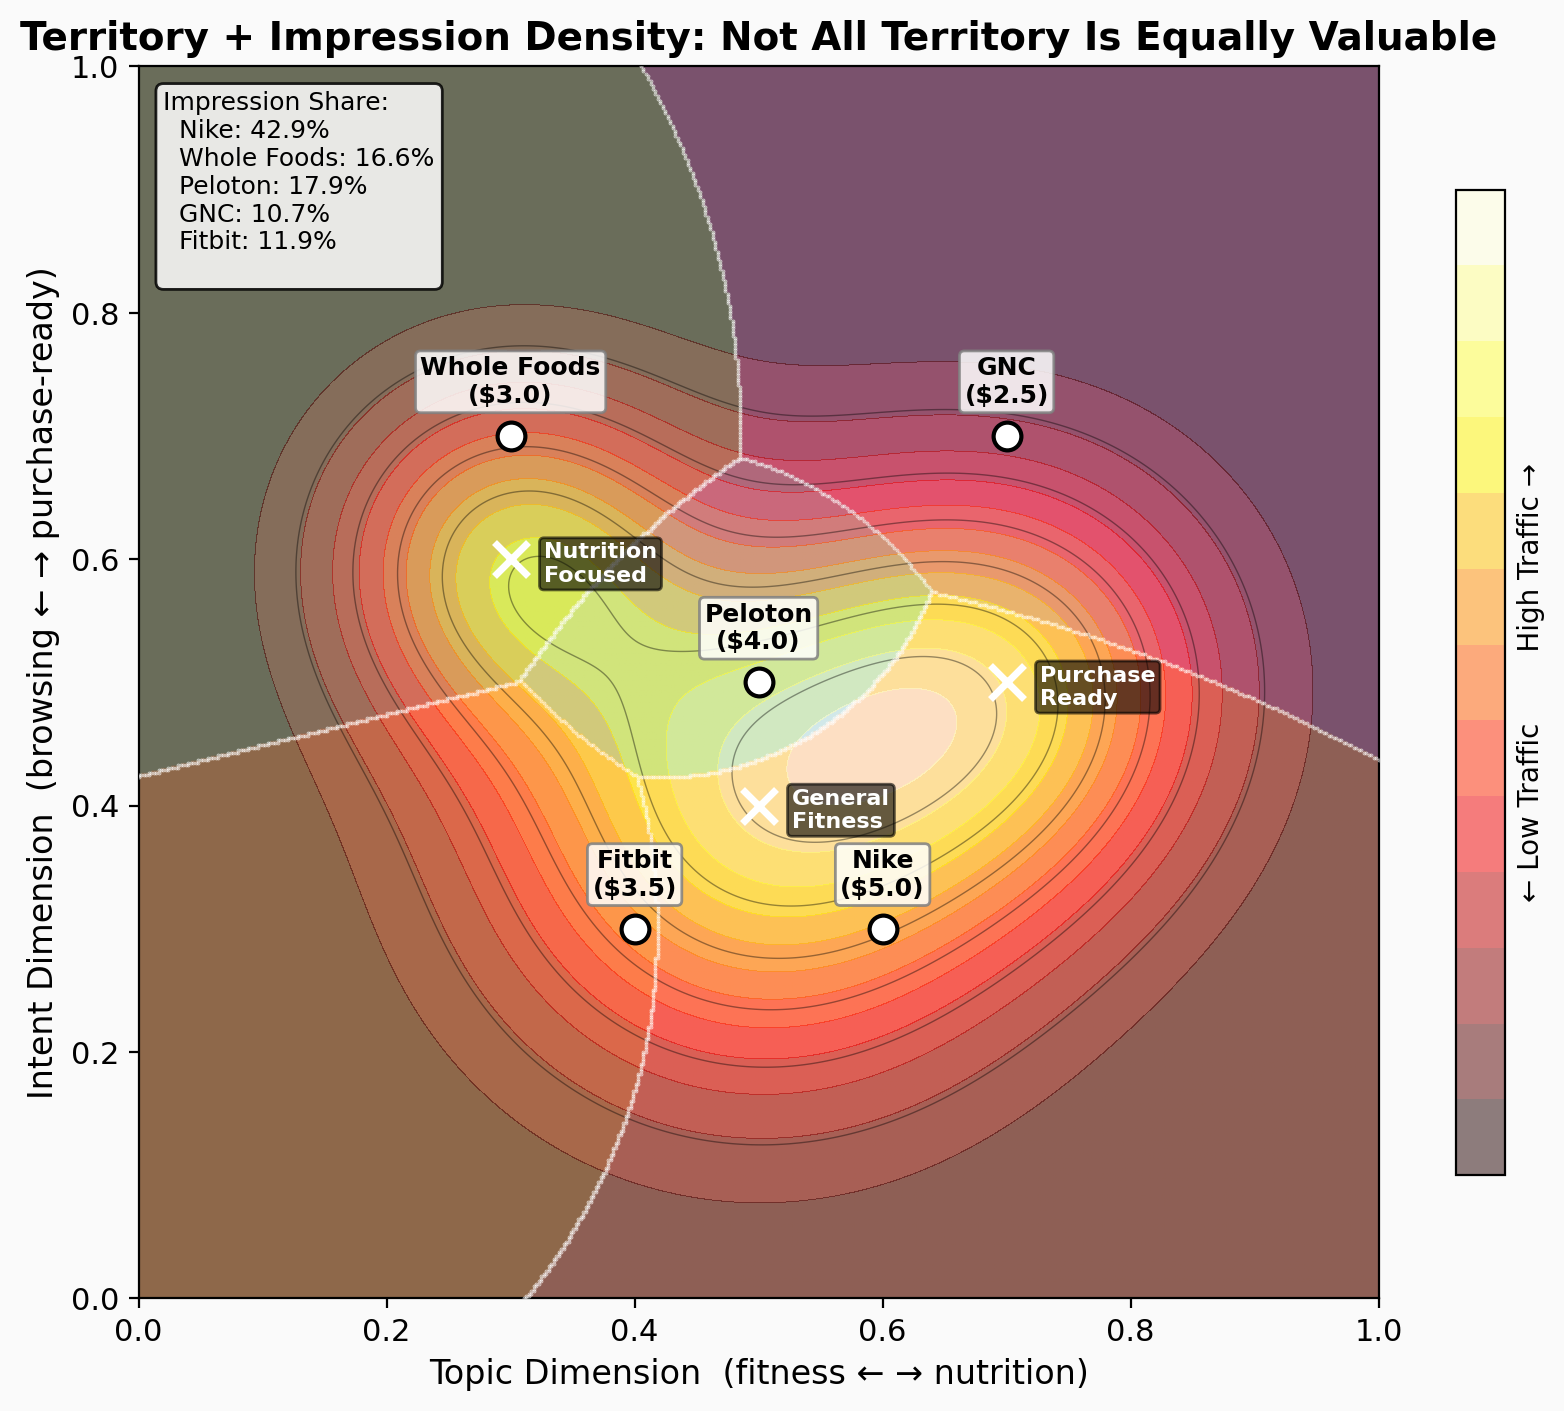
Not all territory is equally valuable. Peloton (blue) controls the smallest area but sits in the densest traffic region: 5.3% of territory captures 17.9% of impressions. Nike controls the largest area, but what matters is impression-weighted territory. A small lot on a busy street beats a ranch in the desert.
The analogy extends:
- Zoning: OpenAI excludes politics, health, and mental health from ads, creating exclusion zones where no advertiser can operate.
- Leasing, not buying: Your territory shifts as competitors adjust bids. A new competitor enters, everyone’s territory shrinks.
- Property value shifts: Seasonal events change traffic patterns. “Running shoes” peaks in January (New Year’s resolutions), dips in November.
- Generative ads: The same product gets different pitches depending on the neighborhood. A running shoe ad near “beginner marathon training” sounds different than near “competitive ultrarunning.” The creative itself is a function of position.
What Industry Does Today
The current approach: discretize it.
The IAB maintains 698 content taxonomy categories. Every conversation gets classified into buckets, advertisers bid on them, and standard RTB auctions clear each one.
It works. It’s fast, compatible with existing infrastructure, and advertisers understand categories. Companies like Seedtag and GumGum use embeddings internally (GumGum targets <10ms end-to-end) but still output IAB categories for the auction layer.
But the value of embedding-based targeting is precisely the nuance that discretization throws away. Consider:
- “What protein powder tastes good in smoothies?” → IAB: Health & Fitness / Nutrition
- “I need a high-protein meal plan for marathon training on a budget” → IAB: Health & Fitness / Nutrition
Same category. Completely different customers. The second is further along the purchase funnel, has a sports context, and is price-sensitive. With category targeting, both get the same treatment.
Power diagrams instead of category buckets would preserve this signal. The boundary between two advertisers is a continuous frontier shaped by bids and preferences.
What’s Still Unsolved
This is a framework, not a solution. Deploying it requires solving several hard problems:
Representation. How do advertisers express preferences over continuous high-dimensional space? Isotropic Gaussians are tractable but limited. Mixtures are expressive but intractable. There needs to be a sweet spot: expressive enough for real advertisers and structured enough for efficient clearing.
Truthful bidding. VCG payments make truthful bidding optimal for the isotropic case. For anisotropic and mixture preferences, the incentive properties are unclear.
Budget pacing. In keyword auctions, you know your win rate per keyword, you can predict spend. In power diagram auctions, your spend depends on the geometry of all competitors. Nike raises their bid, Peloton’s territory shrinks, Peloton’s budget drains slower, Peloton bids higher, Nike shrinks back. Reliable forecasting in this setting is hard.
Speed. Isotropic case admits fast spatial indexing (kd-trees, ball trees). General case requires approximation schemes, such as quantizing anisotropic preferences into multiple isotropic “virtual advertisers,” trading fidelity for speed.
Equilibrium. Keyword auctions converge quickly because the strategy space is simple. In continuous space, the strategy space is infinite-dimensional. Do power diagram auctions even converge?
The Game Theory
The auction rules create a multi-player game between advertisers, the platform, and users. Whether it reaches a stable equilibrium is the harder question.
Advertiser vs. Advertiser
VCG-like payments make truthful bidding dominant: you can’t gain by lying about what an impression is worth. But advertisers don’t just choose a bid. They choose where to plant their flag and how wide to cast their net.
An advertiser can profitably misreport their center. If impression density peaks at (0.5, 0.4) and Nike’s true center is (0.6, 0.3), Nike gains by declaring (0.55, 0.35), shifting toward the traffic. VCG payments penalize this somewhat, but imperfectly.
The Hotelling model predicts what convergence looks like: advertisers spread out along the most valuable dimension (probably purchase intent) and cluster on secondary ones. Like a commercial strip where every store is on the same street at different addresses.
Platform vs. Advertisers
The platform sees all N bid vectors simultaneously. Each advertiser sees only their own win rate and spend. N² information vs. N; the asymmetry grows quadratically. The platform can set opaque reserve prices, offer “bid suggestions” that happen to maximize platform revenue, and reveal just enough to keep advertisers bidding.
This is Google Ads today, but worse for advertisers. With keywords, you can at least see what you’re bidding on. In continuous embedding space, the thing you’re bidding on is abstract and high-dimensional. The platform controls the map. Tenants can only see their own lease terms.
Platform vs. Users
OpenAI’s tiered pricing (free with ads, Plus/Pro without) is a self-selection mechanism. Users who value attention most pay for premium. The rest have revealed they’ll tolerate ads. The platform can push ad load higher because the most ad-sensitive people already left.
But the platform is simultaneously the landlord (selling territory), the city planner (designing the space), and the tour guide (generating content). These roles conflict.
If generative ads mean the platform creates ad copy tailored to position in embedding space, there’s a subtle incentive to steer conversations toward high-value advertising neighborhoods. “Running shoes” is worth more than “Stoic philosophy.” OpenAI claims “answer independence.” But the incentive is structural. It’s a city planner who also owns commercial real estate: the zoning decisions will always be suspect.
Does It Converge?
Short run, probably yes. VCG keeps bidding roughly honest, tiered pricing sorts users, the platform extracts rent via information asymmetry.
Long run, three forces make it fragile:
Budget depletion cascades. Territory shifts continuously with bids, but budget depletion is discontinuous: you either have budget or you don’t. This mismatch creates oscillation. The “equilibrium” is probably a limit cycle, not a fixed point. Boom-bust cycles, like actual real estate.
Platform competition. LLM platforms have weak network effects. Perplexity offers “fewer ads, same quality,” users can switch easily. No one platform has Google’s lock-in with search.
Content steering. If users notice free-tier answers are subtly biased toward advertisable topics, trust collapses overnight. The platform has to tie its own hands, and it’s not clear what enforcement mechanism exists beyond reputation.
Nobody knows if a stable equilibrium exists here. VCG for truthful bidding, Myerson for revenue optimization, Hotelling for spatial competition. They don’t compose cleanly when you combine continuous space, generative content, and multi-sided platform dynamics. Real estate markets don’t have clean equilibria either. They have cycles, bubbles, regulation, and path dependence.
The most important open question: does the game converge to something stable, or is embedding-space advertising inherently turbulent?
New Territory
Keywords gave us discrete combinatorial auctions. Embeddings demand continuous geometric allocation, and the game theory of continuous territorial competition is far less understood.
Power diagrams are the continuous analog of keyword auctions, clean in the isotropic case, with a path toward more expressive models. But the full problem (expressive preferences, truthful bidding, budget management, real-time computation, and multi-player equilibrium) is wide open.
The ChatGPT ad market alone could be $10B+ annually within five years. The company that solves the geometry owns the auction infrastructure. The company that solves the game theory owns the market. These might not be the same company.
Written with Claude Opus 4.6 via Claude Code. I directed the research; Claude wrote proofs, ran experiments, built the prototype, and drafted prose. Idea to finished deliverables: one afternoon.
The game theory in this post is speculative, mapping the problem space, not claiming settled conclusions.
Part of the Vector Space series.