
A few years ago, Biella Coleman, an anthropologist studying hacker culture, observed that the events surrounding the Snowden leaks constitute a "critical event" in the development of hacker culture, in the sense that they were transformative and set things on a new, politically intensified course. There have been several previous critical events, including Operation Sundevil chronicled in Bruce Sterling's The Hacker Crackdown, that have been similarly consequential in shaping the politics and culture of hackers.
I suspect that the ongoing pandemic will turn out to be another such critical event, not just for the sorts of issues raised by technological efforts to contain the virus itself, but for the myriad digitally mediated social and cultural phenomena that emerged or accelerated during the lockdowns. It is hard to say what, exactly, its upshot will be, and it is still too early for any definite proclamations. Here I just want to deal with one small piece of the puzzle: the kinds of side projects self-described hackers have taken on since the first COVID–19 lockdowns.
The significance of side projects
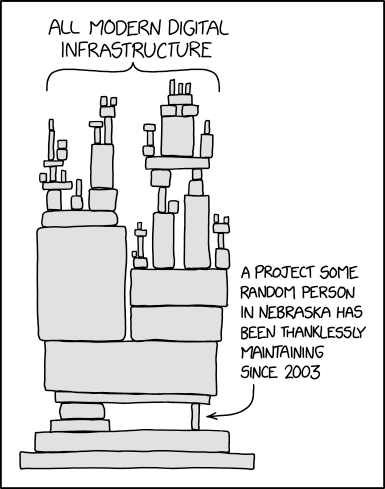
Side projects have long been part of hackerdom, whether as ways of stealing back time from employers or as ways of "increasing your luck surface area." They can be at the root of resistance, or, as in the case of corporate hackathons, they can be yet another ritualized way of extracting free labor. Side projects can be "side bets" that deepen one's commitment to working in the software industry, or they can set up a "pivot" to another line of work altogether. Some side projects end up being deployed and depended upon countless times; some are described as "just a hobby [that] won't be big and professional." Sometimes both of those things are true about the same project, leading to a situation brilliantly summarized by this XKCD strip:
Often side projects take the shape of apps and software packages, but they can also be quirky "digital gardens" or artistic projects. In the words of one tech CEO, Natalie Gordon:
Any project that you are doing for fun, not to make money, is a side project. That's not to say your side project can't make money, but that’s not why you're doing it. Those fun projects that get done outside of work can have a huge, disproportionate impact on your whole career.
Others have noted how "side project culture" sets up a barrier around an industry that is already hard to break into, because not everyone can afford the up-front investment of hope labor it demands.
Gordon, incidentally, launched her own business with a "Show HN" post on Hacker News. Show HN is one of several online venues where people launch their side projects. Others include /r/sideproject, Product Hunt, Indie Hackers, and MeFi Projects. Here I will focus on Show HN, which provides one (admittedly distorting) lens on the kinds of projects people take on and share publicly. Part of a site that itself originated as a side project, Show HN is intended for sharing "something you've made that other people can play with." Other readers of the Orange Website, as it is (not always affectionately) known, can then share their feedback, which they do with varying degrees of constructiveness. One oft-cited example of less constructive feedback is the 2007 HN discussion of the Dropbox launch, where one commentator dismissed the product as "trivial."
Show HN submissions first started in 2009, when the site was still in its infancy, but only became an official feature of the site on July 3, 2014. Since then, there have been tens of thousands of submissions. Most submissions are links, though a small proportion of users (about five percent) opt to submit a "story" instead (which usually directs readers to the thing they can play with). More than a quarter of links posted are to repositories hosted on GitHub.
In the following, I will undertake a data-driven exploration of these submissions over time, in hopes of learning what, if anything, changed as a result of the pandemic. This may offer some initial clues about the ways hackerdom is evolving in this moment.
In [1]:
%matplotlib inline
from matplotlib.pylab import plt
In [2]:
import seaborn as sns
sns.set_theme(context="notebook",
              palette="deep",
              style="ticks",
              rc={"figure.figsize": (18, 12)})
In [3]:
import pandas as pd
pd.set_option("display.min_rows", 100,
              "display.max_columns", None,
              "display.max_colwidth", None)
In [4]:
import textnets as tn
tn.params.update({"autodownload": True,
                  "seed": 54,
                  "resolution_parameter": 0.01,
                  "lang": "en_core_web_md"})
In [6]:
import scipy.cluster.hierarchy as hc
In [5]:
from shifterator import JSDivergenceShift as JSDS
In [7]:
from showhn_utils import timeseries_by_cluster, date_term_matrix, period_tn
Thanks to the Hacker News search API offered by Algolia, gathering all posts is just a matter of querying the search_by_date endpoint.
In [8]:
showhn = pd.read_csv("show-hn-hits.csv")
data = pd.DataFrame({
    "date": pd.to_datetime(showhn["created_at"], utc=True),
    "points": showhn["points"],
    "num_comments": showhn["num_comments"],
    "oid": showhn["objectID"].map(str),
    "title": showhn["title"],
    "author": showhn["author"],
    "url": showhn["url"],
    "story_text": showhn["story_text"]
}).set_index("date")
First, let's look at the distribution of Show HN posts over time.
In [9]:
with plt.xkcd():
    sns.lineplot(x="date", y="oid", label="Monthly Submissions",
                 data=data.resample("1m").nunique().reset_index())
    sns.lineplot(x="date", y="oid", label="Rolling Average",
                 data=data.resample("1m").nunique().rolling(3).mean().shift(-1))
    ax = plt.gca()
    ax.set_ylabel("")
    ax.set_xlabel("")
    line = ax.lines[-1]
    x, y = line.get_xydata().T
    ax.fill_between(x, 0, y, color=line.get_color(), alpha=0.3)
    sns.despine(trim=True, left=True)

The initial big peak in July 2014 corresponds to the offical release of the Show HN feature, which may have been prompted by the two earlier peaks in 2013. After July 2014, there were ordinarily between 800 and 1,000 submissions per month, but starting in early 2020, the number shot up to twice this previous average, and it remained elevated until nearly a year later, in early 2021. This striking pattern is a strong indication that increased pandemic side project activity was reflected in Show HN submissions.
What are side projects about? Looking at terms that tend to co-occur in submission titles can help to discern common themes. Here and in subsequent steps, I focus on submissions from July 2014 through the year 2021.
In [10]:
titles = data[(data.index >= "2014-07-01") &
              (data.index < "2022-01-01") &
              data["title"].notnull()].reset_index().set_index("oid")
In [11]:
corpus = tn.Corpus.from_df(titles[["title"]])
tokens = corpus.tokenized(remove_urls=False)
net = tn.Textnet(tokens, remove_weak_edges=True, min_docs=40, doc_attrs=titles[["date"]])
In [12]:
cluster_dates, cluster_terms, row_order, ts = timeseries_by_cluster(net, 75, freq="2w")
In [13]:
def fglabels(_, color, label):
    cluster = int(label.split(".")[0])
    ax = plt.gca()
    ax.text(0, .5,
            ', '.join(cluster_terms[cluster]) +
            f" ({len(cluster_dates[cluster]):,})",
            fontweight="bold", color="dimgray",
            family=["xkcd", "xkcd Script", "Humor Sans"],
            size="large",
            ha="left", va="center", transform=ax.transAxes)

g = sns.FacetGrid(ts, row="cluster", hue="cluster",
                  row_order=row_order, hue_order=row_order,
                  aspect=18, height=1,
                  palette=sns.dark_palette("orange", n_colors=75, input="xkcd", reverse=True))
g.map(sns.lineplot, "date", "count", linewidth=2)
g.refline(y=0, linewidth=2, linestyle="-", color=None, clip_on=False)

g.map(fglabels, "cluster")
g.set_titles("")
g.set(yticks=[], ylabel="")
g.despine(bottom=True, left=True)
<seaborn.axisgrid.FacetGrid at 0x7fd46969c2e0>

These top seventy-five themes account for a little more than four out of five submissions. The five words supplied per theme give an impression of what they are about, while the numbers indicate how many submissions are associated with these themes. (The approach here is similar to topic modeling, but it uses network techniques instead of LDA to find latent themes in the corpus.)
Themes are sorted by the "jaggedness" of their distribution over time, so that the ones appearing near the top have the highest degree of seasonality, while those further down the list reflect the more perennial themes, the ongoing hum of side projects.
As a long-time HN lurker (and sometime participant), I find this list of themes quite plausible. Granted, a few are spurious—somehow Christmas trees appear to have become connected to decision trees—but for the most part, they make sense and are recognizable genres of Show HN posts.
However, I wanted to take one further step and see if I could periodize Show HN activity on the basis of the terms people used in the titles of their submissions. Clearly, some themes are more prevalent at some points than at others. Do these changes simply have to do with temporary events like lockdowns and World Cups that yield exciting new inputs for side projects, or do they also signal broader epochal shifts? The answer to this question will help us contextualize what, if anything, is different about pandemic side projects.
Periodizing Show HN
Inspired by this paper (and with a little extra guidance via email from its very kind first author), I opted to use hierarchical agglomerative clustering to see if there are distinct periods of Show HN activity. I created a matrix of dates and terms which I first visualized as a cluster map so I could visually discern the cluster pattern.
(I suspect this part of the analysis could be improved, but I decided to put Cunningham's Law to the test by just publishing this approach in hopes of being steered right by somebody who knows a more suitable algorithm.)
In [14]:
m = date_term_matrix(net, "1m")
In [15]:
sns.clustermap(m, method="ward", row_cluster=True, col_cluster=True, cmap="turbo")
<seaborn.matrix.ClusterGrid at 0x7f99fd817160>

The cluster map shows that there is a distinct pattern of clustering, both with regard to the terms that are used in Show HN submissions, and with regard to time periods. The dendrogram suggest that there are three periods. I can inspect them more closely by looking at the scipy output.
In [16]:
z = hc.linkage(m, method="ward")
with plt.xkcd():
    hc.dendrogram(z)
    sns.despine(left=True)

In [17]:
pd.DataFrame({"month": m.index,
              "period": hc.fcluster(z, 3, "maxclust")}).groupby("period").agg([min, max])
| month | ||
|---|---|---|
| min | max | |
| period | ||
| 1 | 2014-07-31 00:00:00+00:00 | 2015-11-30 00:00:00+00:00 |
| 2 | 2020-01-31 00:00:00+00:00 | 2021-12-31 00:00:00+00:00 |
| 3 | 2015-12-31 00:00:00+00:00 | 2020-02-29 00:00:00+00:00 |
This confirms the impression that there are three periods of Show HN activity: July 2014 through November 2015, December 2015 through February 2020, and the time since March 2020 (through 2021). Although January 2020 is in a cluster with later months, I decided to include it in the previous cluster to ensure that periods are continuous.
In [18]:
period1 = titles[titles["date"] <= "2015-11-30"]
period2 = titles[(titles["date"] > "2015-11-30") & (titles["date"] < "2020-03-01")]
period3 = titles[titles["date"] >= "2020-03-01"]
In [19]:
with plt.xkcd():
    sns.barplot(
        data=pd.DataFrame({
            "posts": [period1.shape[0], period2.shape[0], period3.shape[0]],
            "period": ["Period 1", "Period 2", "Period 3"]
        }), x="period", y="posts")
    ax = plt.gca()
    ax.set_title("Show HN Submissions")
    ax.set_ylabel("")
    ax.set_xlabel("")
    sns.despine(left=True)

The second period spans more than four years and saw three times as many submissions as the first period and twice as many as the third.
Shifting priorities
What accounts for the shifts between these three periods? Word shift graphs provide an elegant way to visualize the term-level shifts between collections of texts—in this case, the submission titles from the three periods. I use Jensen–Shannon Divergence to see which terms gain or lose influence between periods. I don't use raw counts of terms, but rather their weighted eigenvector centrality within the text network for a given period, which provides a measure of their influence.
In [20]:
terms1 = period_tn(period1).project(node_type="term", connected=True)
terms2 = period_tn(period2).project(node_type="term", connected=True)
terms3 = period_tn(period3).project(node_type="term", connected=True)
In [21]:
shift1 = JSDS(type2freq_1=terms1.eigenvector_centrality.to_dict(),
              type2freq_2=terms2.eigenvector_centrality.to_dict(),
              weight_1=0.5,
              weight_2=0.5,
              base=2,
              alpha=1)
with plt.xkcd():
    shift1.get_shift_graph(system_names=['Period 1', 'Period 2'],
                           top_n=75, width=18, text_size_inset=False)

In [22]:
shift2 = JSDS(type2freq_1=terms2.eigenvector_centrality.to_dict(),
              type2freq_2=terms3.eigenvector_centrality.to_dict(),
              weight_1=0.5,
              weight_2=0.5,
              base=2,
              alpha=1)
with plt.xkcd():
    shift2.get_shift_graph(system_names=['Period 2', 'Period 3'],
                           top_n=75, width=18, text_size_inset=False)

The purple bars pointing to the left indicate words that lost prominence in the lexicon of side projects in the transition from one period to the next, the yellow bars show the terms that gained influence.
With the obvious exception of COVID-related terms that rise in period 3, many of the shifts reflect changes in programming stacks over time. Especially in web development, there is a high level of churn regarding the tools and libraries that are considered en vogue. JavaScript frameworks come and go out of style all the time. In period 1, Meteor, AngularJS and Flux were popular frameworks that in period 2 were mostly superceded by React and Vue.js. In period 3, new web technologies like Deno, Svelte and Next.js rise, while Vue and React appear to have declined again, and Redux took a huge drop.
Other shifts reflect the rise of new products and technologies. In period 2, "serverless" became a buzzword for a new way of using cloud computing following the introduction of AWS Lambda, while period 3 sees the rise of BaaS (backend as a service). Between periods 1 and 2, we can also see the rise of "deep learning" technologies like TensorFlow, which was introduced right around the time period 1 ended. We also see the rise of cryptocurrencies like Ethereum. In period 3, GPT-2 and GPT-3, OpenAI's huge pretrained language models, start to have an impact.
The mostly technological nature of these shifts may suggest that side projects in each period are mainly a way of keeping pace with industry innovations. This would confirm the widespread view of Hacker News as a community of apolitical careerists. However, not all technologies that rise from one period to the next are groundbreaking. In period 3, the old technology of QR codes made a comeback thanks to their widespread use in vaccine passes. Notion, Airtable and Roam are knowledge bases whose rise in period 3 has less to do with their innovative features than with a cultural demand to organize knowledge for distributed teams or for individual learning with flashcards or Zettelkästen. NFTs are arguably also more of a cultural than a technological novelty.
Untangling the meanings of side projects
Side projects are not just riding the waves of innovation and obsolescence. They also respond to events and cultural shifts—especially in the most recent period of pandemic side projects. Yes, side projects still reflect the latest trends in web development and cloud computing, but they do more than that. Their frequently playful approach makes it difficult to say what generally motivates them. The data I have been crunching here is not suited to answer such questions.
For that reason, I intend to speak to the creators of side projects themselves to understand the context in which they were built and the significance they have had since then. Look forward to updates on what I learn from that research in a few months' time. They will probably contain a lot less code.