

When a laptop crashed in an empty office, we knew it was time to overhaul our performance testing framework.
Share Keeping Figma fast
Illustrations by Rose Wong.
In 2018, all we needed was a single MacBook. At least, that’s all we needed to run our entire in-house performance testing system. The laptop looped the same couple of test scenarios over and over, and reported any changes and timings every hour or so to a shared dashboard. We wrote all about it
and the optimizations we made, timed with a major performance overhaul to WebAssembly.
In 2018, we discovered that restructuring our document renderer and ironing out WebAssembly bugs made Figma 3x faster.
At the time, what we outlined was sufficient. So was the single laptop. Five years on, a lot has changed. Figma’s codebase has become larger and more complex, and Figma has expanded to include plugins, community features, a new product (FigJam), a workspace for developers (Dev Mode), and too many updates to count. Our team is distributed around the world, far beyond the bounds of a single laptop. As we’ve scaled, we’ve realized we need a more sophisticated approach.


Running tests on a single laptop is common practice for smaller companies. We always try to keep our processes lean and avoid over-engineering, so this approach worked for us until recently.
The little MacBook that could...until it could no more
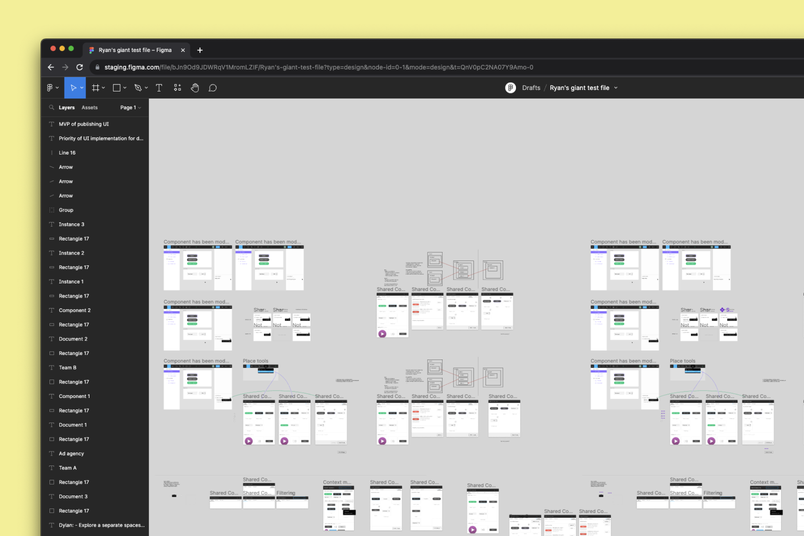
A granular performance test checks detail at scale. In one of our newer tests, we simulated rapid panning around a file with 100 multiplayer editors moving layers and typing new text simultaneously.
This realization happened gradually, and then all at once. First, it became clear that the few large design files we used for testing could no longer represent an ever-growing number of product features, not to mention their edge cases. The best practice would be to run a granular performance test specific to each feature, but our team’s expansion to more than 400 engineers and managers made that unsustainable. We increasingly shipped more changes daily, which meant that no single person—or laptop—could keep track of every change that went into a release.
In early 2020, like so many companies, we started working remotely. But that same MacBook stayed plugged in and running at our office in San Francisco. In October, it overheated. We tried setting up the same tests on another laptop, but we couldn’t get them to run smoothly. We knew that it was time to rethink our testing system and come up with an approach built for scale.

Our dream setup
It was daunting to overhaul the system, but the silver lining is that it gave us the opportunity to go back to the drawing board and dream up our ideal system. We started by outlining the key challenges we needed to address: a growing number of features that can impact performance, difficulty operating testing hardware, and a dearth of accurate performance metrics. Through that lens, we came up with a few requirements.
First, we wanted a system that could test every proposed code change in our main monorepo so we could spot performance regressions across all product features early in the development cycle. This would allow us to approach performance proactively, instead of reactively fixing bugs that users report after a feature goes live. Proactive performance is something that’s core to our work at Figma, and that we embody in many other areas of our engineering work. We know that many of our users spend hours a day in Figma; even a small lag can cause major hiccups in their workflows.
Running many tests in parallel (also called parallel runs) is a common way to reduce the time spent waiting for the Continuous Integration (CI) to complete. At Figma, we already use parallelization on cloud-hosted CI runners for every other type of testing.
Running performance tests on real hardware for every pull request would require around 100 identical runners at peak.
Next, the system had to run fast. We decided that any performance guardrail check would need to finish in under 10 minutes—anything beyond that would get in the way of the fast-paced development that’s so central to our engineering culture. To achieve this goal, we’d have to embrace parallel runs, requiring us to simultaneously run dozens of performance stress scenarios.


Lastly, we needed a way to discuss and compare performance. We wanted the ability to reveal the most subtle changes in performance on real hardware, collect CPU profiles, and share links to all this data to drive decisions and continue improving the model moving forward.
These requirements might sound straightforward, but fine-tuning performance for Figma can be nuanced. Figma’s foundation on the web, combined with the way people use Figma—with tons of distributed collaborators—can make for a uniquely tricky environment. We often contend with massive client data sets, dozens of screens at a time, and constant rendering. Many of our performance challenges more closely resemble those in the gaming world
than ones you might encounter in typical applications.
Embracing performance work in a remote-first world
With these goals in mind, we turned our attention to the how. Initially, it was just the core working group, which is typical of engineering projects at Figma. While many other folks helped guide, review, and approve our work at different intervals, as a rule, we always try to keep the working group as lean as possible so we can move quickly. After taking a realistic look at what we could deliver in the first six months of work, our strategy was to get to the big, impactful wins quickly, while also planning to build a system that could sustain long-term growth.
We thought about how to scale the single MacBook and considered building a device farm with many identical laptops running tests on every commit. As we considered what it would take to execute that, we realized that it would be expensive, in terms of both hardware and maintenance. Running a device farm is incredibly challenging with a small team: Not only do you need to ensure every test laptop is nurtured with the right cooling, network bandwidth, and system updates, but you also need to replace hardware as older laptops start to degrade. Even if we ran all tests on virtual machines, we’d still need seemingly endless engineering resources to tame the performance variance.
Counting CPU instructions is great for tracking performance of a traditional algorithm but, in practice, other hardware can become a bottleneck.
Figma is a graphics-heavy application with a lot of work split between CPU and GPU. The speed of moving data between CPU, GPU, and main memory can slow things down, too (commonly called “I/O” for “input and output” speeds).
In talking to internal experts and doing our own research, we learned that some performance testing counts CPU instructions executed by the program to deterministically detect regressions, but found challenges with this approach, too. For one, our application is a combination of WASM/WebGL and HTML/JS/CSS code running in a variety of browsers with their own interpreters and just-in-time optimizers. Furthermore, Figma’s editor was not always constrained by CPU—sometimes it would be GPU, and rarely I/O.

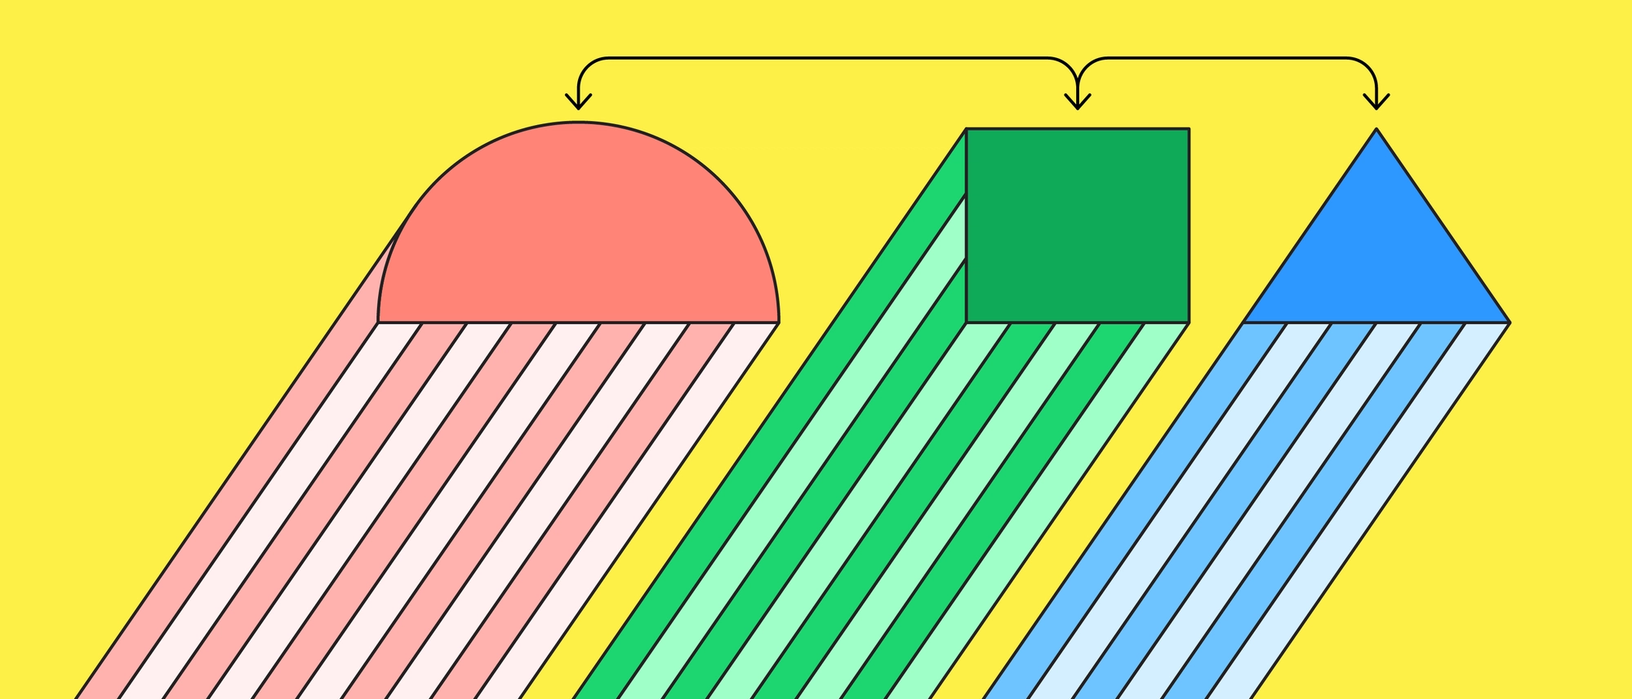
After considering a few different approaches, we ultimately decided to ship two systems: A cloud-based system would handle mass testing, covering our bases for the majority of situations, and a hardware system would be highly targeted, tackling situations that required more precision. They would be connected by the same CI system, and engineers across product teams would run the same suite of performance test scenarios across them.
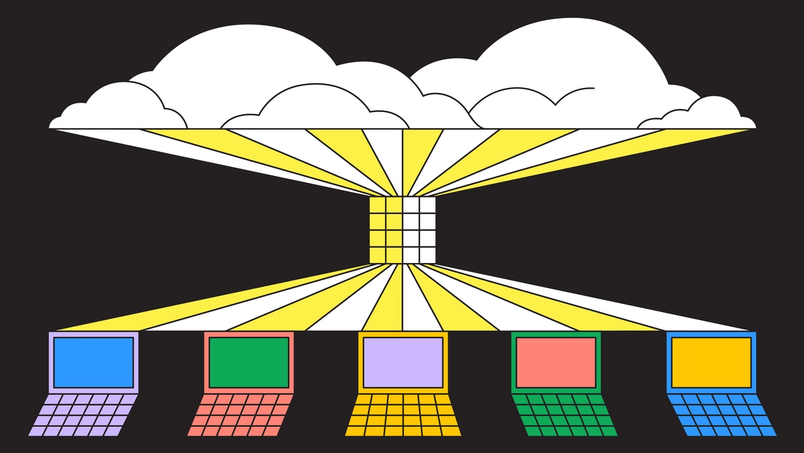
(1) Cloud-based system
There are many ways to mitigate some noise aspects of VMs, like dedicated hosts or RAM disks, like Dropbox did.
The first system runs in GPU-enabled virtual machines, in a headless Chromium process on every code change in every pull request. Virtual machines (VMs) can be tricky for testing performance due to the noise levels of virtualized hardware, loud neighbors on the same underlying host, and inconsistencies in measurement, which all pose problems for accurately timing complex applications. These factors can add a good amount of variance to performance, so we set a 20% pass margin to skip the noise and catch the most egregious and obvious regressions. We decided to only rely on the VM-based system for spotting really large regressions (e.g. a rendering algorithm accidentally turning from O(n) into O(n^2)). Running in VMs also allowed us to run many tests in parallel to hit the 10 minute feedback cycle.
While building out this system, we had to make a design decision about whether to test components separately (we already had a practice of compiling the C++ editor into a stand-alone binary for tests) or together, end-to-end, in the browser (we already do this for integration testing). We opted for the latter—full in-browser testing with a real GPU. This approach allowed us to capture complex issues involving WebGL rendering, CSS affecting browser layout algorithms, and even accidental misuses of React hooks.
In the future, we could go as far as testing with production backend services, but that requires a lot more engineering investment. Meta illustrates the complexities of catching issues end-to-end beyond the browser.
(2) Hardware system
The second system runs on a small array of test laptops that includes older machines, or those that don’t have the latest hardware (think: older MacBooks, outdated Windows laptops, Chromebooks) and allows our developers to schedule custom runs of any test scenario through the same scheduling system in CI. While it has a slower queue, this system accommodates on-demand runs where consistent user-like hardware adds confidence:
A hot path is a code path that is performance-critical, something that occurs many times every second.
- Bisecting a subtle regression that made its way to staging or production
- Comparing day-over-day changes to performance on realistic devices
- Experimenting on various approaches to improve the “hot paths” such as canvas rendering
We added a handful of features—shared by both systems—on top of that foundation. While these features weren’t critical to how the systems function, they helped us better understand and report out on performance:
- Two types of test scenarios: those that stress local edits, and those that receive a stream of simulated multiplayer changes
- A detailed HTML report with recorded metrics that’s easy to link to for internal sharing
- A CPU profile for any run to help us gain a deeper understanding of the bottlenecks
Overall, our approach combined virtual and real hardware, allowing us to guardrail the majority of regressions while providing the tools to our engineers to collaborate on hot areas or suspect code changes remotely.
A tale of two workstreams
After scoping these two approaches and spending six months on design and development, the system went live in October 2022. From there, we focused on collaborating with a few specific performance-focused projects. Here are two case studies on performance, directly from the teammates who led these workstreams.
Improving rendering performance
Andrew Chan, Software Engineer, Figma


Unlike most of the applications built in the browser, Figma renders a lot of content using WebGL, a programming interface that allows lower-level control over rendering quality and performance at the cost of complexity. There are unique challenges that come along with this, and we’re constantly exploring new ways to improve performance and rendering speed—especially on slower devices that might not have the most powerful graphics card or CPU.
We recently developed stress test scenarios for rendering complex scenes—like thousands of layers edited by 50 multiplayer users—and took a very deep dive into CPU and GPU profiles. There were some techniques that worked well for some hardware configurations, but added too much overhead on others; based on these investigations, we identified which rendering sub-systems to focus on. After all, there is a wide variety of combinations of different CPUs, GPUs, drivers, operating systems, and even browser behaviors that can affect performance.
We needed to validate every optimization idea as quickly as possible: Is it actually as impactful as we think? Are there any unintended consequences that bring performance down in older or less performant devices? Validating our ideas with runs on real hardware was the key to prioritizing time-consuming engineering work. In benchmarking low-fidelity prototypes, we learned that many ideas that we initially thought were great candidates turned out to be less impactful—or even harmful—on older computers.
After a few rounds of quick experimentation, we turned our attention to time-slicing of rendering, which showed promising results. With Figma’s multiplayer technology
, in which multiple people can edit a file at once, Figma’s rendering engine has to quickly respond to remote and local edits alike. To do that, the new algorithm prioritizes local edits and operations over rendering changes produced by other users—just like how modern computers allocate computing time among applications. While this approach remained almost unnoticeable on the latest machines, slower devices saw an improvement on perceived frame rate.
Throughout our development process, we constantly benchmarked the optimized code path against the baseline and the original prototype. We wanted to make sure that we maintained the desired increase in FPS and some custom metrics we introduced specifically for this project as we iterated on implementation and fine-tuned UX trade-offs. With our team split across New York and San Francisco, it was crucial to have convenient access to test machines, track progress through periodic benchmarks, and support our intuition with experimental data.
Speeding up FigJam
Sean Marney, Software Engineer, Figma

Since sharing our approach to performance
in 2018, we’ve gone through some big changes, including launching another product: FigJam. Figma’s existing rendering and
multiplayer interaction systems

How Figma draws inspiration from the gaming world
Engineering Manager Alice Ching discusses the parallels between developing gaming interfaces and building Figma and FigJam, and why our tech stack is more similar to a game engine’s tech stack than a web stack.
provided a solid foundation for launch; now that FigJam has been out in the world for over two years, we can see that the optimizations we originally created for Figma aren’t quite optimized for FigJam. For example, users are more likely to quickly add tons of sticky notes and recluster them in FigJam, compared to iterating on designs within a few frames in Figma. As we continued optimizing the system for Figma and FigJam, we had to be careful not to create an optimization that only worked for one part of the product: An optimization benefiting a solo designer creating a complex mockup in Figma may not be helpful for hundreds of people participating in a quick whiteboard session in FigJam.
As we iterated on FigJam in the early days, we’d fix issues reactively, in response to customer reports or changes in production metrics. But we knew there was a better way. With the help of our new testing framework, we wrote tests covering the majority of essential user flows, and automatically found issues before they hit production—most often before they were even merged into the codebase. During the initial setup, we encountered some headaches (no one likes new, flaky tests), but ultimately the tests proved extremely valuable for preventing regressions from completely innocent-seeming code.
For example: Did you know that background-filter: blur(0) can fix a variety of Safari rendering bugs but can also subtly affect its layer compositing speed? I didn’t, nor did the developer who tried to update our sticky page curl animation’s CSS to make it more realistic and more clearly a sticky note. In fact, I’d go so far as to say that pretty much no one should need to know that.

We don’t usually go looking for CSS changes when we find performance degradations, but thanks to our suite of automated tests, we were able to find this bug while it was still ingesting on our staging platform and make a fix before it ever impacted users. The tests run often enough, on the HEAD of our codebase, that we could see a significant spike in frame lengths for core user behaviors. As a result, we were able to identify the exact code change that caused the issue.
Other times, performance issues may make it further in the process before they’re caught. For example, if a test is temporarily disabled, we won’t get an automated alert about it. Luckily, we can run these tests on older commits, using real hardware in the remotely accessible lab. That means that even these issues can be sussed out, using git bisect to narrow down the commits until we get to a single culprit! At one point, we had an optimization that a…certain engineer wrote...with my initials. While the optimization was great for the 50th percentile of frame rate, it had issues in the 90th percentile, only on specific machines. This meant that while our default system couldn’t catch it, a manual run of a few tests would spot the issue within 10 or so runs of the tests.
The work ahead
Performance is a tricky area. Things you expect to be the bottleneck often aren’t. And things you’d never suspect of causing a performance issue can take you by surprise. That’s why it’s so important to establish testing and benchmarking frameworks. We’re now at the point where no one person knows the nuances of all our products and features—and we can’t expect them to! Still, our work impacts our teammates’ work, and vice versa. More than anything, we need to focus on systematically addressing these concerns—it’s essential to maintaining development velocity.
We’ve come a long way since that single MacBook. Since these improvements went live, we’ve focused on empowering domain experts to drive performance-improving initiatives and putting checks in place to ensure it does not regress over time. With the arrival of remote on-demand test runs, detailed reporting, and carefully picked metrics, we can collaborate on performance-sensitive code across teams and time zones. Plus, we can expand on our existing foundation, rather than reinventing the wheel.
If this project sounds interesting, check out our open roles—we’re hiring!
Related articles
Create and collaborate with Figma
Get started for free