Napier Nomad II Aircraft Engine Performance Verification
Using Numerical Modeling
J. David Kirk
Kirk Engines, Inc
Published 1 Apr 2021
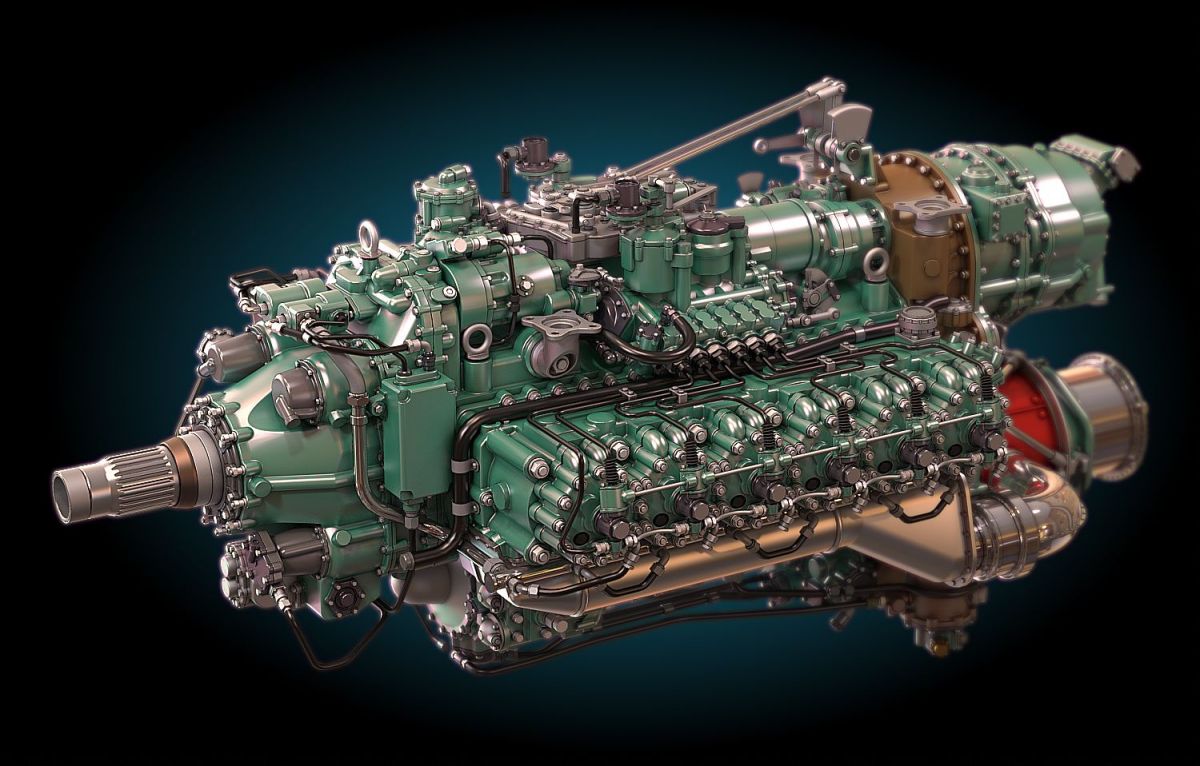 Napier Nomad II |
During the mid-1940s, D. Napier & Son Ltd. undertook a project to design a highly efficient, propeller driven piston aircraft engine that was considerably more fuel-efficient than other engines in use at that time [2,3,4]. Napier decided to use a “compound cycle” engine that made use of the normally wasted exhaust gas energy, the goal being to capture this energy, convert it to useful work, and feed back into the propeller shaft. The Napier engineering group settled on a CI (Compression Ignition, i.e. diesel) piston engine coupled with a gas turbine engine, less combustors, as the CI engine became the gas generator that supplied the exhaust energy to drive the turbine. The compressor, driven by the turbine, supplied all airflow to the piston engine. An infinitely variable, mechanical transmission coupled the turbomachine main shaft to the CI engine crankshaft to optimally combine the power outputs of each machine to drive the propeller. Additionally, some residual exhaust thrust was available for propulsion. |
Summary
This study constructed a numerical computer model of the Napier Nomad II aircraft engine with the intent of verifying the rather remarkable performance claims made for this interesting machine. The model consists of the accepted equations and relationships describing the thermodynamic and fluid properties that are typically used for predicting various internal combustion engine performance parameters. Once the model was constructed, it was calibrated using stated sea level performance test data published by Napier. Various engine power and speed settings at differing altitudes were then run with excellent agreement between model predictions and published data. Results show that the Nomad performance claims are indeed legitimate, thus demonstrating that this form of compound-cycle engine deserves another look as a modern-day power source for certain aircraft applications.
Discussion
D. Napier & Son Ltd., a highly-respected British organization, produced some remarkable aircraft engines during its career as one of the premier British engine manufacturers [1]. Engines ranged from spark-ignition types to diesel; even gas turbine and rocket engines were briefly produced. Napier products always demonstrated cutting-edge technology for the time, with a high degree of novelty and a non-standard approach to engineering design. This methodology is clearly demonstrated in the engine that is the subject of this analysis.
Napier actually constructed two engines based on this concept, these being the Nomad I and Nomad II. The Nomad I was an overly-complicated engine [4] and is not considered in this analysis. Lessons learned from this first engine led to simplification, weight reduction and ultimately better performance of the Nomad II, which is the subject of this report. A simplified schematic of the Nomad II appears in Figure 1.
The engineering details are fascinating. Napier chose to use a two-stroke cycle, CI engine comprising a flat-12 (horizontally opposed) cylinder layout, incorporating a 6-throw crankshaft. Piston-controlled scavenge and exhaust ports were employed utilizing reverse loop-scavenging, thus no mechanical valve mechanism was required. The scavenge ports were located in a “Curtis” type arrangement thereby allowing a flat-domed piston to be used, as shown in Figure 2. A top-down sectional view appears in the upper left of Figure 2 and shows how the scavenge ports were nested within the cylinder spacing. A hemispherical combustion chamber was employed using a single, centrally-mounted fuel injector operating at 3,675 psi [4]. A single spark plug was oriented 45° from the injector with said spark plug required for engine starting and light load operation.
| Right: Charles Gordon Curtis (1860-1953) invented the Curtis scavenging system in 1933. Kevin Cameron notes that the 'A' transfer ports on either side of the exhaust have relatively flat roof angles (little or no upflow). The 'B' transfers have maybe 30� upward roof angle, and the 'C' transfers yet more, as much as 60� upward. This produces a high-speed collective jet of fresh air that quickly travels the loop from transfer ports, across the piston to the non-exhaust cylinder wall, then up that wall to be deflected across the underside of the head, and finally down again to the exhaust port(s). | 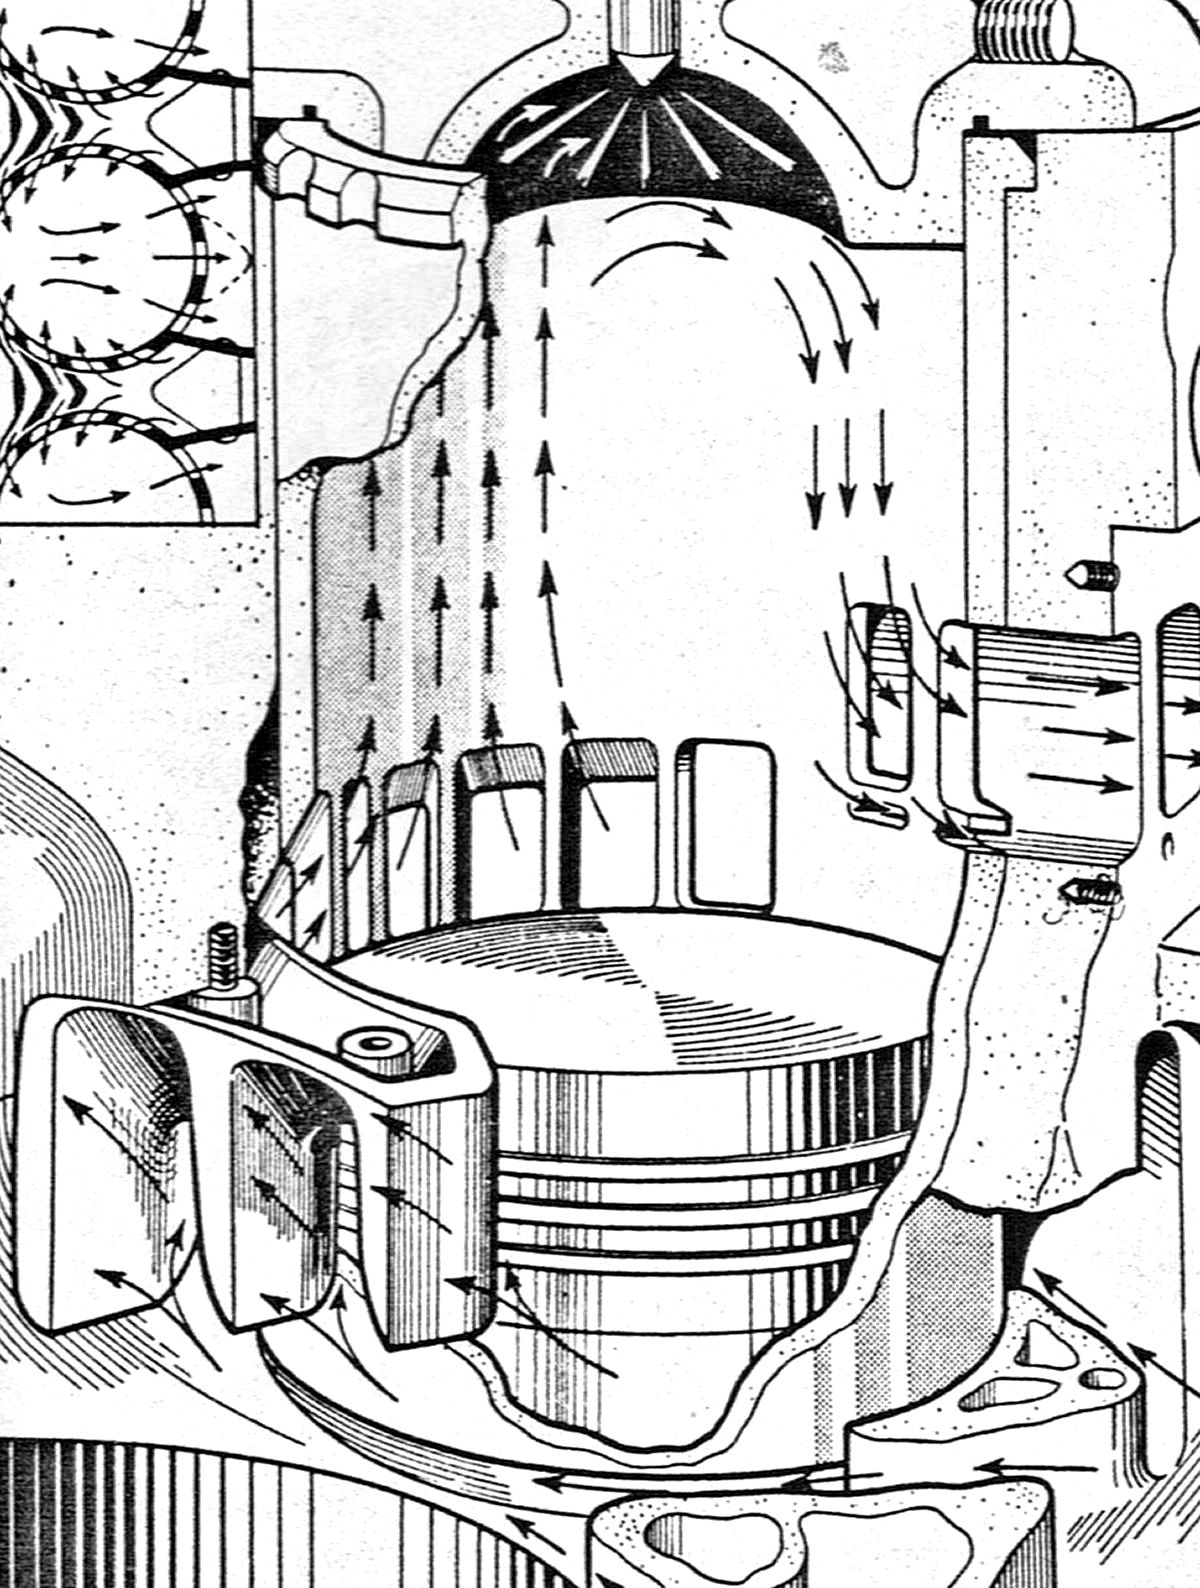 |
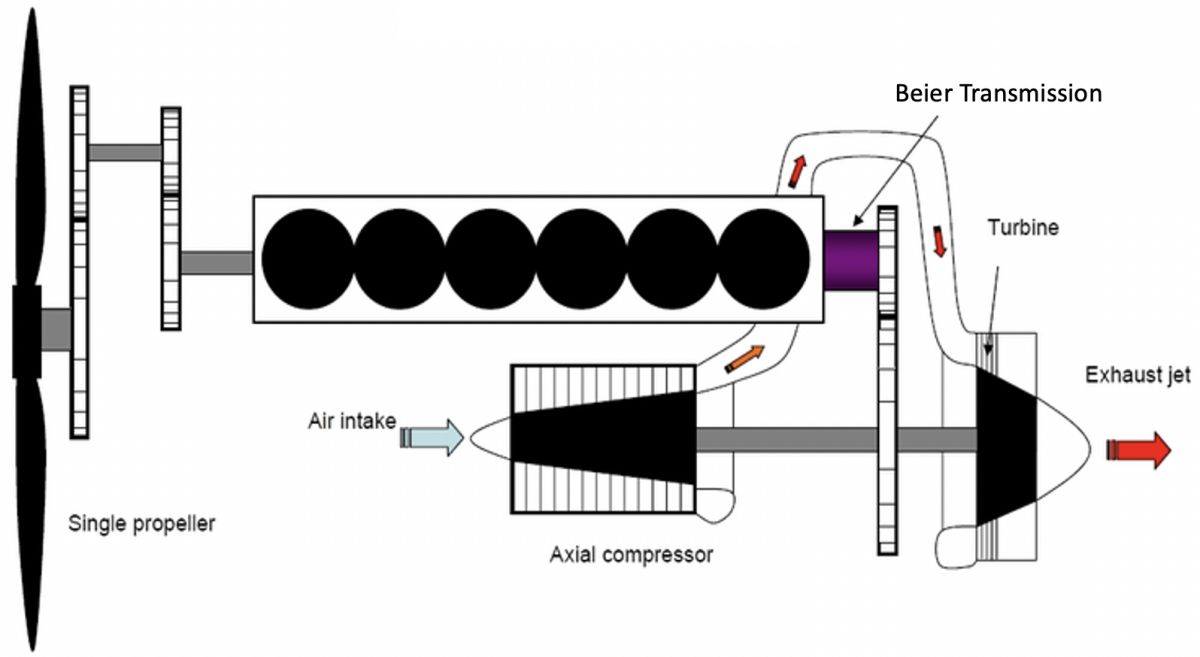 | |
| Fig. 1. Simplified Napier II Schematic | Fig. 2. Nomad II Cylinder Porting Arrangement |
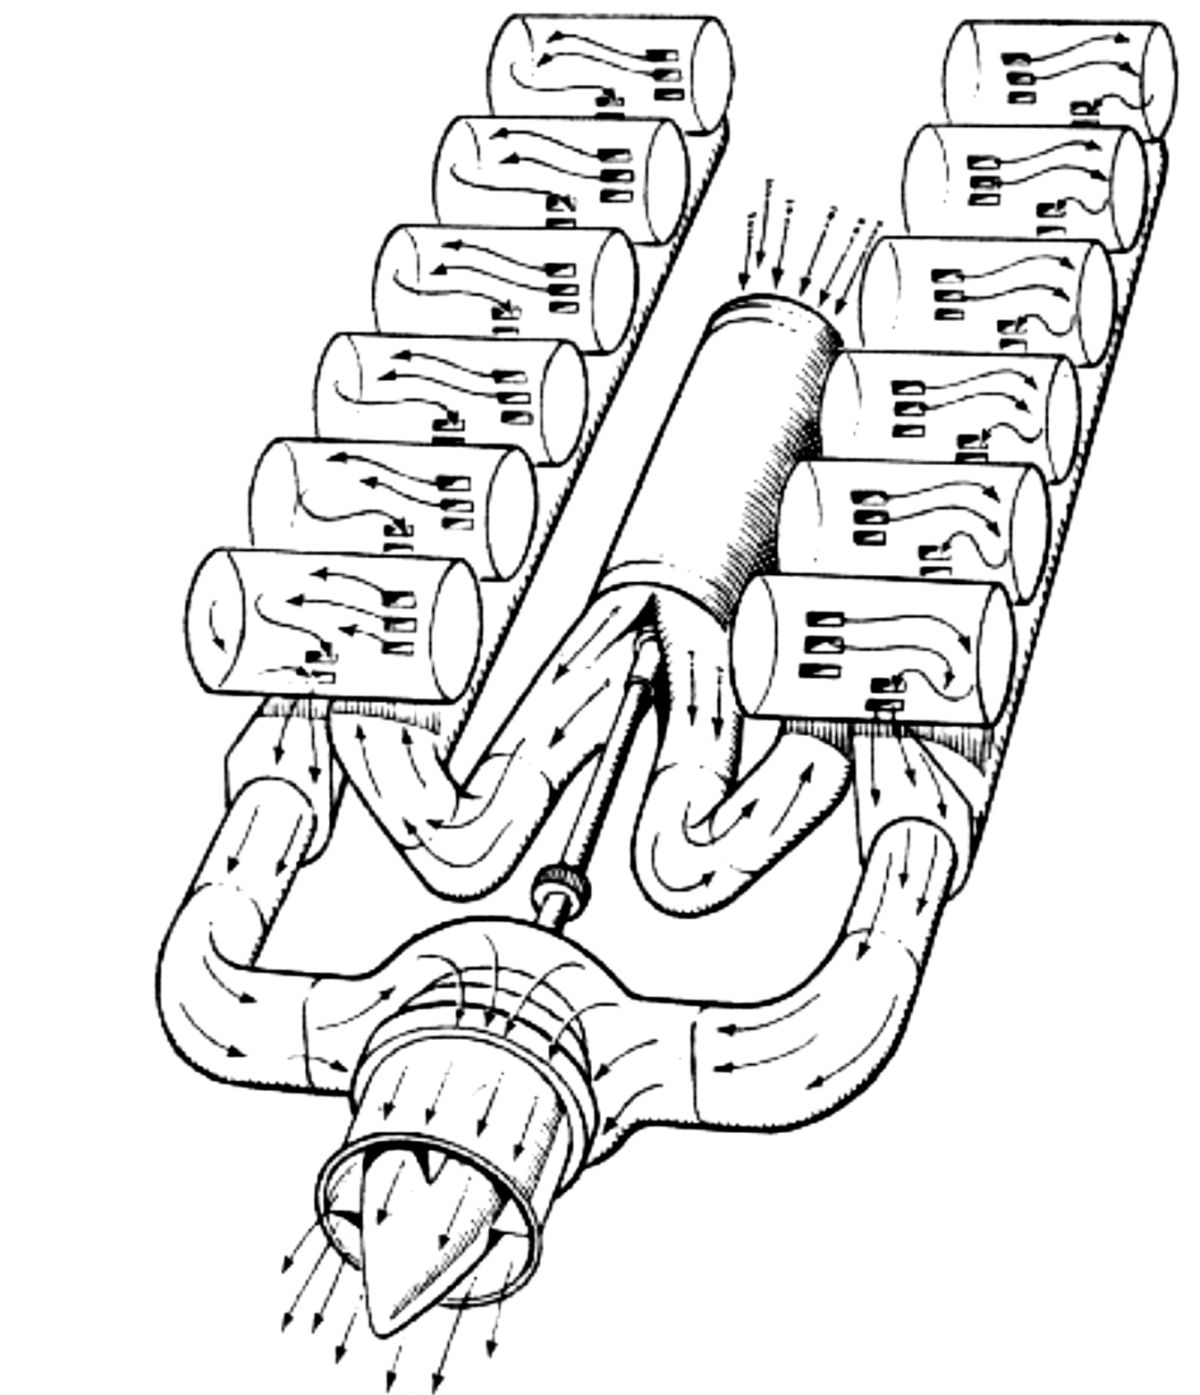
A liquid cooling system was employed, circulating coolant over the cylinder heads and around the cylinders. Mounted beneath the piston engine was a modified Napier Naiad turboprop machine, minus prop reduction system and combustors. The turbomachine consisted of a 12-stage axial flow compressor that supplied all discharge air to the piston engine by suitable ducting. Exhaust from the piston engine was fed into the 3-stage axial flow turbine by straightforward manifolding, with both compressor and turbine connected directly to a common main shaft. Details of this ducting is shown in simplified form in Figure 3.
The piston engine crankshaft and tubomachine main shaft were coupled via an infinitely-variable ratio Beier-type transmission, allowing useful power output of each machine to additively drive the propeller. A longitudinal cross-section of the complete engine is shown in Figure 4, displaying both the Beier transmission, gear train linking turboshaft to crankshaft and general scale of all the components. More in-depth mechanical details are discussed in References 2 and 4.
 |
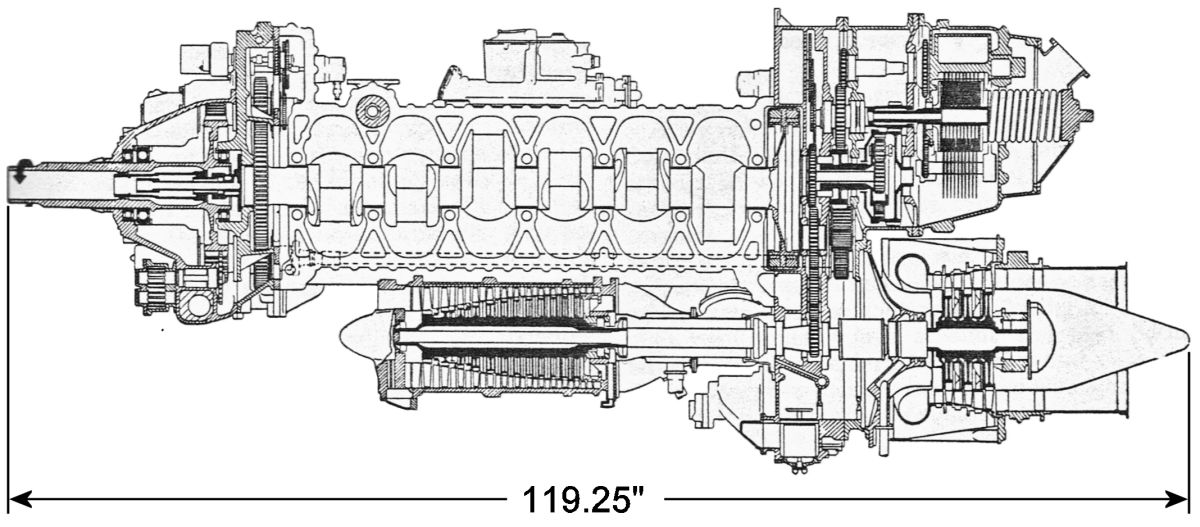 |
| Fig. 3. Engine Airflow Ducting | Fig. 4. Nomad II Longitudinal Cross Section |
In this arrangement, the compressor serves dual functionality as a scavenge air blower and a supercharger. The turbine serves both as a power contributor plus imposing a proportional back pressure across the piston engine cylinders, thereby allowing a true supercharge (high trapped charge density) to be achieved. For starting and light load operation, the Beier transmission allows the turbomachine to be driven by the piston engine as there is insufficient exhaust gas enthalpy (kinetic and thermal energy) across the turbine to contribute useful work. At approximately 1,500 rpm of the piston engine (39.2% of full power on a propeller load curve), the compressor power absorbed and the turbine power supplied, are equal [2]. For piston engine speeds greater than this 1,500 rpm “cross-over” point, the turbine drives the compressor and delivers the surplus of power back into the crankshaft. The Beier transmission allows the optimum operational rpm of the turbomachine to be matched to the piston engine crankshaft for maximum system performance at all speed/load conditions. The mechanical control system was so well thought out that only a single lever power control was necessary to operate the engine throughout its entire operational envelope, including the controllable pitch propeller.
Selection of a CI engine for the piston machine was a requirement due to the high inlet pressures anticipated. A gasoline-fueled spark-ignition engine is detonation limited, thereby putting an upper limit on both compression ratio and boost pressures that can be tolerated, thus limiting power output. This is not the case with a direct cylinder-injected CI engine that relies on heat of compression for ignition of the fuel charge. As air only is compressed up to the point of fuel injection, there is no detonation limitation, thereby allowing a high compression ratio combined with a high boost pressure to be used.
Choice of the two-stroke engine operating cycle was also wise. This is especially true for a highly compounded engine cycle such as this. For two identically similar piston engines incorporating the same displacements, shaft power outputs and operating rpm, the two-stroke offers several significant advantages over the four-stroke. This is due to double the firing frequency of the two-stroke which yields the following:
- Doubled firing frequency of the two-stroke means half the BMEP (Brake Mean Effective Pressure) is required for the same power output. This reduces cylinder peak firing pressures and bearing loading when compared to the four-stroke.
- Lower cylinder peak pressures allow for a lighter engine structure, reducing engine mass.
- For the same power output under boosted conditions, the two-stroke cycle requires half the boost pressure requirement of the four-stroke, this being due to the BMEP being exactly half of the four-stroke. This reduced pressure can alleviate the need for an induction air intercooler, thus saving space and weight. Offsetting this somewhat is the necessity of double the mass airflow demanded by the two-stroke, thus entailing use of a physically larger compressor.
- Absence of mechanical valves and valve actuation machinery results in a simpler, lighter and more compact engine.
- Doubled firing frequency results in reduced torsional stress on driven components plus a more uniform gas flow into the turbine.
Reference 7 shows that a multi-cylinder, two-stroke engine can be modeled as a fixed orifice with regard to the turbomachine. Thus, the characteristics of gas flow and pressure drop across the piston engine are virtually identical to that encountered with combustors in a gas turbine engine. This fact helps simplify the turbomachine portion of the model considerably.
Model Requirements and Preparation
Two types of digital engine modeling simulations are widely used in industry today and have shown a high degree of validity and usefulness in both the design of new engines plus the analysis of existing machines. These are 1 Dimensional Gas Dynamic Simulations (abbreviated 1-D Models) and Speed-Density Models. The following discussion will relate to the type of model chosen for this analysis and will concentrate on the two-stroke cycle in particular.
Simply stated, 1-D Models are a detailed numerical representation of the engine including dimensions of all gas flow paths and turbomachinery operating maps. These commercially licensed models are available under the names of G.T. Power, Ricardo Wave, Lotus Engine Software and Virtual Engines by Optimum Power (the latter being the writer’s preferred code). Construction of this type of model is normally employed when a multi-cylinder, “clean sheet” engine is being designed. It entails knowing all details of the proposed induction and exhaust system lengths and diameters plus intake silencer and muffler dimensions if utilized. The pressure waves, in both magnitude, position and interaction, are “tracked” using a “characteristics” solution method [6]. This allows the designer to optimize the dynamic pressure waves in the system to optimally charge the cylinder during induction plus evacuate and trap a high purity charge in the cylinder for the next cycle. This flexibility is easily accommodated by the ability to change the ducting geometry by mere keystrokes to optimize the system. Tracking these pressure waves to allow for this “tuning” is a highly complex and involved calculation and necessitates a computer to process this information. It should be noted that this numerical complexity is required during the “open cycle” of the process, defined as the induction, gas transfer, scavenging, exhaust, and trapping processes that occur within the engine cylinder during this specific time.
The Speed-Density Model is a simplistic method normally used to analyze engines when details of the induction and exhaust system geometry is not available. It is commonly used to verify validity of stated performance claims made by manufacturers of engines that already exist versus the design of new machines. The Speed-Density approach is made more accurate if laboratory test data exists on the subject engine that can provide the inlet density, delivery ratio, pressure drop across the cylinder during induction, and average pressure in the exhaust system. This allows the “closed cycle” process (i.e., the compression, combustion and expansion portion of the cycle) to be accurately calculated. It should be noted that the closed cycle component of this model is numerically identical to that used in the 1-D Model.
As the Nomad II engine gas flow ducting physical dimensions are not available, the Speed-Density Model was the only recourse to validate this engine’s performance. Fortunately, Reference 2 yields test data that can be used to “calibrate” the model at a given condition (i.e., sea level, rated output). Once calibrated, the model results can be compared with data shown for different altitudes (hence inlet air density) and power settings. It should be noted that exact replication of model prediction-to-test data is not being strived for here. Instead, we seek agreement within a logical margin of error and trends in various parameters as inputs are varied.
The majority of the Nomad II piston engine geometry is provided in Reference 2 and is reflected in Table 1; however, a few important details were omitted. Fortunately, Figure 5 [2] shows a transverse engine cross-section whereby exhaust port height and connecting rod length could be determined by scaling from the drawing, based on the actual cylinder bore diameter (6.000") and verified from the crankshaft throw radius (3.688"). This allowed EO (Exhaust port Open) timing in crankshaft degrees, effective stroke length, trapped cylinder volume and combustion chamber volume to be calculated. Table 1 displays the assembled data.
| Piston Engine Specifications | Turbomachine Specifications | Complete Engine @ Rated Power @ Sea Level | |||
|---|---|---|---|---|---|
| Number of Cylinders | 12 | Axial Flow Compressor Stages | 12 | Power Delivered - Piston Engine, bhp | 2,660 |
| Bore, in | 6 | Axial Flow Turbine Stages | 3 | Power Delivered - Turbine, bhp | 2,250 |
| Stroke, in | 7.375 | Compressor Maximum Airflow, ft3/min | 780 | Power Absorbed - Compressor, bhp | -1,840 |
| Rod Length, in | 14.75 | Compressor Maximum Pressure Ratio | 8.25 | Power Absorbed - Transmission, bhp | -20 |
| Connecting Rod Length/Crank Throw Radius | 4.0 | Compressor Pressure Ratio @ Rated Power | 6.28 | Net Shaft bhp | 3,050 |
| Compression Ratio, Active | 8.0 | Adiabatic Efficiency, Maximum | 87.5% | Piston/Turbomachine Power Ratio | 6.5:1 |
| Exhaust Port Height from BDC, in | 2.766 | Adiabatic Efficiency @ Rated Power | 85% | Compressor Discharge Air Pressure, psi | 89 |
| Active / Total Stroke Ratio | 0.625 | Turbine Pressure Ratio | 7.0 | Compressor Discharge Air Temperature, °F | 477 |
| Cylinder Swept Volume, in3 | 208.52 | Maximum Turbine Inlet Temp, °F | 1,500 | Turbine Inlet Pressure, psi | 76 |
| Total Swept Volume, in3 | 2502.28 | Adiabatic Efficiency @ Rated Power | 84% | Turbine Inlet Temperature, °F | 1,222 |
| Active Swept Volume/Cylinder, in3 | 130.32 | Adiabatic Efficiency @ Cruise Power | 86% | Maximum Reduction Ratio, Turbo rpm/Crankshaft rpm |
8.88 |
| v1, Active Cylinder Volume + Chamber Volume, in3 | 148.93 | Maximum Operating Speed, rpm | 18,200 | Pressure Drop Across Cylinders, psi | 13.0 |
| v2, Chamber Volume,in3 | 18.62 | Airflow, lbm/min | 780.0 | ||
| Total Cylinder Volume/Cylinder, in3 | 227.14 | BSFC, lbm fuel/bhp/hr | 0.345 | ||
| Exhaust Opens, deg ATDC | 97.2 | BSAC, lbm air/bhp/hr | 13.8 | ||
| Rated Shaft Power, bhp | 2,660 | ||||
| Rated Engine Speed, rpm | 2,050 | ||||
| BMEP at Rated Output, psi | 205.0 | ||||
| Maximum Cylinder Pressure, psi | 2,200 | ||||
| Air/Fuel Ratio, Overall, @ Rated Power | 40.0 | ||||
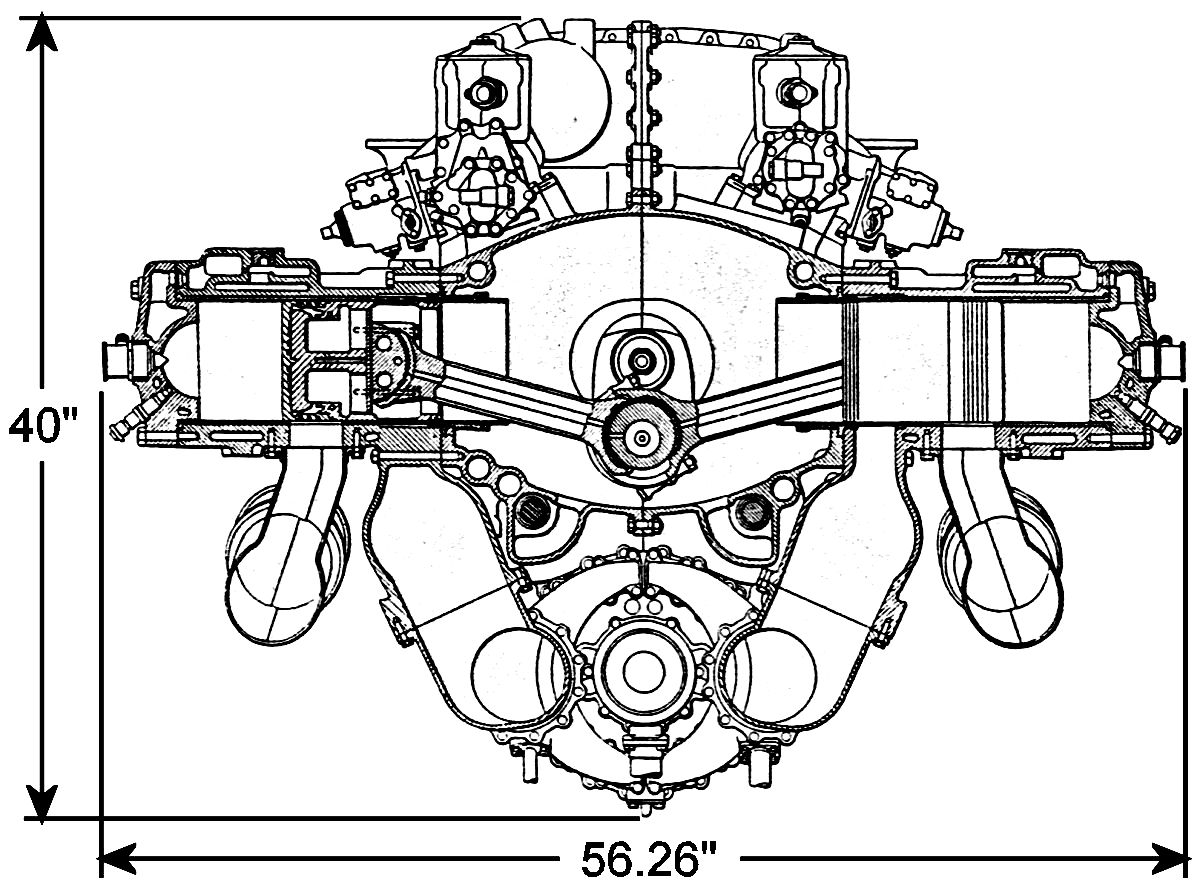 |
| Fig. 5. Napier Nomad II Transverse Cross Section |
Due to the highly atypical Nomad II compound operating cycle, a unique Speed-Density modeling code was necessarily constructed by the writer, based on the numerical approach outlined in Reference 7. It was written in Microsoft Excel and while a spreadsheet is considered by some to be a “non-scientific” approach to modeling, there are features in Excel that allow a solution for a complex system to be arrived at in a rapid and straightforward manner. The system of highly coupled equations relating thermodynamic, gas flow and “state” variables describing this compound cycle are solved using an Excel utility known as “Solver”. This powerful utility, combined with using it in a Macro routine, allows for rapid numerical convergence usually within 2 – 3 iteration cycles. Unrealistic solutions are conveyed as a non-terminating loop or numerical results being outside of logical bounds.
The combustion portion of the cycle was simulated using the Vibe combustion model as explained in Reference 6. Here five parameters control the empirically-derived model, utilized here as a subroutine, which is based on an S-shaped heat release curve versus crank angle. Using the engine test data furnished [2] for sea level rated power, inlet charge density, and exhaust pressure, the Vibe routine was adjusted to closely match the peak combustion temperature and pressure along with a typical CI engine injection advance and combustion delay period for highly-boosted engines. These selected input tailoring parameters were held constant for all conditions simulated.
Reference 2 gives figures for the power lost in the Beier transmission which states a 20 bhp loss for a 410 bhp net power delivery (turbine power less compressor absorbed power) which equates to a 95% mechanically efficient transmission. This percentage loss was held constant as a function of the net turbomachine power delivery for all conditions simulated.
As previously stated, a blower-charged two-stroke engine may be represented as a constant area orifice with regard to airflow demands [5]. To accurately represent this flow area, knowledge of the engine scavenge ports and exhaust port equivalent time-areas are necessary [7]. As the porting geometry and dimensions on the Nomad are not obtainable, recourse to other methods was necessary. Fortunately, Reference 2 provides a maximum airflow rate (780 lbm/min) with a pressure drop across the cylinders (13.0 psi) at sea level, rated power conditions. From this information, an equivalent area and realistic discharge coefficient was calculated (17.54 in², Cd =0.64), with these values remaining constant for all other conditions simulated.
A couple of detailed points are to be noted:
- Reference 2 states that the nominal overall compression ratio of the Nomad II is 42:1. This was calculated on the total swept volume of the piston engine combined with the turbocompressor contribution. A more realistic approach is to calculate this parameter on the cylinder working volume (i.e., the effective cylinder stroke volume) in which case the nominal overall compression ratio is actually 26.9:1.
- Reference 2 also states that the A/F (Air/Fuel) ratio at rated power is 40:1. This was calculated using the overall engine airflow rate divided by the fuel flow rate at rated power conditions. A more realistic parameter is the actual trapped cylinder airflow mass, calculated by the trapped air density at the cylinder working volume (i.e., active stroke volume plus combustion chamber volume). This results in a more plausible “trapped” A/F ratio of 25.7:1.
With all parameters input and calibrations performed, the model was run for validation with the test data (provided in Reference 2) at the rated power, sea level conditions and is considered the baseline. Table 2 shows the comparison between the most pertinent calculated performance parameters versus the test data. The vacant entries in the “Data” column signify parameters that were not furnished. Note both temperature and pressure at sea level conditions and all other altitudes considered reflect those of standard atmosphere [8]. The “Notes” section appears below the data with reference numbers corresponding to those comparisons that appear in the table. It is again brought to the reader's attention that the model was calibrated via the power outputs/absorptions of the compressor, piston engine, turbine and transmission as the dependent variables. Independent variables such as A/F ratio, compressor efficiency and turbine efficiency were adjusted to allow the dependent variables to approximate the test data. This is standard practice in calibrating a model under a baseline condition. Once these relationships are established, the compressor and turbine efficiencies are held constant for all simulations that follow. A/F ratio necessarily changes as a function of piston engine power output at various altitudes and engine speed/loads.
| Data | Simulation | % Difference | Notes | |
|---|---|---|---|---|
| Crankshaft rpm | 2,050 | 2,050 | ||
| Air/Fuel Ratio, Overall | 40.0 | 45.6 | 14% | (1) |
| Air/Fuel Ratio, Trapped | 36.6 | |||
| Compressor | ||||
| Efficiency, % | 0.85 | 0.76 | -11% | (2) |
| P2/P1 | 6.28 | 6.28 | 0% | (3) |
| P2, Discharge Pressure, psia | 89.0 | 92.29 | 4% | (4) |
| T2, Discharge Temperature, °F | 477.0 | 476.2 | 0% | (5) |
| Piston Engine | ||||
| P1, psia | 89.0 | 92.3 | 4% | (6) |
| T1, °F | 477.0 | 476.2 | 0% | (7) |
| P2, psia | 1,528.7 | |||
| T2, °F | 1,144.9 | |||
| P3, psia | 2,200.0 | 2,026.2 | -8% | (8) |
| T3, °F | 3,300.0 | 2,537.8 | -23% | (9) |
| P4, psia | 257.6 | |||
| T4, °F | 2,145.7 | |||
| ΔP Across Cylinders | 13.0 | 13.0 | 0% | |
| Turbine | ||||
| Efficiency | 0.84 | 0.78 | -7% | (10) |
| P3/P4 | 4.6 | 5.4 | 17% | (11) |
| P3, psia | 76.0 | 79.3 | 4% | (12) |
| T3, °F | 1222.0 | 1437.9 | 18% | (13) |
| P4, psia | 14.696 | |||
| T4, °F | 801.4 | |||
| Complete Engine | ||||
| Compressor Power, bhp | -1,840 | -1,840 | Calibrated Values (14) | |
| Turbine Power, bhp | 2,250 | 2,250 | ||
| Net Turbine Power, bhp | 410 | 410 | ||
| Piston Engine Power, bhp | 2,660 | 2,660 | ||
| Transmission Loss, bhp | -20 | -20 | ||
| Total Shaft Power, bhp | 3,050 | 3,050 | ||
| Power Ratio, Piston/Turbo | 6.50 | 6.49 | 0% | (15) |
| Piston Engine BMEP, psi | 205.0 | 205.3 | 0% | |
| BSFC, lbm fuel/bhp/hr | 0.340 | 0.328 | -4% | (16) |
| BSAC, lbm air/bhp/hr | 15.363 | |||
| Thermal Efficiency, % | 40.0 | 42.2 | 6% | (17) |
| Bypass/Total Airflow, mass % | 22.01 | (18) |
Notes: Numbered points in Table 2 (i.e., P1, T1, etc.) correspond to specific temperature and pressure state points appearing in Figure 7 for the piston engine and Figure 8 for the turbomachine.
- Adjusted A/F ratio by 14% to obtain the piston engine power output of 2,660 bhp.
- Adjusted compressor efficiency by -11% to match power absorbed of -1,840 bhp. This discrepancy could be due to test data reflecting adiabatic efficiency versus actual efficiency. Also, no inlet temperature/pressure conditions stated in the test data.
- Model set for same pressure ratio as stated in data.
- Model predicts excellent agreement with compressor discharge pressure.
- Model predicts excellent agreement with compressor discharge temperature.
- Scavenge air pressure is the same as that given in (4).
- Scavenge air temperature is the same as that given in (5).
- Model predicts a lower peak pressure of combustion by -8%.
- Model predicts a lower peak temperature of combustion by -23%.
- Adjusted turbine efficiency -7% to obtain turbine power output of 2,250 bhp.
- Model predicts turbine pressure ratio 17% higher than test data. This could be caused by no discharge pressure stated in test data, where in the model it is assumed to be at ambient pressure.
- Model predicts turbine inlet pressure 4% higher than test data. Considered excellent agreement.
- Model predicts 18% increase in turbine inlet temperature.
- These output parameters were calibrated to be the same as test data by adjusting (1), (2), and (10).
- Predicted power ratio agreement reflects adjustments stated in (14).
- Model predicts a -4% reduction in BSFC (Brake Specific Fuel Consumption) due to adjustment made in (1).
- Model predicts a 6% increase in thermal efficiency, due to that noted in (1).
- Model calculates that 22.01% additional scavenge air, added to the total mass airflow, is supplied through the piston engine for piston/cylinder cooling, resulting in high scavenging efficiency plus dilution of exhaust gas for turbine inlet temperature control. Thus, the piston engine can be considered to have a delivery ratio of 122%.
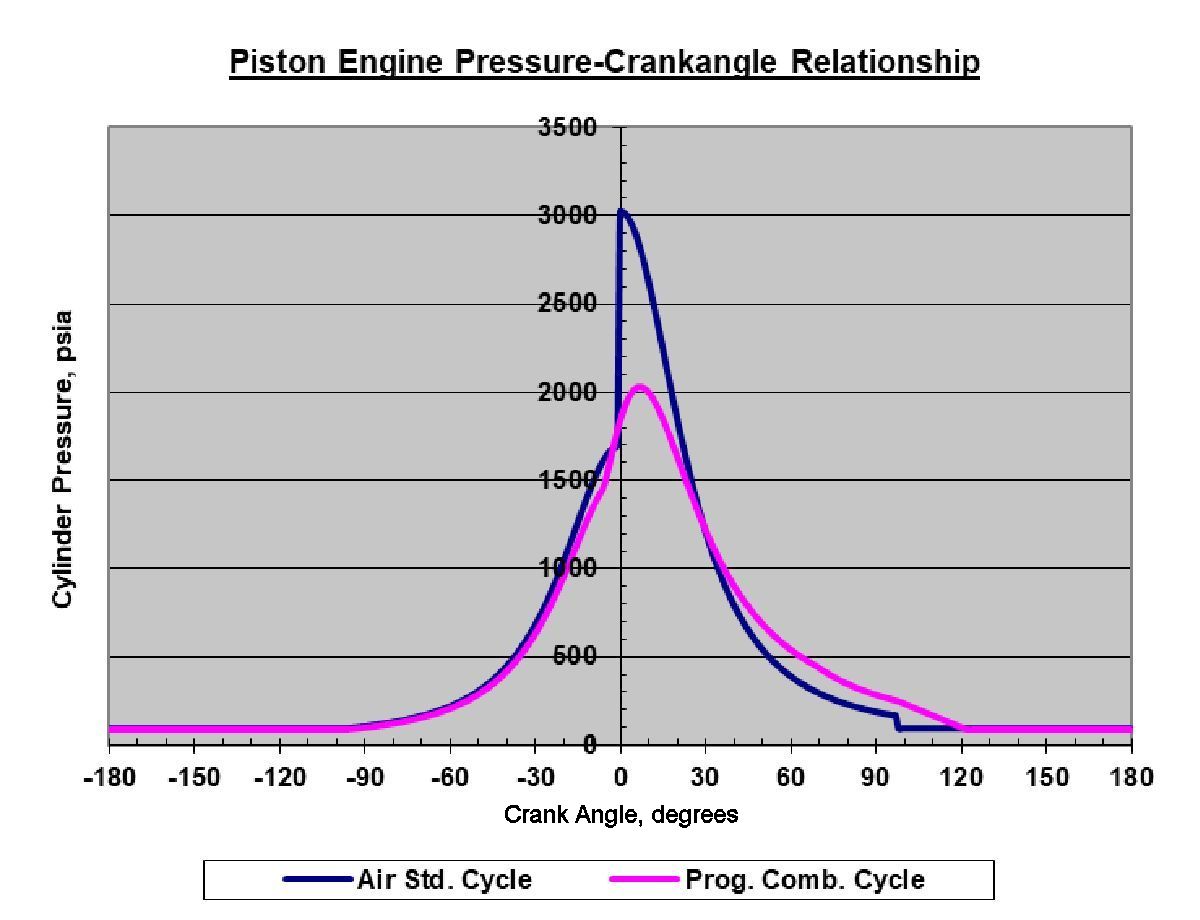
Figure 6 displays a cylinder pressure versus crank angle curve for the piston engine from the simulation. An air-standard cycle (dark blue) curve is also represented for academic interest and reference. The latter curve shows the distinct instantaneous cylinder pressure drop at EO of 97.2° ATDC (After Top Dead Center) whereas the progressive combustion cycle (Vibe model, magenta curve) shows a cylinder blowdown process occupying 18° of crank angle (arbitrarily selected, based on experience). Baseline pressure is 92.3 psia (compressor discharge pressure which is the scavenge air entrance pressure) with peak combustion pressure being 2,026.2 psia occurring at 7° crank angle ATDC.
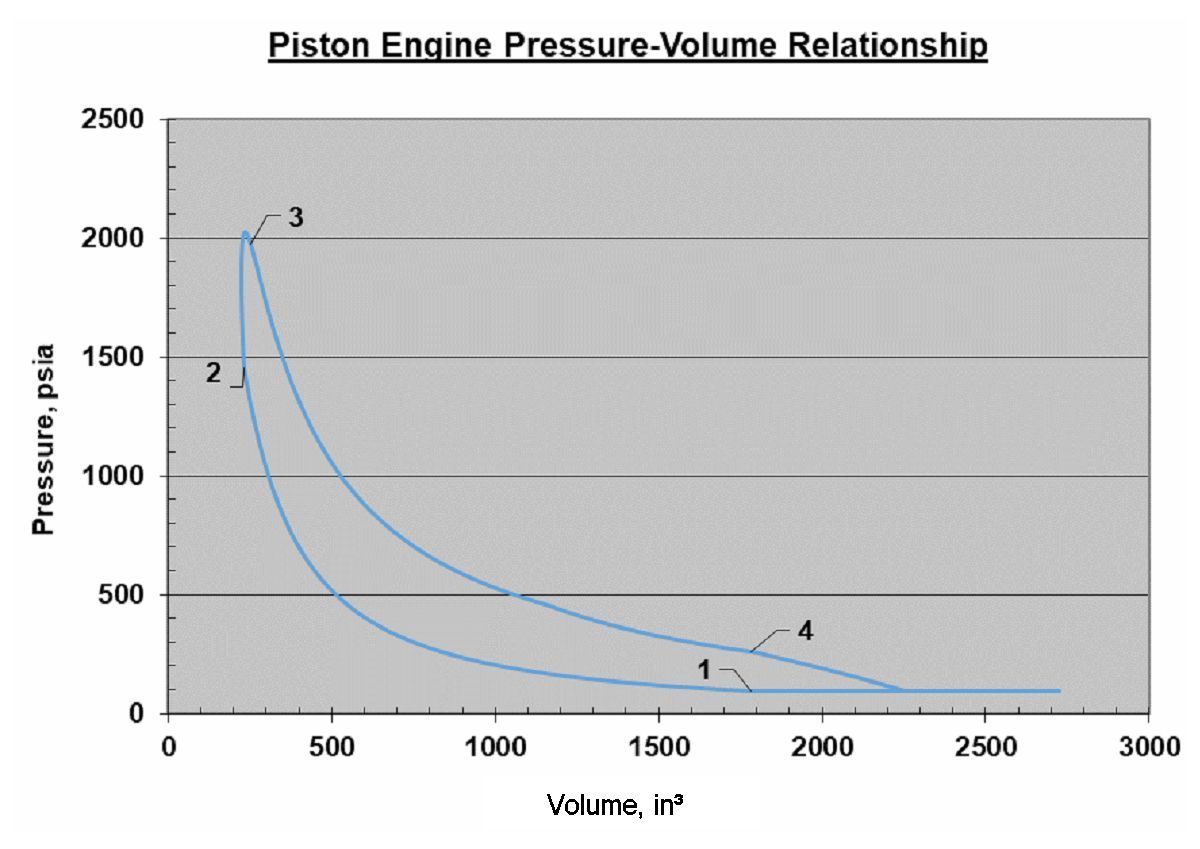
Figure 7 displays a cylinder pressure versus volume curve based on the total volume of the piston engine (swept + combustion chamber volume), and represents the entire reciprocating machine.
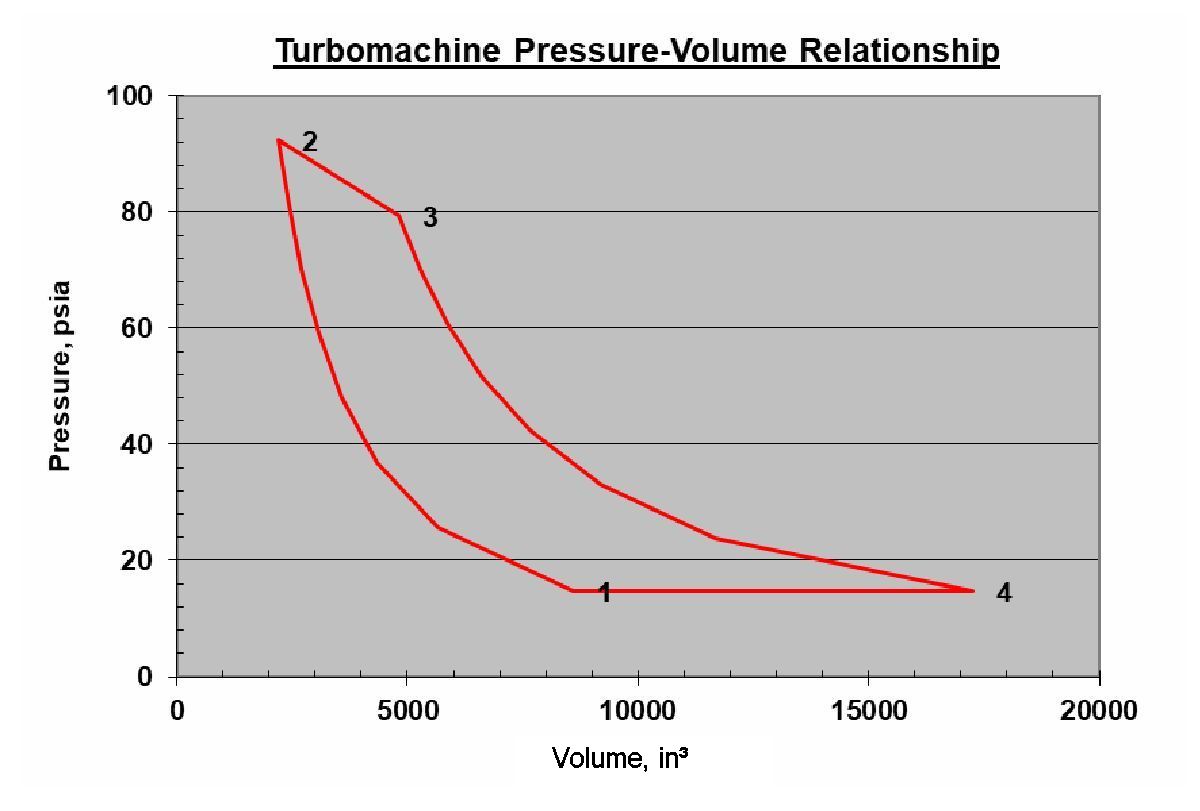
Figure 8 displays the pressure versus volume relationship of the turbomachine. Here baseline pressure is at ambient (14.696 psia, points 4 - 1) while peak is at the 92.3 psia delivery pressure (point 2). Note the slope from peak (point 2) to 79.3 psia (point 3) indicate the 13.0 psia pressure drop across the cylinders.
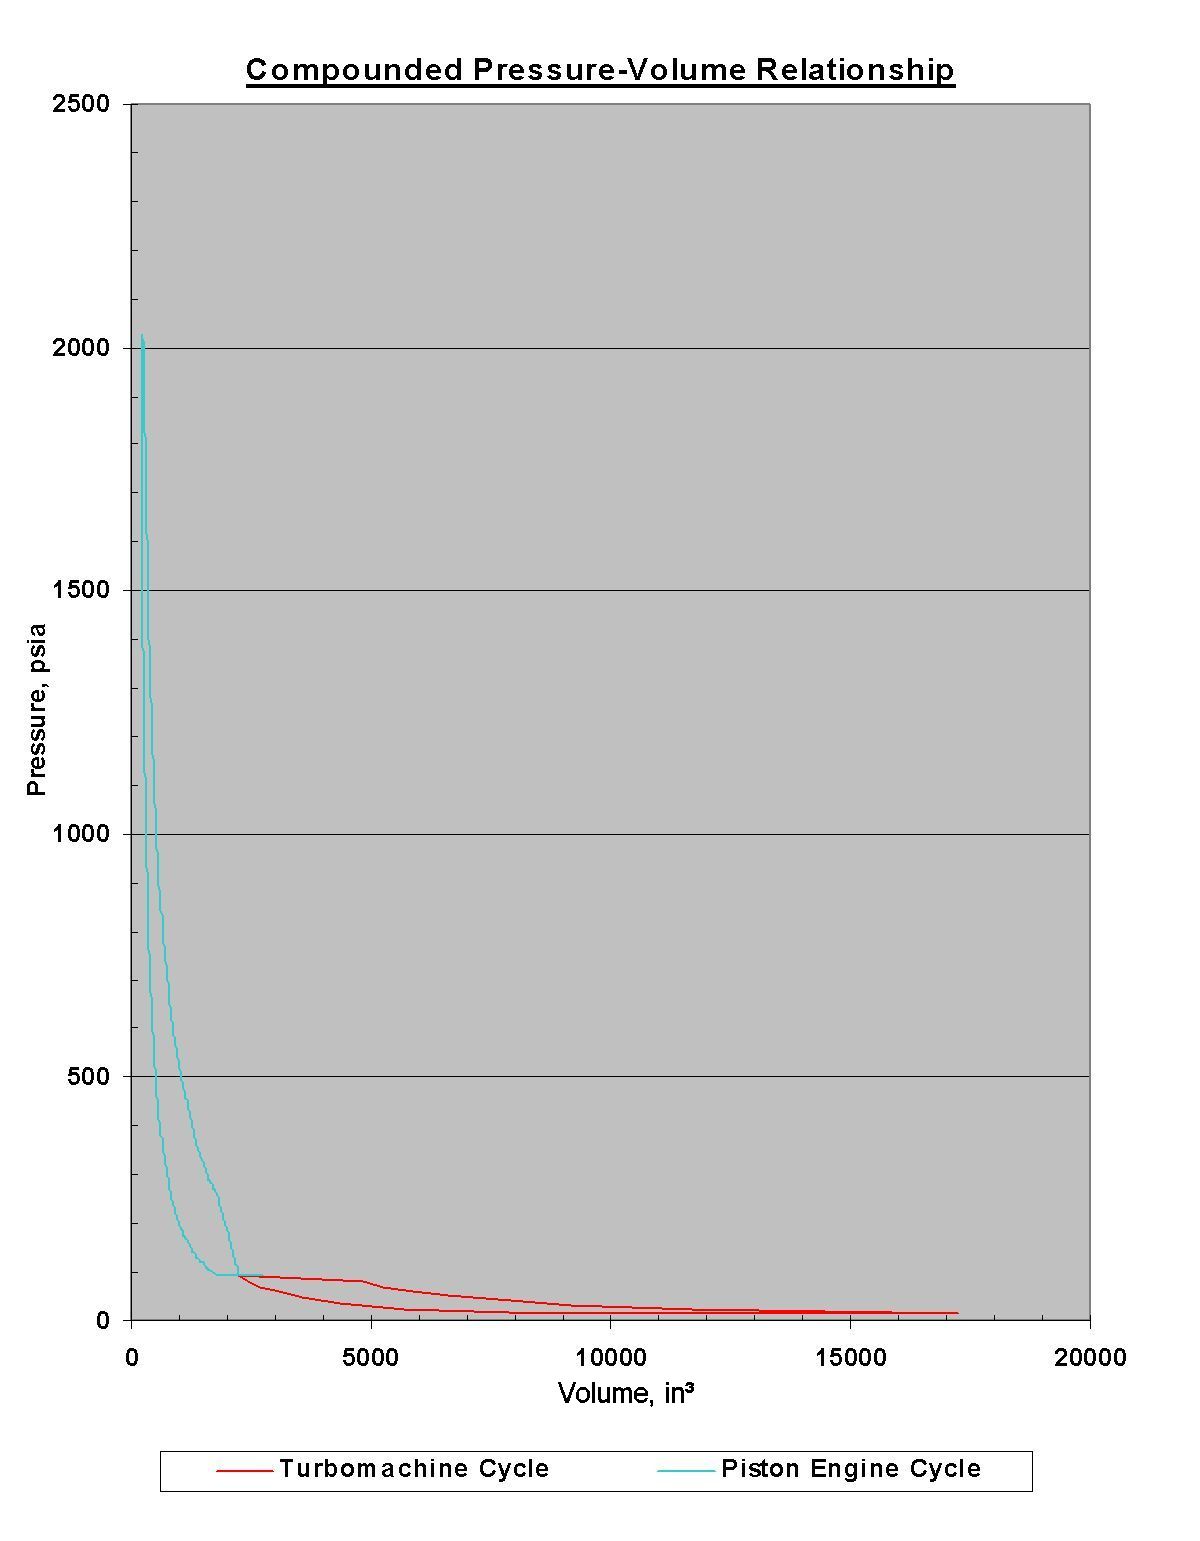
Figure 9 displays the high pressure - low volumetric piston engine with the low pressure - high volumetric displacement turbomachine plotted on the same ordinate and abscissa scales. This rather dramatically shows the significance of the two devices working in concert and the reason why the compound cycle is so beneficial in producing high power outputs with excellent thermal efficiency.
 |
 |
 |
 |
| Fig. 6. Piston Engine Pressure versus Crank Angle |
Fig.7. Pressure-Volume Relationship for Piston Engine |
Fig. 8. Pressure-Volume Relationship for Turbomachine |
Fig. 9. Pressure-Volume Relationship for Compound Cycle |
With the model calibrated and in good agreement with test data, a second simulation was run, again relying on data published in Reference 2. The second run was made at 7,750 feet altitude above MSL (Mean Sea Level) where it was stated that take-off boost (and thus maximum rated power) is still attainable. Detailed data at this altitude is not given in the cited reference so comparisons will be made with the previous model predictions for the same rated power setting at sea level. Note that trapped A/F ratio, compressor efficiency and turbine efficiency remain at the same values as in the previous simulation. Results are shown in Table 3.
| Baseline Simulation | 7,750 ft Simulation | % Difference | Notes | |
|---|---|---|---|---|
| Crankshaft rpm | 2,050 | 2,050 | ||
| Air/Fuel Ratio, Overall | 45.6 | 45.6 | ||
| Air/Fuel Ratio, Trapped | 36.6 | 36.6 | ||
| Compressor | ||||
| Efficiency | 0.76 | 0.76 | ||
| P2/P1 | 6.28 | 8.25 | 31% | (1) |
| P2, Discharge Pressure, psia | 92.3 | 90.9 | -1% | (2) |
| T2, Discharge Temperature, °F | 476.2 | 502.1 | 5% | (3) |
| Piston Engine | ||||
| P1, psia | 92.3 | 90.9 | -2% | (4) |
| T1, °F | 476.2 | 502.1 | 5% | (5) |
| P2, psia | 1,528.7 | 1,506.0 | -1% | (6) |
| T2, °F | 1,144.9 | 1,189.4 | 4% | (7) |
| P3, psia | 2,026.2 | 1,995.7 | -2% | (8) |
| T3, °F | 2,537.8 | 2,620.1 | 3% | (9) |
| P4, psia | 257.6 | 253.7 | -2% | (10) |
| T4, °F | 2,145.7 | 2,217.3 | 3% | (11) |
| ΔP Across Cylinders | 13.0 | 13.0 | 0% | (12) |
| Turbine | ||||
| Efficiency | 0.78 | 0.78 | ||
| P3/P4 | 5.4 | 7.07 | 31% | (13) |
| P3, psia | 79.3 | 77.9 | -2% | (14) |
| T3, °F | 1437.9 | 1487.9 | 3% | (15) |
| P4, psia | 14.7 | 11.02 | -25% | (16) |
| T4, °F | 801.4 | 752.5 | -6% | (17) |
| Complete Engine | ||||
| Compressor Power, bhp | -1,840 | -2,076.4 | 13% | (18) |
| Turbine Power, bhp | 2,250 | 2,599.5 | 16% | (19) |
| Net Turbine Power, bhp | 410 | 523.2 | 28% | (20) |
| Piston Engine Power, bhp | 2,660 | 2,619.2 | -2% | (21) |
| Transmission Loss, bhp | -20 | -25.5 | 27% | (22) |
| Total Shaft Power, bhp | 3,050 | 3,116.9 | 2% | (23) |
| Power Ratio, Piston/Turbine | 6.49 | 5.01 | -23% | (24) |
| Piston Engine BMEP, psi | 205.3 | 202.2 | -2% | (25) |
| BSFC, lbm fuel/bhp/hr | 0.328 | 0.329 | 0% | (26) |
| BSAC, lbm air/bhp/hr | 15.4 | 15.015 | -2% | (27) |
| Thermal Efficiency, % | 42.2 | 42.0 | 0% | (28) |
| Bypass/Total Airflow, mass % | 22.01 | 22.28 | 1% | (29) |
Notes: Numbered points in Table 3 (i.e., P1, T1, etc.) correspond to specific temperature and pressure state points appearing in Figure 7 for the piston engine and Figure 8 for the turbomachine.
- Pressure ratio adjusted to match that stated in test data. This would signify that turbomachine is now operating at maximum rpm.
- Model predicts a -1% reduction in delivery pressure due to altitude.
- Model predicts a 5% increase in discharge air temperature due to higher speed that the compressor is now operating.
- Scavenge air pressure the same as compressor discharge pressure.
- Scavenge air temperature the same as compressor discharge temperature.
- Model predicts a -1% reduction in compression pressure due to (2).
- Model predicts a 4% increase in compression air temperature due to (3).
- Model predicts a -2% reduction in peak cylinder firing pressure due to reduction in trapped charge density.
- Model predicts a 3% increase in peak combustion temperature due to (3).
- Model predicts cylinder pressure at EO reduced by -2% due to (8).
- Model predicts cylinder gas temperature at EO increased by 3% due to (9).
- Pressure drop across cylinders is the same as scavenge air mass flow is unchanged from sea level conditions.
- Model predicts pressure drop across turbine increased by 31%, entirely caused by reduced discharge pressure due to ambient pressure at altitude.
- Model predicts a -2% reduction in turbine inlet pressure due to (8)
- Model predicts a 3% increase in turbine inlet temperature due to (9). Note that the predicted temperature of 1,487.9°F is below the recommended maximum of 1,500°F [2].
- Turbine downstream pressure reduced by -25% due to reduced ambient pressure.
- Model predicts a -6% reduction in turbine downstream temperature due to (16).
- Model predicts a 13% increase in compressor power absorbed due to higher operating pressure ratio due to altitude.
- Model predicts a 16% increase in turbine power delivered due to higher operating pressure ratio due to altitude plus higher turbine inlet temperature.
- Model calculates a 28% increase in net turbomachine power contributed due to the effects of (18) and (19).
- Model predicts a -2% reduction in piston engine power due to inlet density reduction caused by the effects of (2) and (3).
- Model predicts a transmission power loss increase of -27% due to more power being contributed by turbomachine.
- Model predicts a 2% increase in overall power developed by engine mainly due to (19).
- Model predicts a Piston/Turbo power ratio of 5.01 versus a 6.49 ratio at sea level. This indicates that as altitude increases (lower inlet air density conditions), the turbomachine contributes more power to the overall sum.
- Model predicts piston engine BMEP is reduced by -2% due to altitude effects.
- Model predicts that BSFC remains unchanged.
- Model predicts that BSAC is reduced by -2% due to altitude effects.
- Model predicts a very slight decline in thermal efficiency caused by (21).
- Model predicts a 1% increase in bypass airflow due to (14).
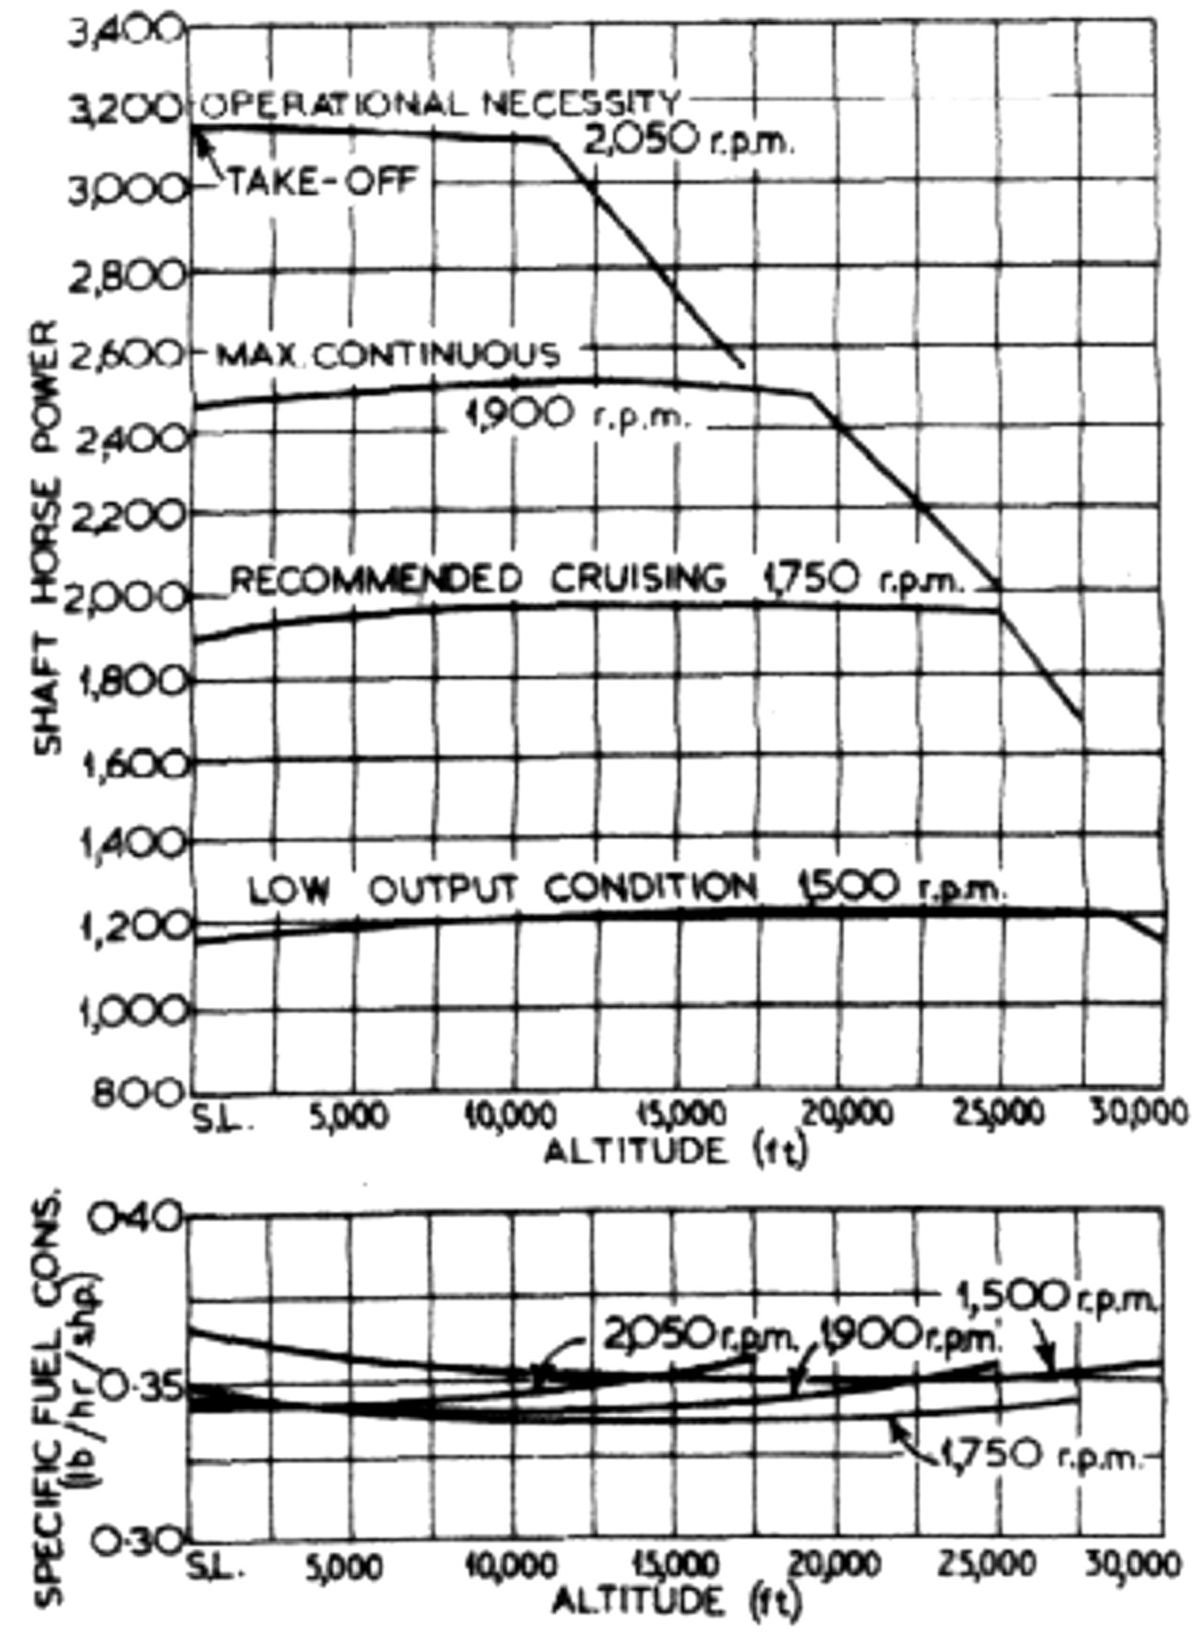
With the model now established and with reasonable accuracy and trends being displayed, the next undertaking was to run simulations of the Nomad II at a cruise power setting at varying altitudes. Reference 3 displays this information in graphical form as SHP (Shaft Horsepower) and BSFC and is reproduced here in Figure 10.
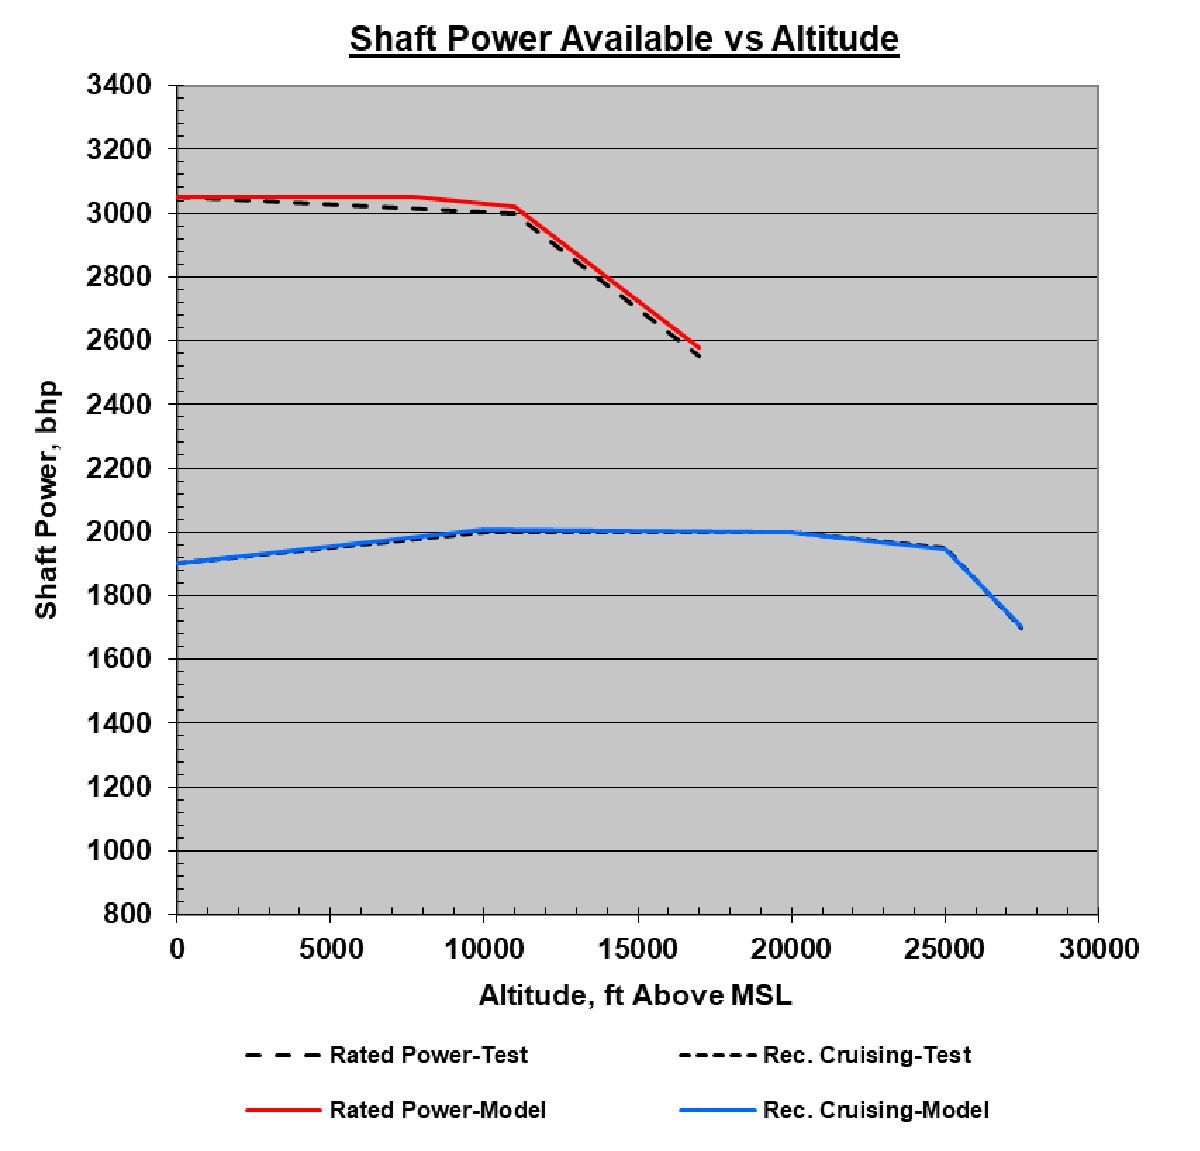
The values for rated power (shown in Fig. 10 as “operational necessity”) and “recommended cruising” are duplicated in Figure 11 with the model predictions overlaid for comparison. As can be seen, shaft power output is accurately represented.
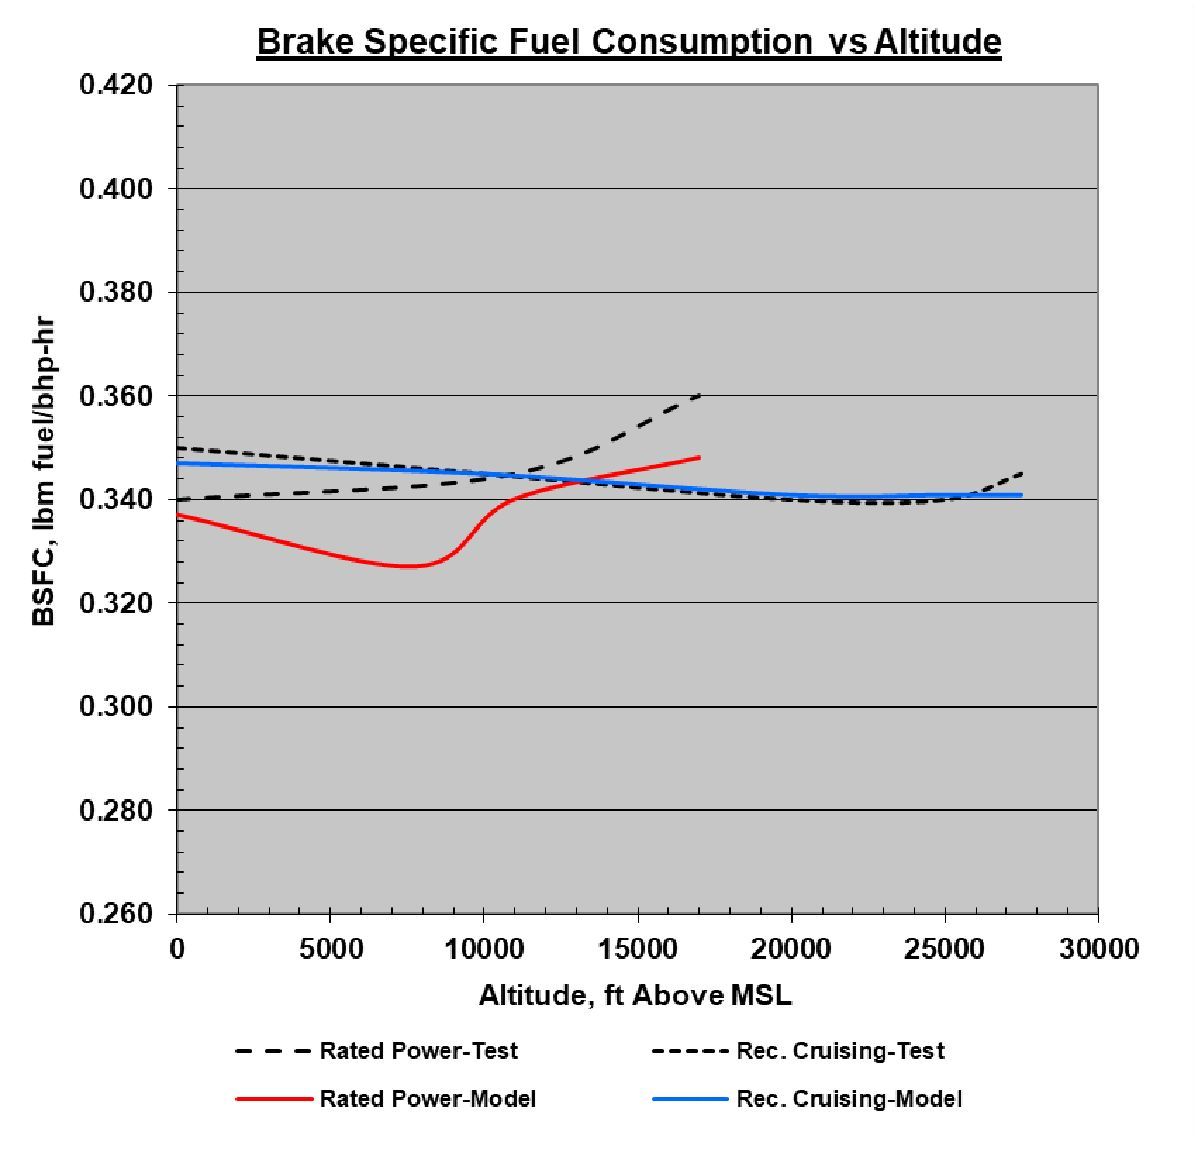
A BSFC comparison plot is shown in Figure 12. The model prediction shows slight discrepancy at rated power conditions but is quite accurate at cruise power settings.
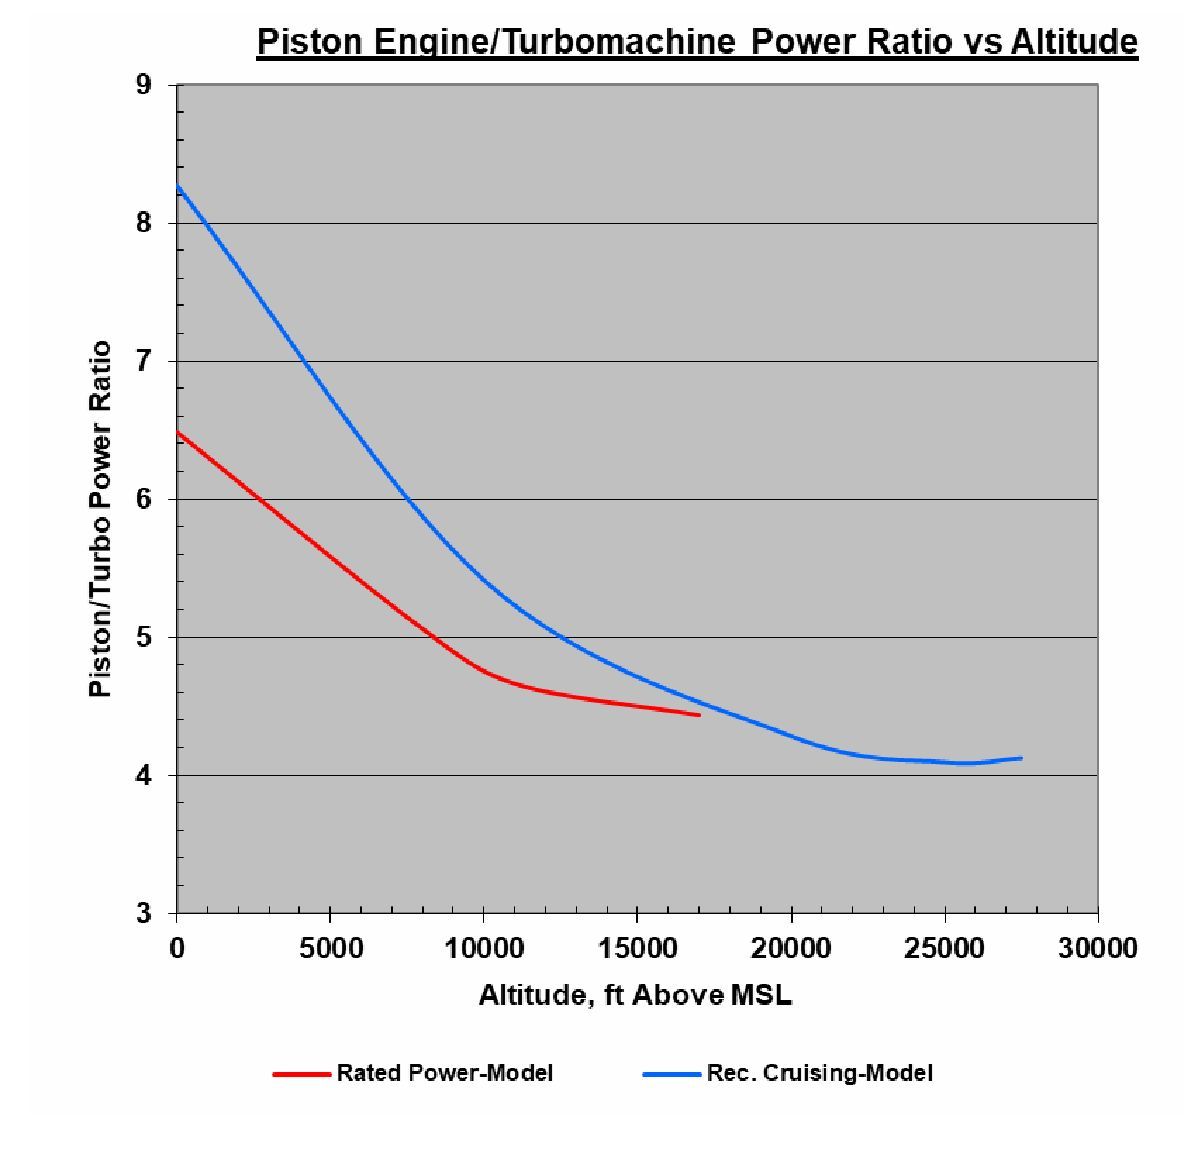
The model also predicts another interesting parameter not given in the original Napier data – that is the “power ratio” (here defined as piston engine shaft power / turbomachine shaft power) as altitude is varied. This is shown in Figure 13.
The negative slopes to both the rated and cruising engine power ratios versus altitude show that the turbomachines contribution to the overall shaft power output increases with altitude. This is the main reason why compound cycle engines maintain high thermal efficiency as altitude increases. The effect is more noticeable at the cruise power settings.
 |
 |
 |
 |
| Fig. 10. Nomad II Test Data [3] | Fig. 11. Power Comparison Model versus Test Data |
Fig. 12. BSFC Comparison Model versus Test Data |
Fig. 13, Power Ratio Piston/Turbomachine |
An explanation as to the model solution methodology at part load and varying inlet density is in order here:
- The lack of performance maps of the compressor and turbine used involves setting both efficiencies of these components to fixed values (76% and 78% respectively, as determined in the sea level – rated power study), with values remaining fixed for all altitudes and power settings. We know that variable inlet guide vanes were used on the compressor that would have an effect on efficiency at varying altitudes and engine speeds/loads [2]. Additionally, differing mass flow rates and pressure ratios would alter efficiencies of both compressor and turbine.
- A/F ratio is the fundamental control of a CI engine output and applies equally to this compound cycle. A/F ratios are not specified in the test data for the different conditions, although indirectly, BSFC values are specified.
- It is assumed that the Beier transmission is optimally controlled such that at a given crankshaft speed and power output, the turbomachine is delivering an optimal power contribution via its speed relationship to the crankshaft.
- We are dealing with multiple input variables here – these being turbomachine airflow rates, A/F ratio,and inlet density variations.
With these formidable constraints defined, the solution algorithm was as follows:
- Determine an A/F ratio to deliver the total engine shaft horsepower target value at selected inlet air density.
- Adjust compressor flow rate to maintain a piston engine delivery ratio of 119 – 122% by mass. This compensates for the unknown compressor speed and efficiency data. The maximum pressure ratio to not exceed 8.25 [2].
- Check that compressor volumetric flow rate matches that of the piston engine. If out of bounds, recalculate 2 and compare.
- Compare predicted BSFC value to test value. If not in reasonable agreement, go to 1 and repeat calculation.
- Calculation rejected if endless loop occurs or output values are outside of the range of realistic and logical values.
Solution convergence always occurred within a maximum of 3 iterations.
Some of the additional predicted information of importance is mentioned:
- Cruise power is stated as a crankshaft speed of 1,750 rpm. From a propeller load curve (3rd order approximation based on 3,050 rated SHP @ 2,020 rpm), this is a 62.2% power setting.
- Trapped A/F ratios for the cruise power study ranged from 26.5 (27,000 ft) to 59.3 (sea level). This is totally in the range of normal CI engine operation.
- For some conditions, turbine inlet temperature exceeded 1,500°F. Highest noted was 1,534°F. This indicates the importance of maintaining a minimum of 20% excess airflow (by mass) through the piston engine during the open cycle.
- Pressure drop across cylinders is a critical parameter, affecting cylinder scavenging and thus purity of trapped air charge. At higher altitudes, this factor can become significant. Using methods outlined in Reference 5, this value was checked at a density altitude of 30,000 feet at 50% power. Minimum pressure drop was calculated from said reference to be 4.4 psi and model predicts 4.4 psi at this power setting. It is interesting that 30,000 feet is the highest operational altitude reflected in the Napier data.
Further work is planned to validate all of the operating points from those shown in Figure 10 and to examine trends in various operating parameters to further refine the model. Exploring the overall engine performance effects for variations in exhaust port timings, compression ratios, piston engine operating speeds, boost pressures, and turbine characteristics can now be readily and quickly determined.
Future Possibilities
With the interest nowadays in aircraft piston engines that burn jet fuel, the writer feels that this compound engine cycle should be revisited. A range now dominated by shaft power turbine aircraft engines is the 450 – 1,000 bhp sized machines. Small shaft power turbines in this range are notorious for poor thermal efficiency but this is the area where the compound cycle excels. The compound engine will never match the turbine with regard to installed weight and size –its multiple advantages lie in lower fuel burn per power developed, lower initial first cost, lower operating costs, and less cost to overhaul. Here is a comparison of an envisioned “mini” Nomad with a popular turboprop engine, as shown in Table 4. Note the same power/weight ratio for the full-size Nomad of 1.25 bhp/lbm is used here with the rated shaft power output being the same for both engines considered.
| Rated Shaft Power, bhp | Dry Weight, lbm | Power/Weight Ratio | BSFC, lbm fuel/bhp/hr | % Weight Increase, B to A |
% Fuel Economy Increase, B to A | |
|---|---|---|---|---|---|---|
| Engine A | 578 | 270 | 2.14 | 0.670 | ||
| 168% | 191% | |||||
| Engine B | 578 | 723 | 1.25 | 0.350 |
The weight increase could be largely offset by the less weight in fuel for a given mission. The compound engine would use virtually half that of the turbine for the same power output.
A modern engine in this shaft horsepower range is envisioned to be constructed as follows:
- Piston engine – Six-cylinder opposed two-stroke CI engine with 3-throw crankshaft, liquid cooled, Schnuerle loop scavenged. A counter-rotating primary balance shaft would be required to cancel the inertia couple. Shaft could perform double duty as a quill shaft for power transfer.
- Turbomachine – Two stage, centrifugal compressors, single stage radial inflow turbine of simple, compact design.
- Power Coupling Device –Power transfer between piston engine and turbomachine would be via electric motor-generators.
- Fuel System – High pressure common rail or other modern direct cylinder injection system.
- Ignition System – Glow plugs for starting and sustaining combustion during light load conditions.
- Control system – FADEC (Full Authority Digital Electronic Control) featuring single-lever operation, controlling fueling rate, propeller pitch, power transfer and load sharing, and correcting for density altitude to extract maximum efficiency.
Details on the following components are discussed as follows:
- Piston Engine – By maintaining the same power ratio of 6.5 at rated condition and a design total of 578 shaft hp, the piston engine is required to produce 501 bhp. Designing for a maximum BMEP of 205 psi (same as the Nomad) and by turning this smaller engine faster, say 3,500 rpm, a displacement of 276.5 in3 is required. A propeller speed reduction system would be necessary. It is envisioned that the specific power of 1.25 bhp/lbm could be improved.
- Turbomachine – Using modern day centrifugal compressors in series (two stages required), pressure ratios of 10 are readily achieved with high adiabatic efficiency. The same high efficiency holds for a single radial inflow turbine. Components could possibly be borrowed from modern day turbochargers. The centrifugal configurations greatly reduce size, weight and cost when compared to axial flow machines.
- Power Coupling Device – The use of electric motor-generators on both crankshaft and turbomachine shaft allows for efficient power transfer between the two machines. This would eliminate a heavy mechanical transmission and allow for better and more precise load sharing. Electric coupling allows for direct cranking of piston engine for starting plus turbomachine motoring/assist during starting, light-load, and transient operation. Combined with emerging battery technology, the crankshaft mounted electric motor could augment the total power output for take-off or emergency conditions.
- Fuel System – Modern, high-pressure, electronically controlled fuel injection would greatly compliment this compound cycle. Current automotive systems can run in excess of 14,000 psi, 3.8 times higher than what was used on the Nomad II. Higher injection pressure combined with flexibility in timing injection events and the use of multiple events, can dramatically tailor the combustion process. This can be used effectively for limiting peak cylinder pressures without detracting from target BMEP. Post injection can accurately control turbine inlet temperatures to maximize power contributed by the turbine for certain operating points.
- Ignition System – A simplification over the system used on the original Nomad II would be the use of glow plugs for starting and light load (ground) operations. Glow plugs require no timed or complex ignition system.
- Control System – A modern FADEC control would monitor all functions mentioned above, allowing for precise and optimum control of all engine parameters, easing pilot workload and maximizing engine efficiency for all in-flight conditions.
The technology now exists to build a modern version of the Nomad II with substantially better specific power output, and with equally attractive, low specific fuel consumption. Such an engine would be well-suited for numerous airplane and helicopter applications. The ability to operate on turbine engine fuels is seen as a significant advantage.
Conclusion
From this study, it appears that all published data on the Napier Nomad II engine is indeed valid and does not violate any thermodynamic bounds of piston or turbomachine operation, as modeled by typical methods listed in the references. A compound engine cycle offers attractive benefits in high specific power outputs combined with low specific fuel consumption. The computer model created utilizes a closed-form solution for calculating trends in the performance capabilities of this type of compound engine. It should prove useful in the design of new machines and when compressor and turbine maps are furnished, will allow theoretical performance predictions to be made with accuracy, without the reliance on pre-obtained test data for model calibration.
Even though extensive and successful testing was performed during the Nomad program, both in the laboratory and in flight via a converted Avro Lincoln bomber, the engine never made it to production status. History shows that the Nomad was planned for release at a time when the turboprop and turbojet engines were already in service and had a firm foothold in the market [4]. The advantages of a highly fuel-efficient aircraft engine were just not a top priority at the time, thus canceling the project.
The Napier team is to be admired in the design and development of the Nomad II, especially so when the only engineering calculating device available at the time was the slide rule!
References
1. Alan Vessey, By Precision Into Power – A Bicentennial Record of D. Napier & Son, The History Press, Glouchestershire, GL5 2QG, 2010.
2. Herbert Sammons and Ernest Chatterton, “Napier Nomad Aircraft Diesel Engine”, SAE Transactions, Volume 63, Society of Automotive Engineers, Warrendale, PA, 1955.
3. W.T.G., “Napier Nomad – An Engine of Outstanding Efficiency”, Flight Magazine, April 1954.
4. William Pierce, “Napier Nomad Compound Aircraft Engine”, https/oldmachinepress.com, May 2019.
5. Paul H. Schweitzer, Scavenging of Two-Stroke Cycle Diesel Engines, The MacMillan Company, New York, 1949.
6. Gordon P. Blair, Design and Simulation of Two-Stroke Engines, Society of Automotive Engineers, Warrendale, PA, 1996.
7. Karl Zinner, Supercharging of Internal Combustion Engines, Springer-Verlag, Berlin Heidelberg New York, 1978.
8. “The Standard Atmosphere”,https://engineering.purdue.edu/~andrisan/Courses/AAE490A _S2002/Atmosphere.pdf
About the Author
J. David Kirk graduated from Vanderbilt University in 1976 with a Bachelor�s Degree in Mechanical Engineering. David has over 32 years of consecutive employment with five different major engine manufacturers. His background includes positions as Senior Staff Engineer, Research and Development Engineer, and Senior Project Engineer. David�s expertise in the engine field comprises machines displacing from 2 to 4,500 in�, both two and four-stroke operational cycles, and various ancillary and accessory subsystems. David holds seven patents in the internal combustion engine field, and is a member of the Society of Automotive Engineers and American Society of Mechanical Engineers. Since retiring in 2008 David runs his own business, Kirk Engines, Inc., specializing in engineering consultation.