In-brief analysis
Aug 28, 2026
U.S. uranium production more than tripled in 2025 and was the highest since 2017
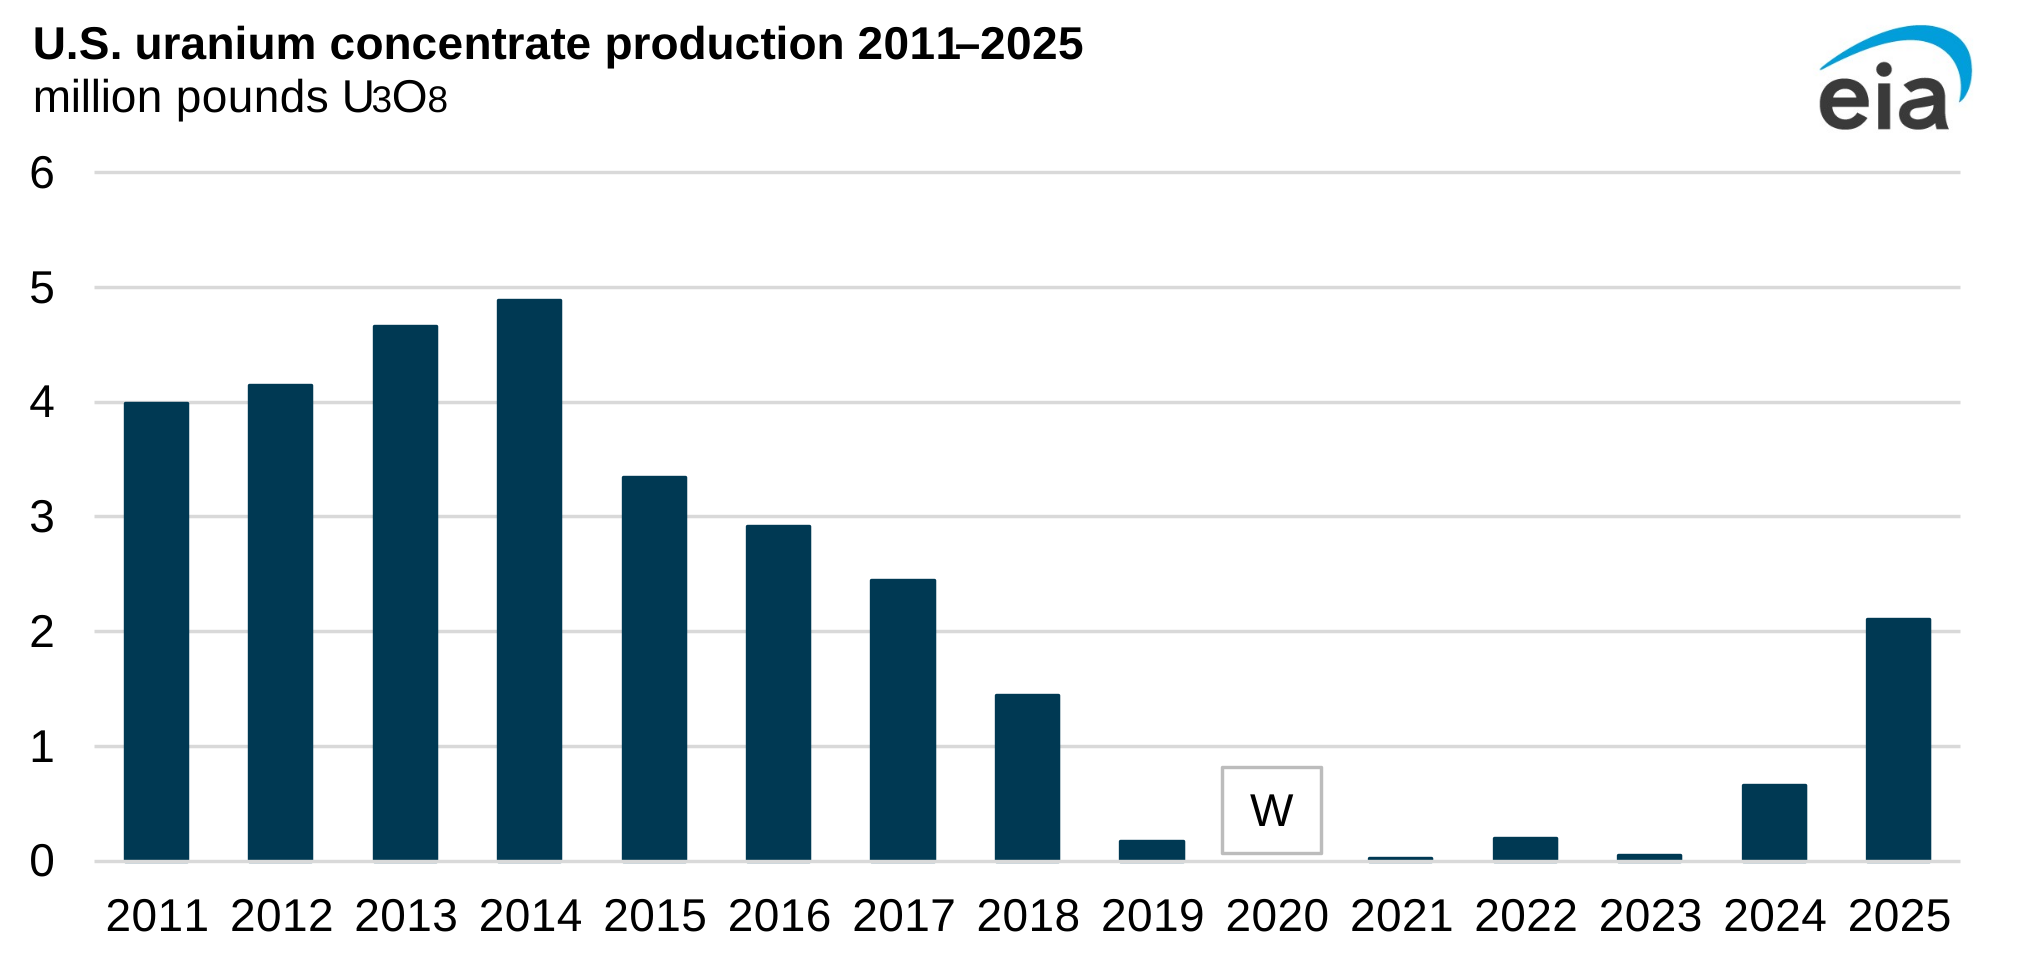
In 2025, uranium concentrate production in the United States totaled 2.1 million pounds of triuranium octoxide (U3O8), the base component of nuclear reactor fuel. U.S. U3O8 production in 2025 was the most since 2017 and more than triple the volume produced in 2024.
In-brief analysis
Aug 26, 2026
Eight petroleum liquids pipeline projects have been completed since the start of 2025
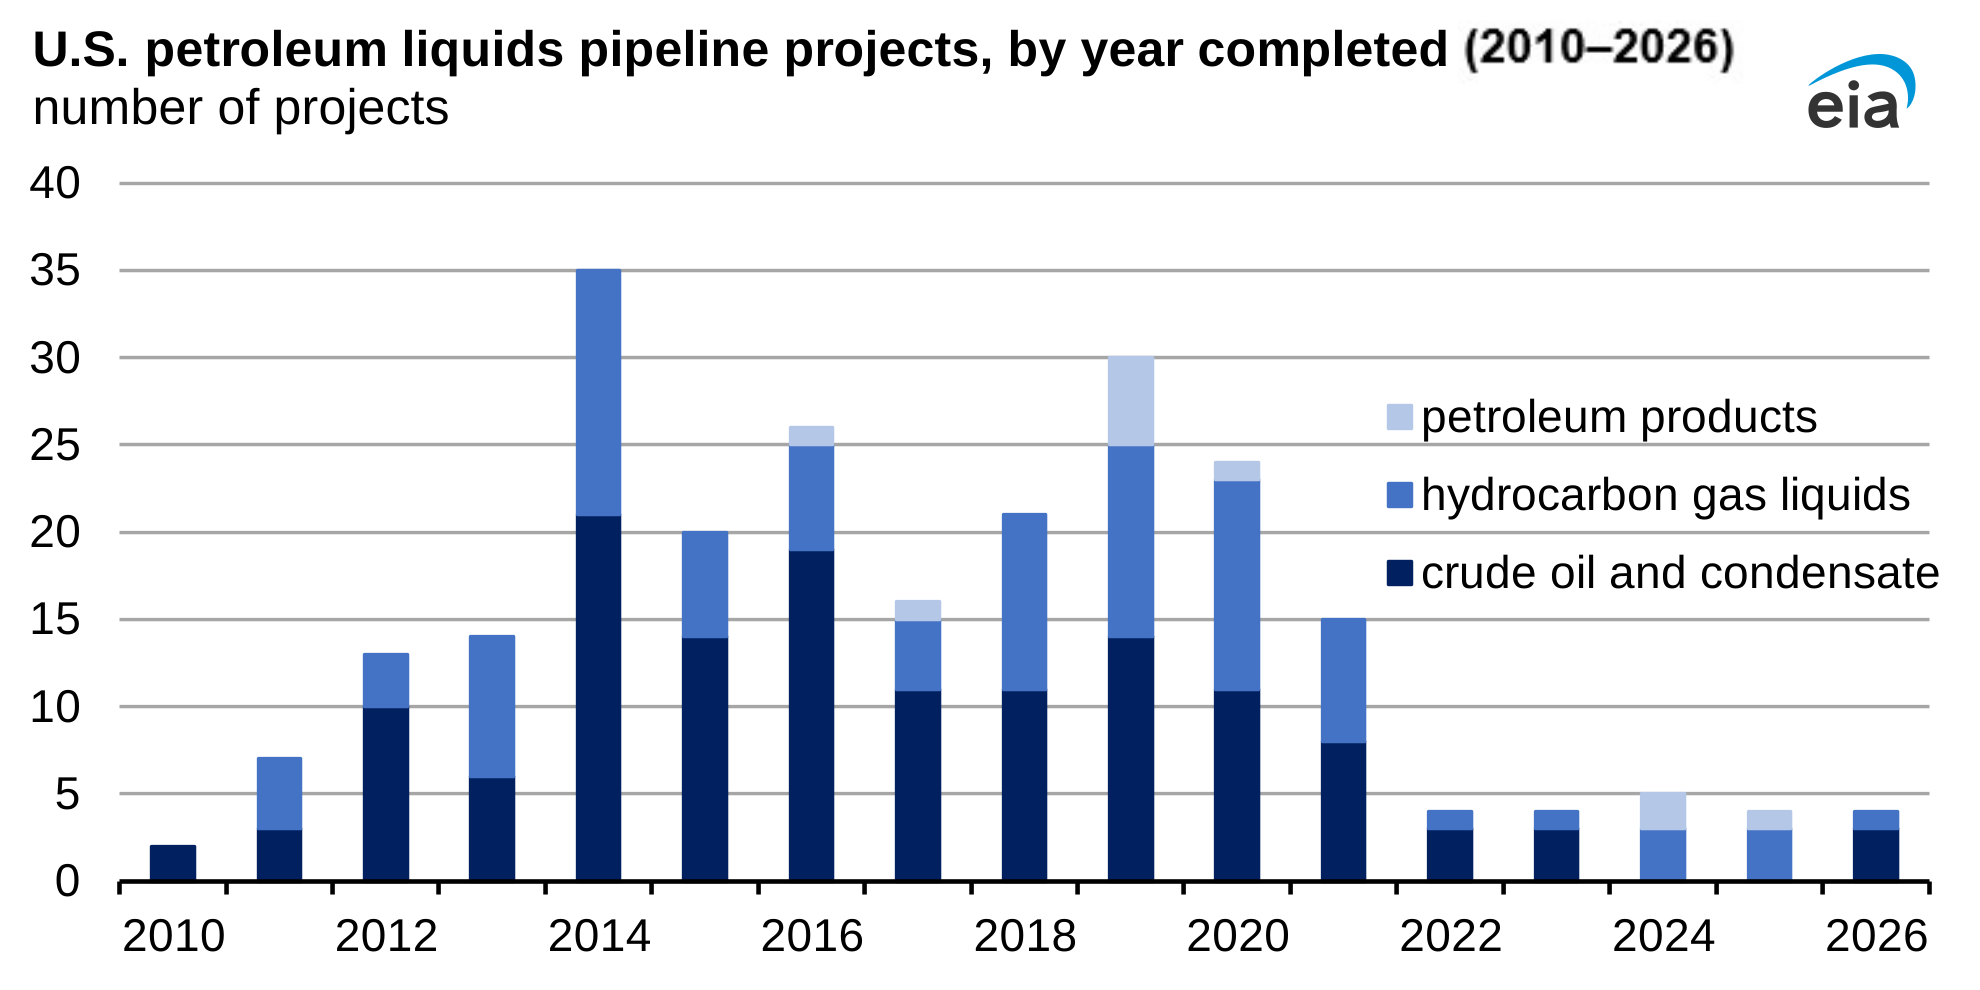
In the 2026 release of our Liquids Pipeline Projects Database, we tracked the completion of 8 liquid fuels pipeline projects since the start of 2025, and an additional 14 new projects have been announced.
In-brief analysis
Aug 24, 2026
Dangote refinery drives increase in petroleum shipments from Nigeria
Data source: Vortexa Analytics
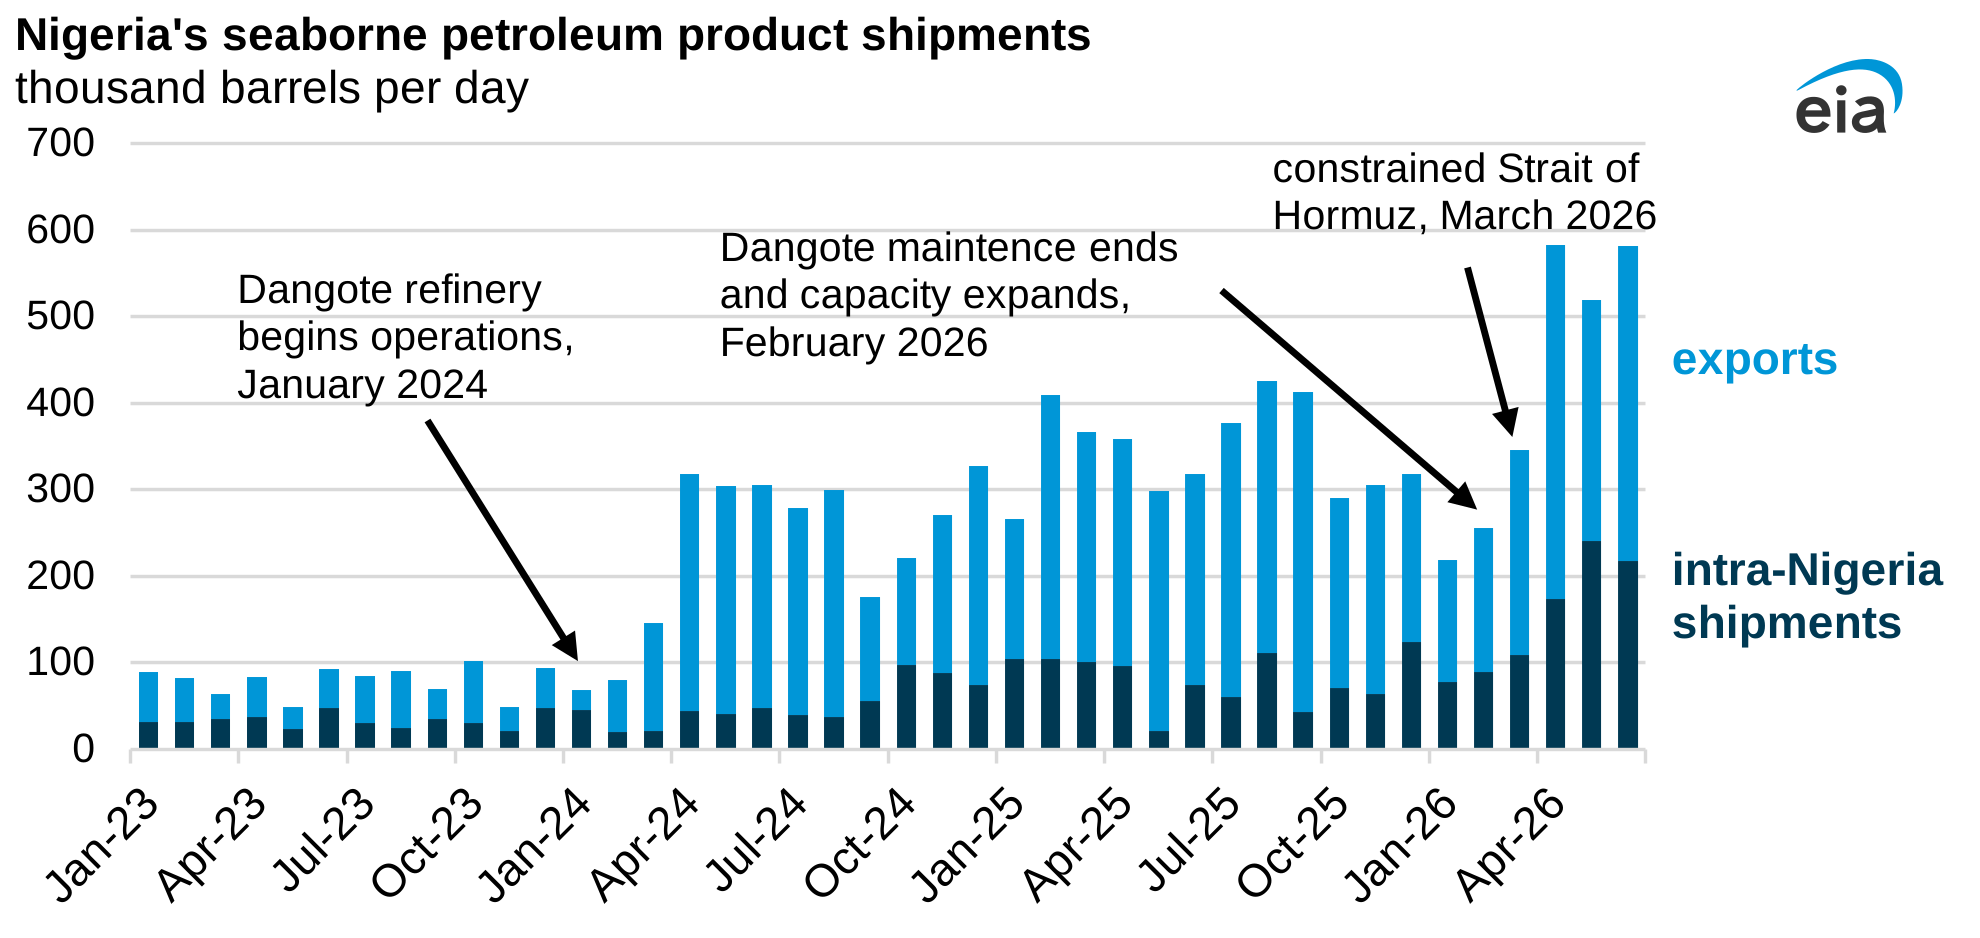
Note: Intra-Nigeria shipments are shipped between ports within Nigeria.
Seaborne petroleum product exports from Nigeria have grown seven-fold since 2023, playing an increasing role in the international market for petroleum products at a time when supplies from other areas have been constrained.
In-brief analysis
Aug 19, 2026
Longer wells boost Permian crude oil and natural gas production
Data source: Enverus
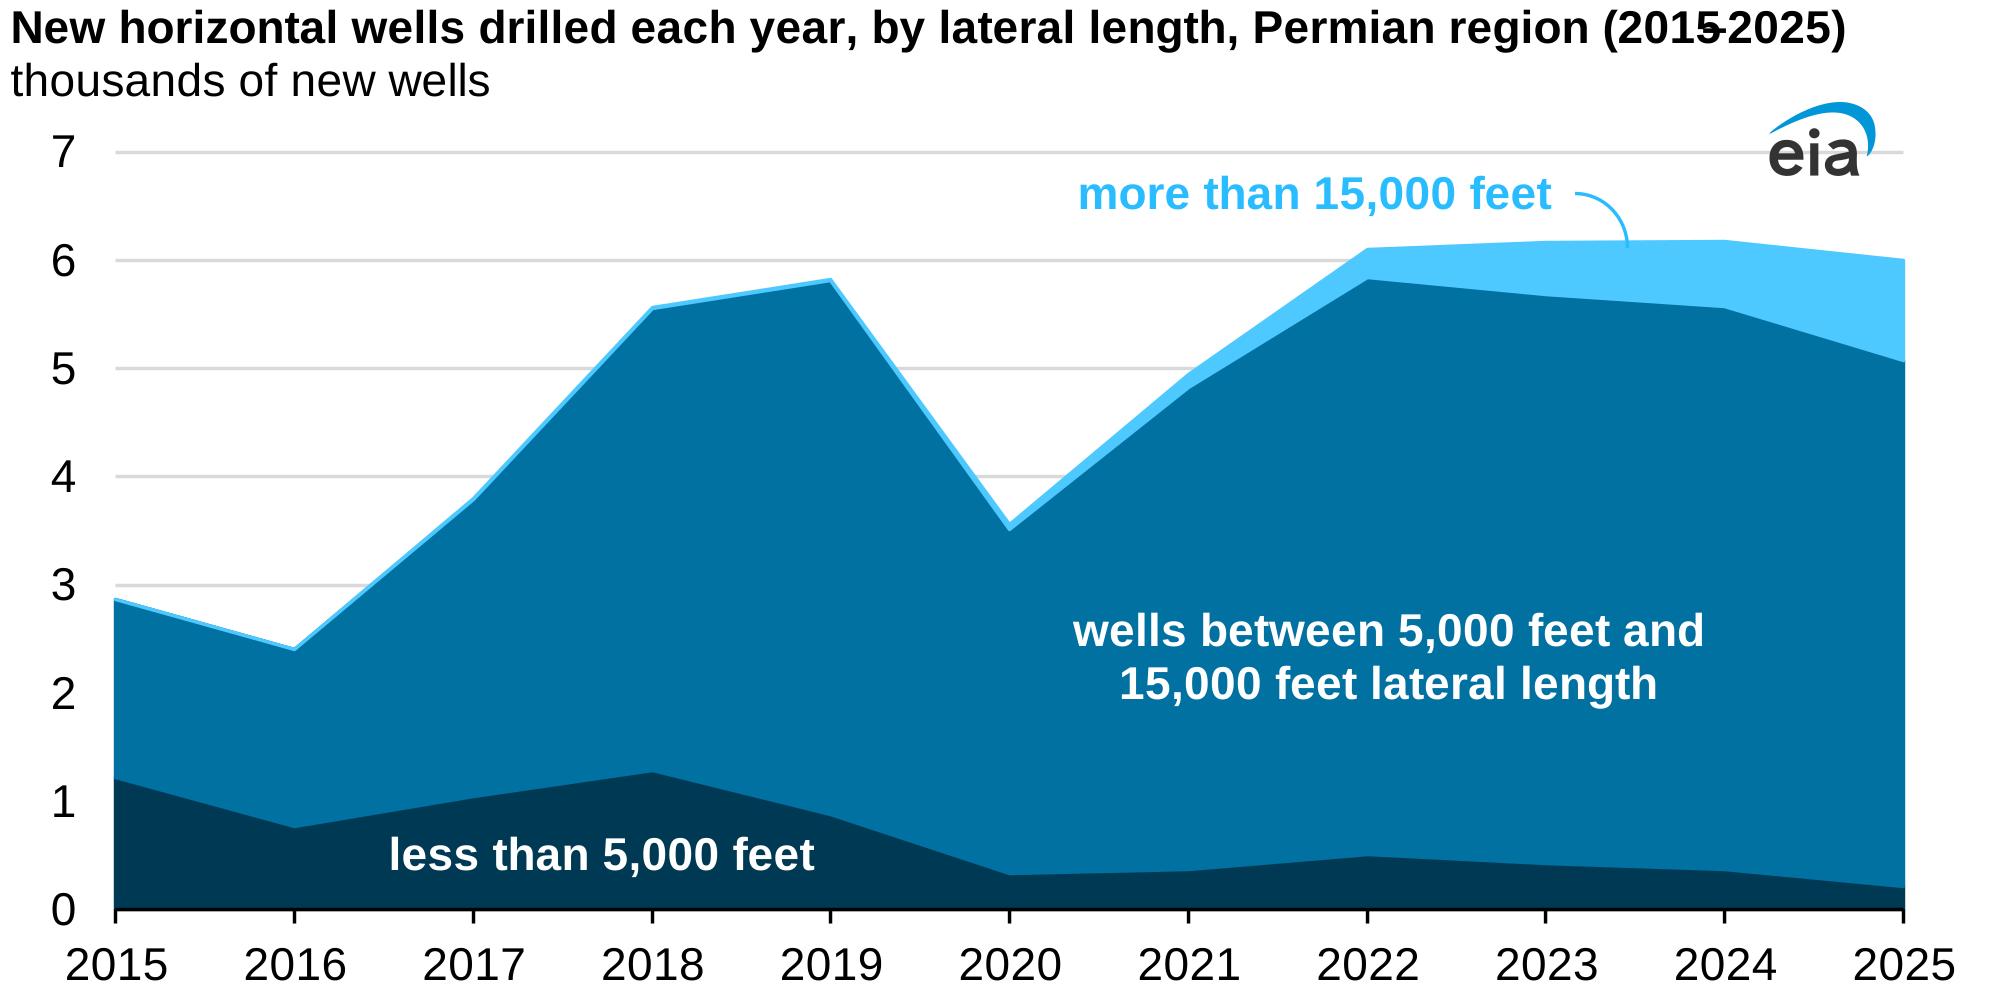
Well operators in the Permian region of western Texas and eastern New Mexico are getting more oil and gas out of the ground by drilling longer, horizontal wells and increasingly incorporating so-called super-lateral wells that exceed 15,000 feet.
In-brief analysis
Aug 17, 2026
Waterborne shipments from the U.S. Gulf Coast increased in April and May
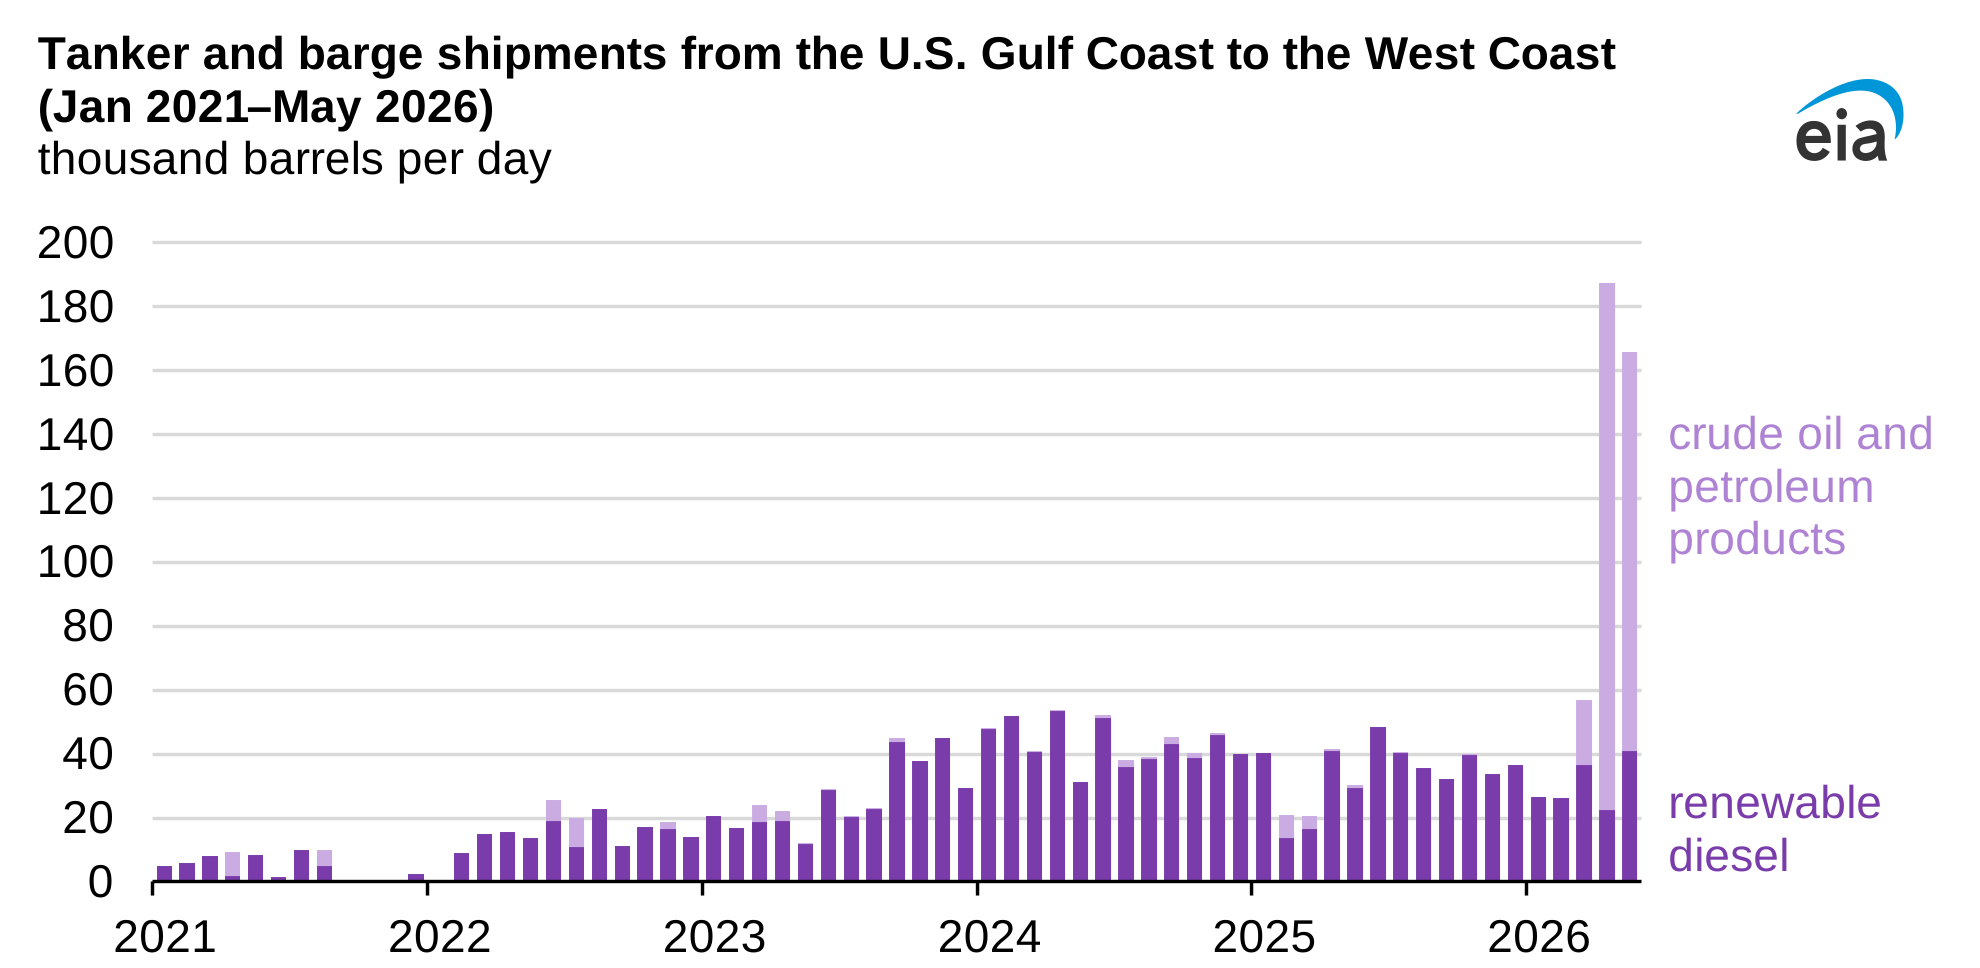
Waterborne shipments of crude oil and petroleum products from the U.S. Gulf Coast (PADD 3) to the West Coast (PADD 5) more than quadrupled year-on-year in April and May following a waiver that permitted a broader group of ships to travel between U.S. ports. Shipments from the U.S. Gulf Coast to the East Coast (PADD 1) also increased.
In-brief analysis
Aug 12, 2026
United States on track for record natural gas production in 2026
Data source: U.S. Energy Information Administration, Short-Term Energy Outlook, August 2026
Note: 1H2026=first half of 2026
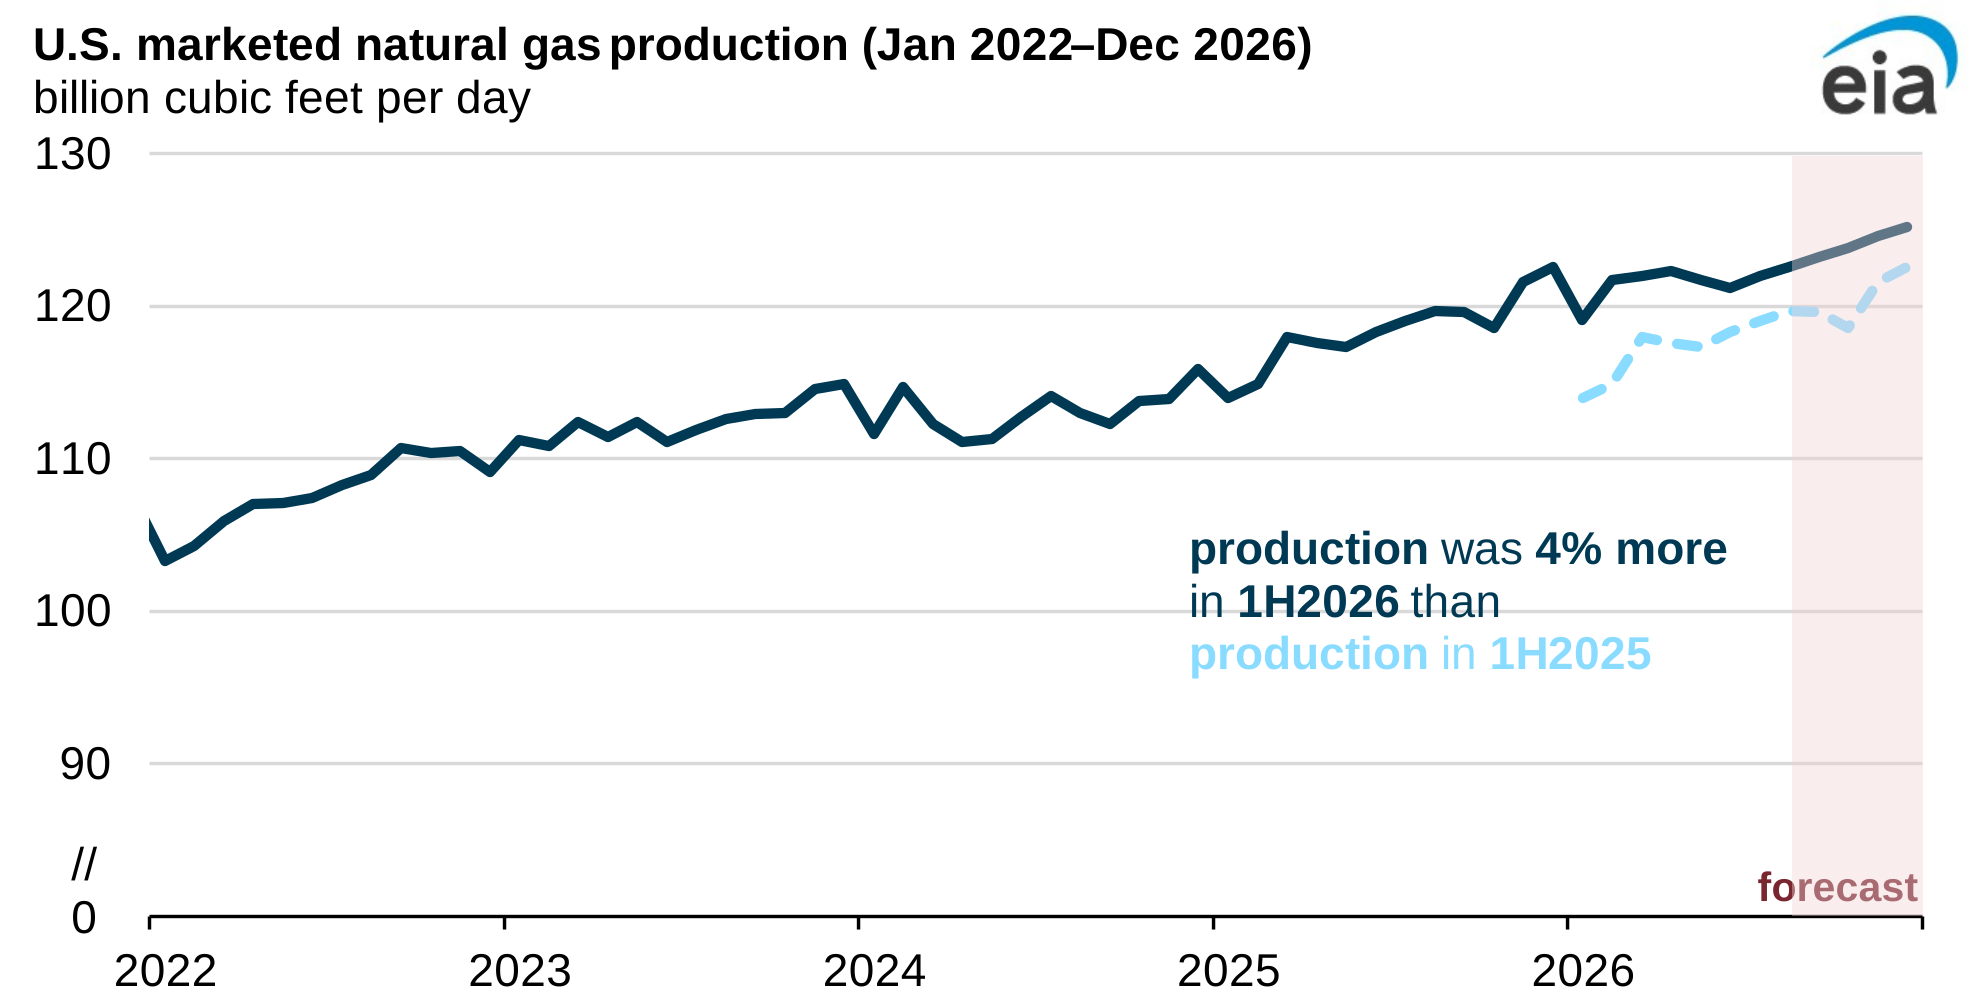
We forecast U.S. marketed natural gas production will average 122.5 billion cubic feet per day (Bcf/d) in 2026, surpassing the previous record of 118.5 Bcf/d set in 2025, in our August 2026 Short-Term Energy Outlook (STEO).
In-brief analysis
Aug 10, 2026
Duration of power outages in Puerto Rico not caused by major events increased 19% in 2025
Data source: U.S. Energy Information Administration, Annual Electric Power Industry Report
Data values: Reliability—2025 Data Early Release
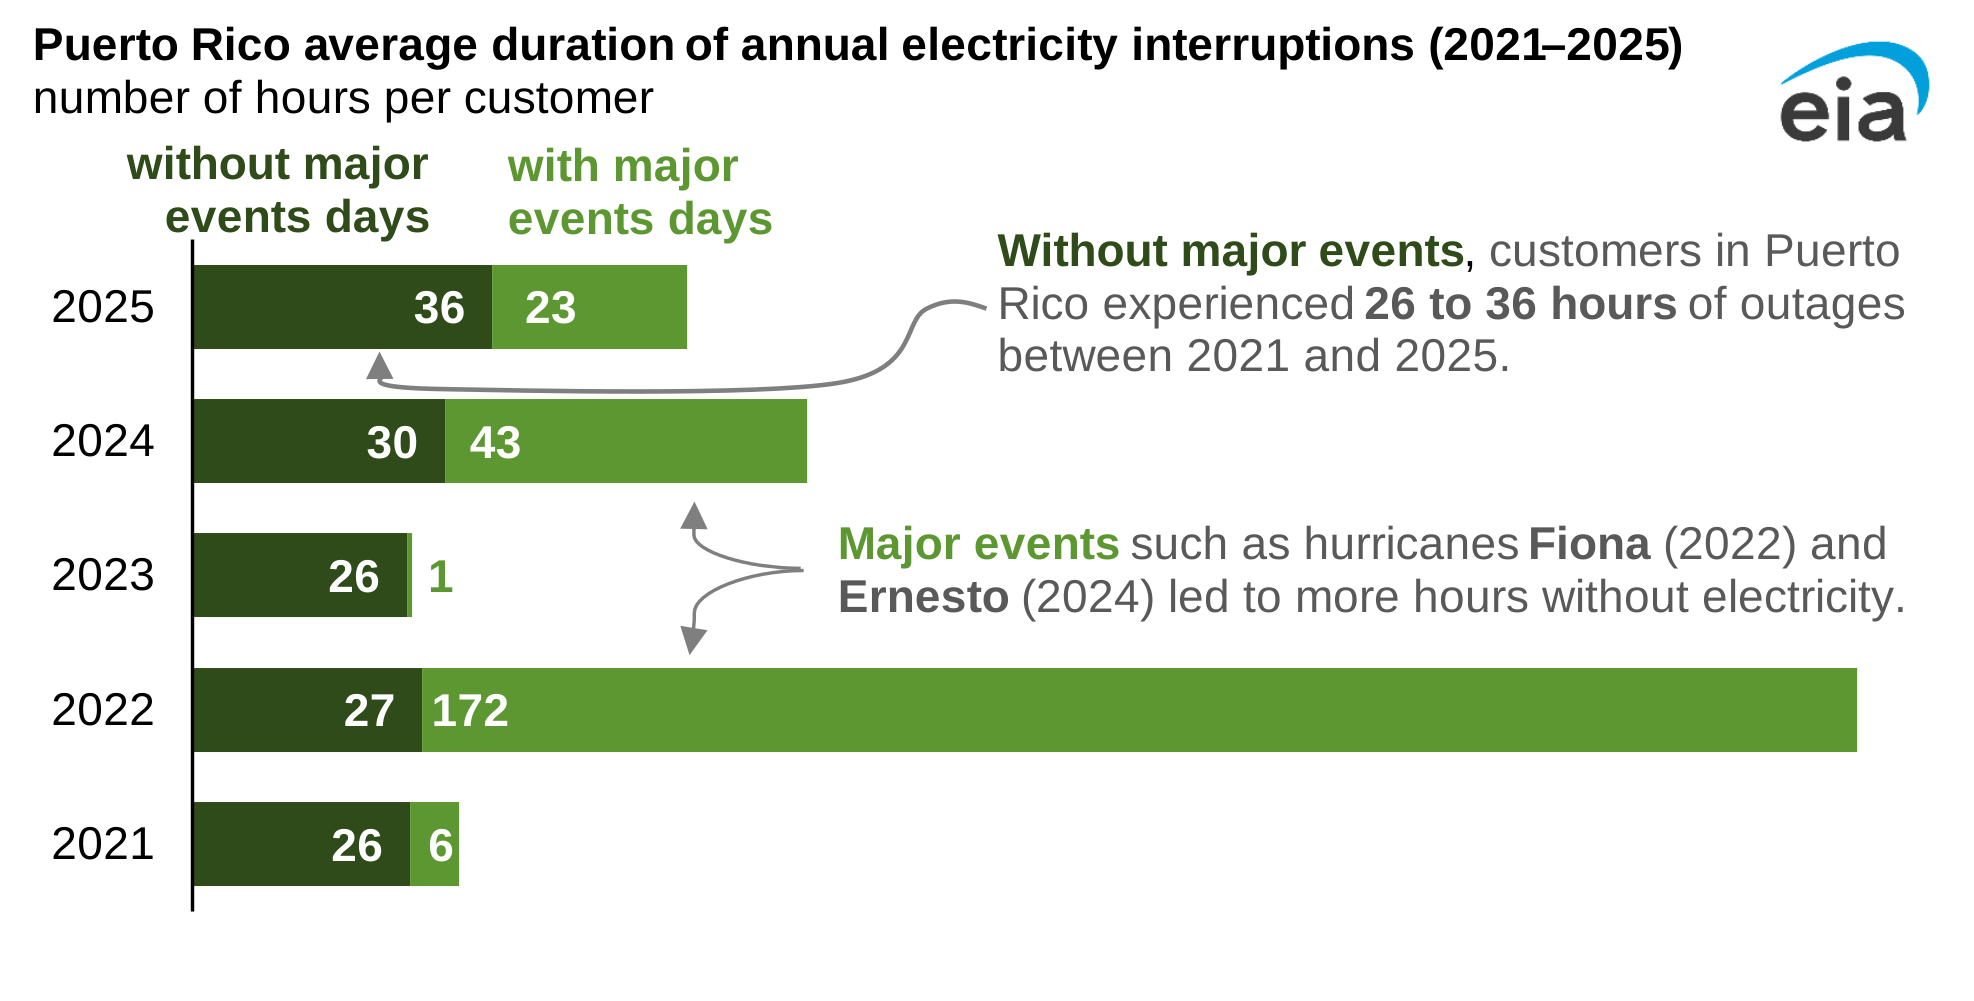
Note: The System Average Interruption Duration Index (SAIDI) shown here measures the total duration (in hours) of non-momentary power interruptions an average customer experiences in a one-year period. This metric distinguishes Major Event Days (MED), which is defined by the IEEE Standard 1366 as a day whenever the daily system exceeds a predefined threshold measured in minutes per day and based on data from the previous five years.
In 2025, customers in Puerto Rico experienced an average of 36 hours of power interruptions that were not caused by major events such as hurricanes, 19% more than in 2024. On average, between 2021 and 2025, Puerto Rican customers experience 29 hours of power loss each year. By comparison, electricity customers in the mainland United States generally experience about two hours of electricity interruptions per year without major events.
In-brief analysis
Aug 7, 2026
Battery storage capacity averaged 70% growth over the last three years
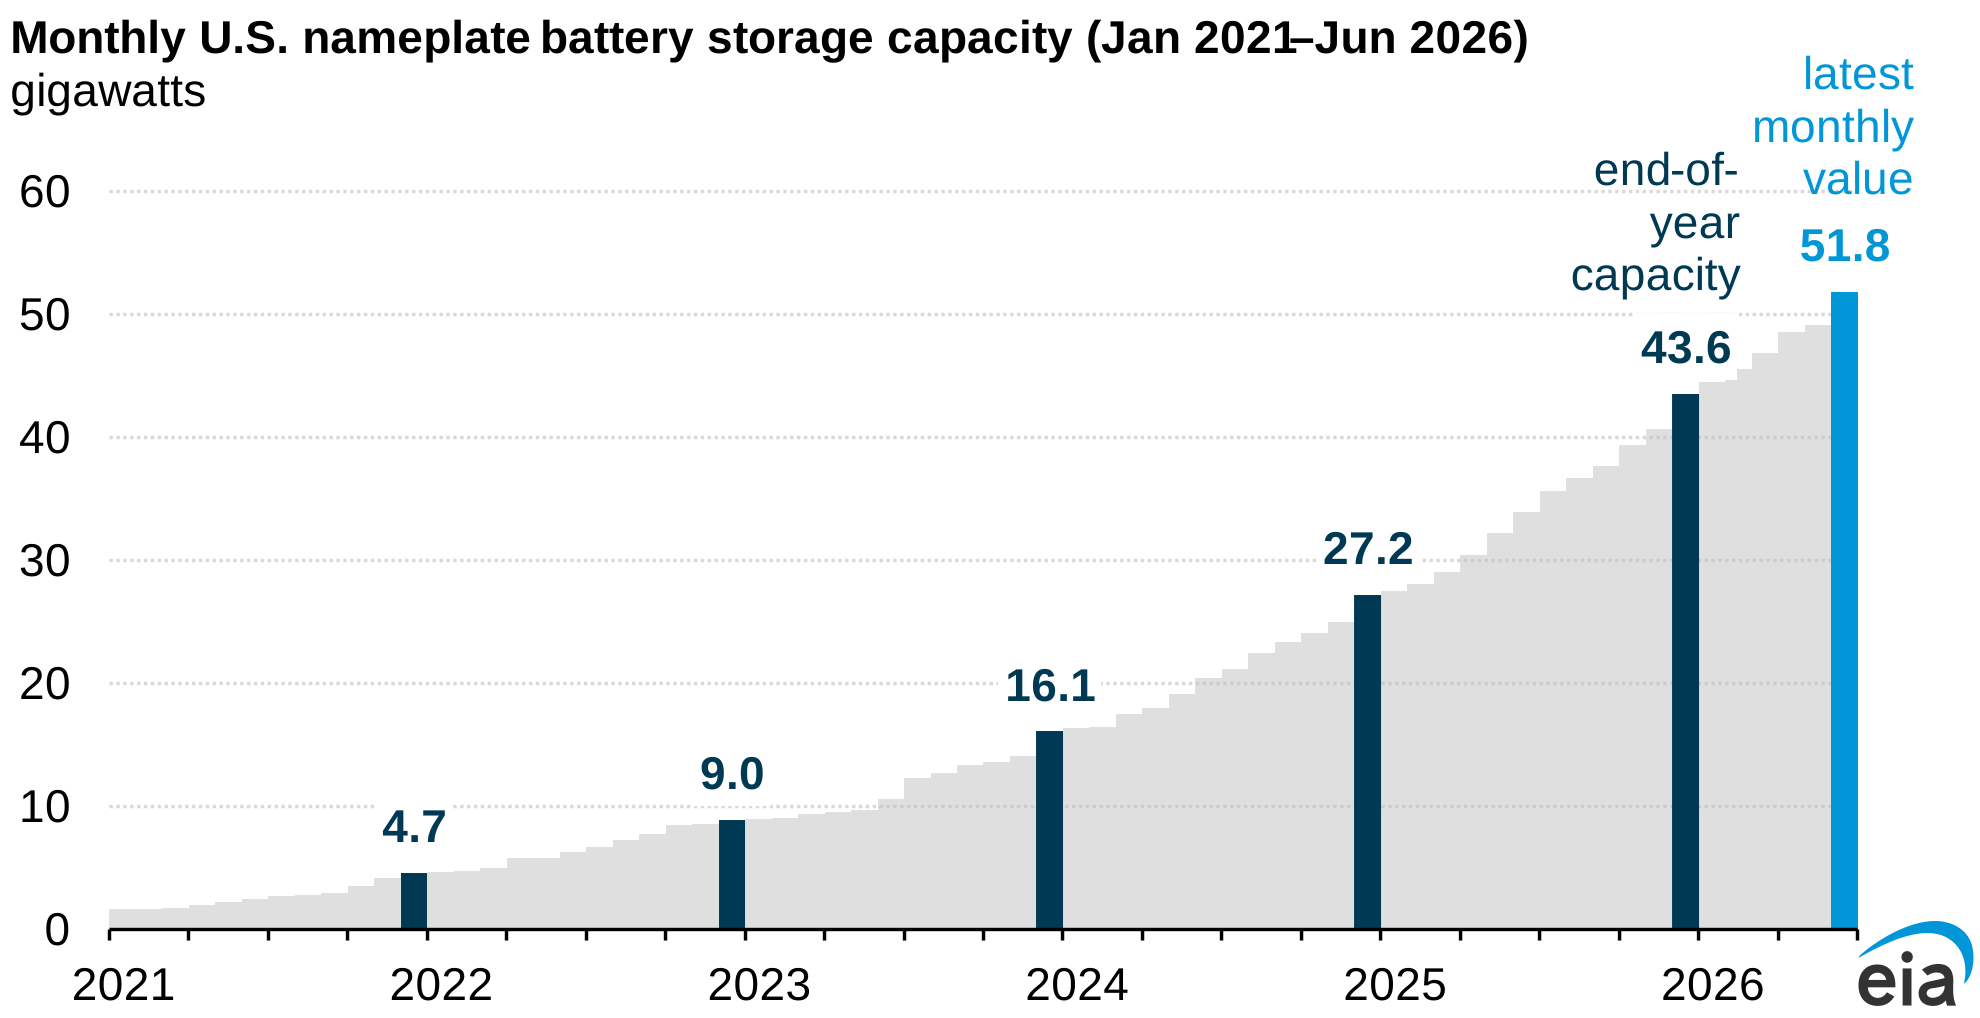
Utility-scale battery storage capacity in the United States increased significantly during the last three years, with an annual average growth rate of 70%. By the end of 2025, the U.S. power system had operational battery storage capacity of 43.6 gigawatts (GW). During the first six months of 2026, operators added another 8.3 GW of battery storage capacity, reaching nearly 52 GW of nameplate battery storage capacity, based on our latest Preliminary Monthly Electric Generator Inventory.
In-brief analysis
Aug 5, 2026
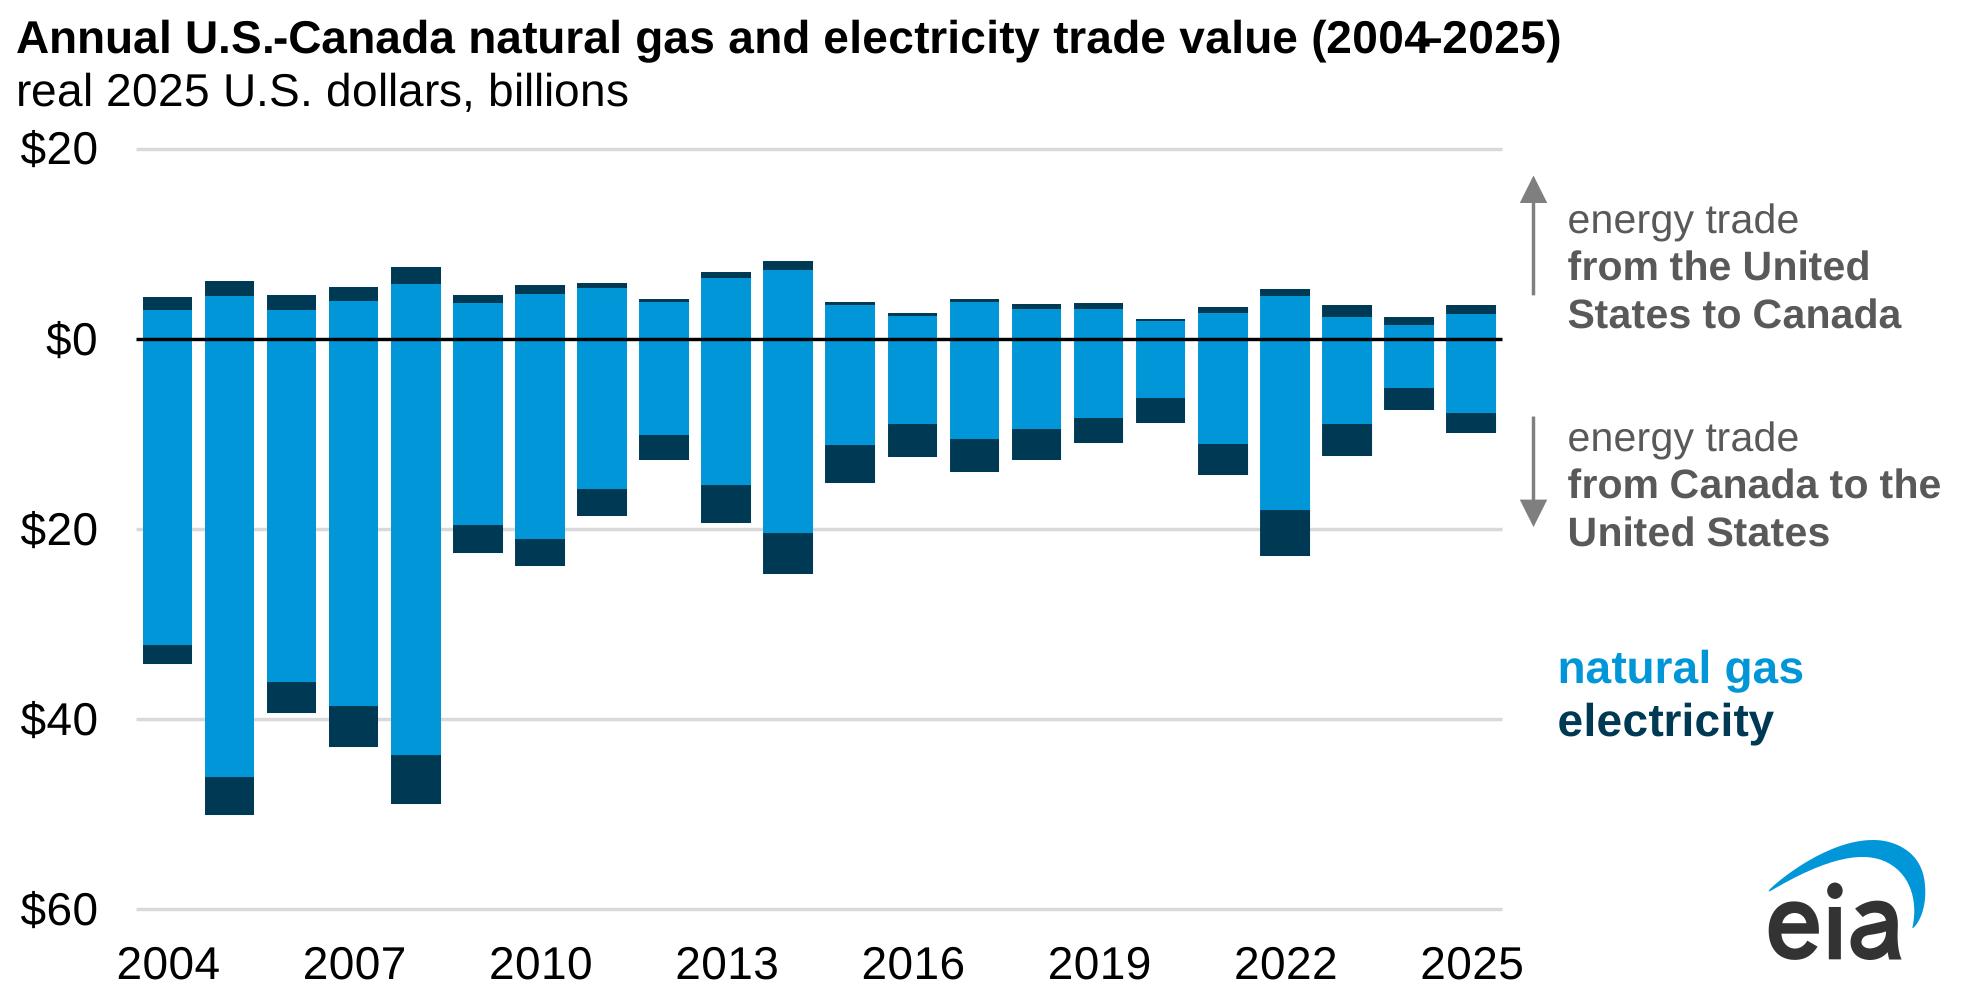
The U.S.-Canada natural gas and electricity trade value rose in 2025
Data source: Standard International Trade Classification data, U.S. Census Bureau
Note: Prices are adjusted for inflation.
Although the total value of energy trade between the United States and Canada fell by 11% in 2025 to an estimated $137 billion, according to data from the U.S. Census Bureau, the trade value of natural gas and electricity between the two countries increased slightly primarily because of increased natural gas prices and trade volume.
In-brief analysis
Aug 3, 2026
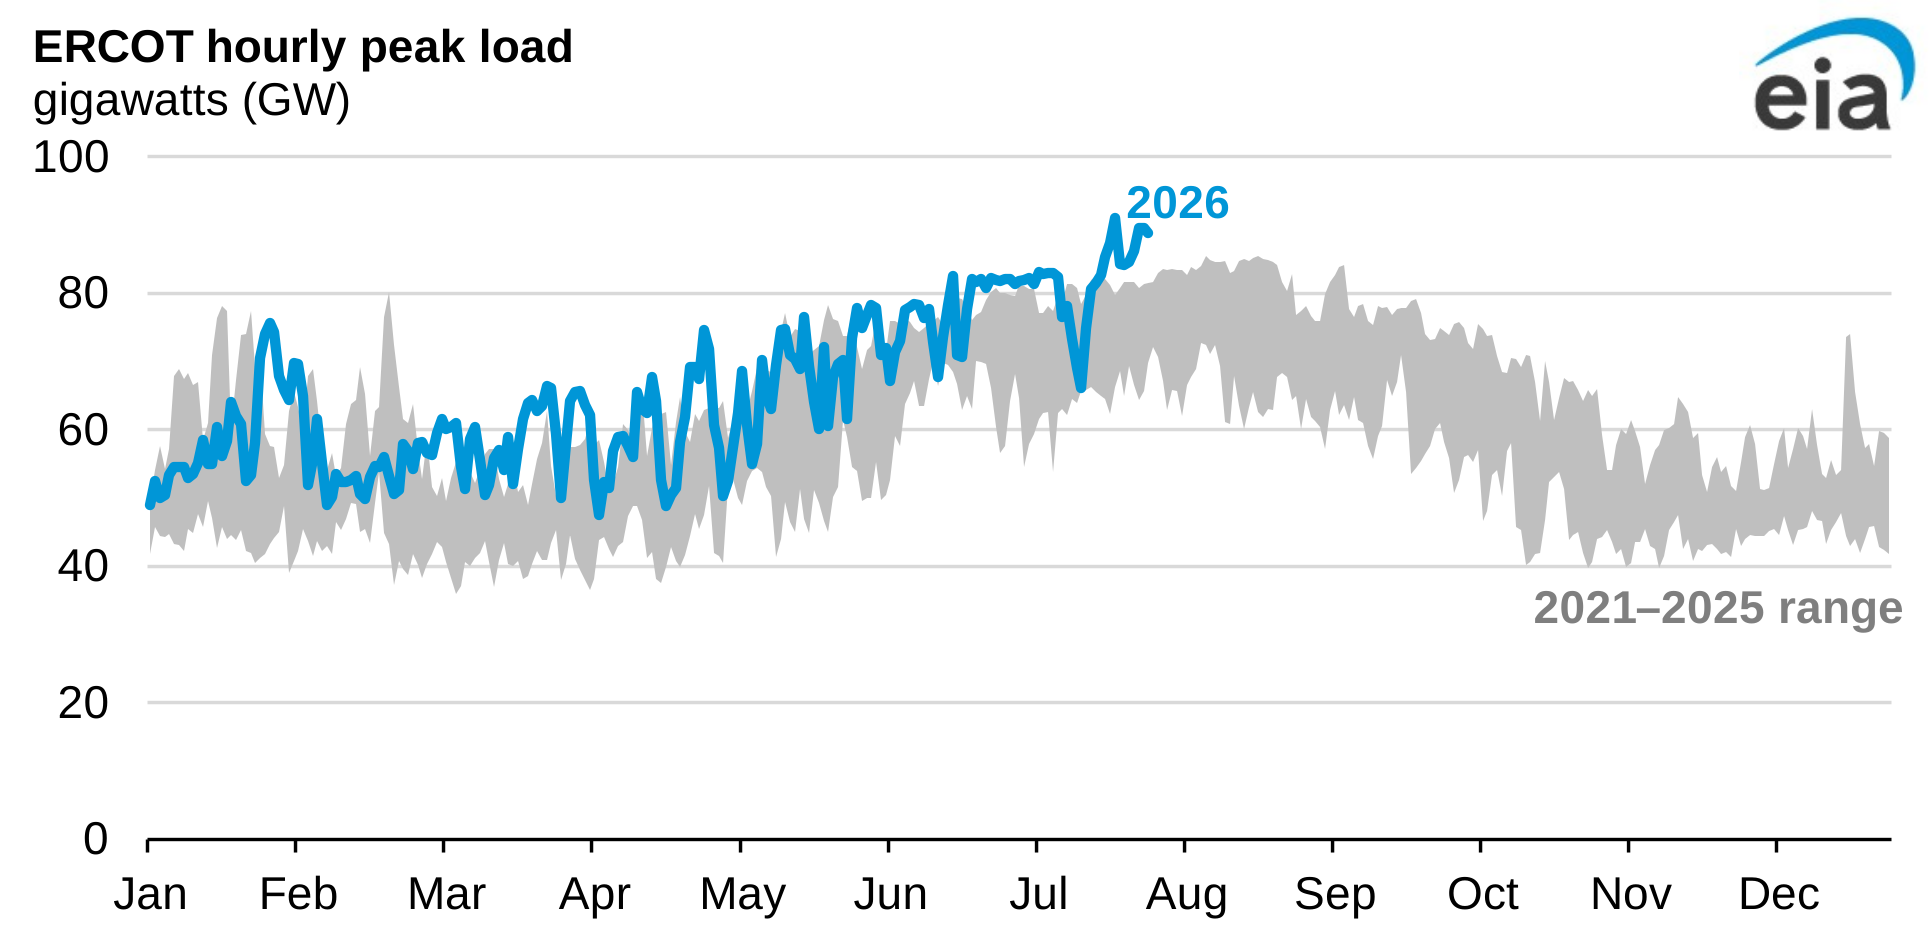
Hourly peak load in ERCOT set a new record, exceeding 91 GW on July 22
Data source: U.S. Energy Information Administration, EIA-930, Hourly Electric Grid Monitor
Note: ERCOT=Electric Reliability Council of Texas
Hourly peak load in the Electric Reliability Council of Texas (ERCOT), the regional transmission organization serving most of Texas, reached a record 91.1 gigawatts (GW) on July 22, 2026, according to data reported to us for our Hourly Electric Grid Monitor.
In-brief analysis
Jul 31, 2026
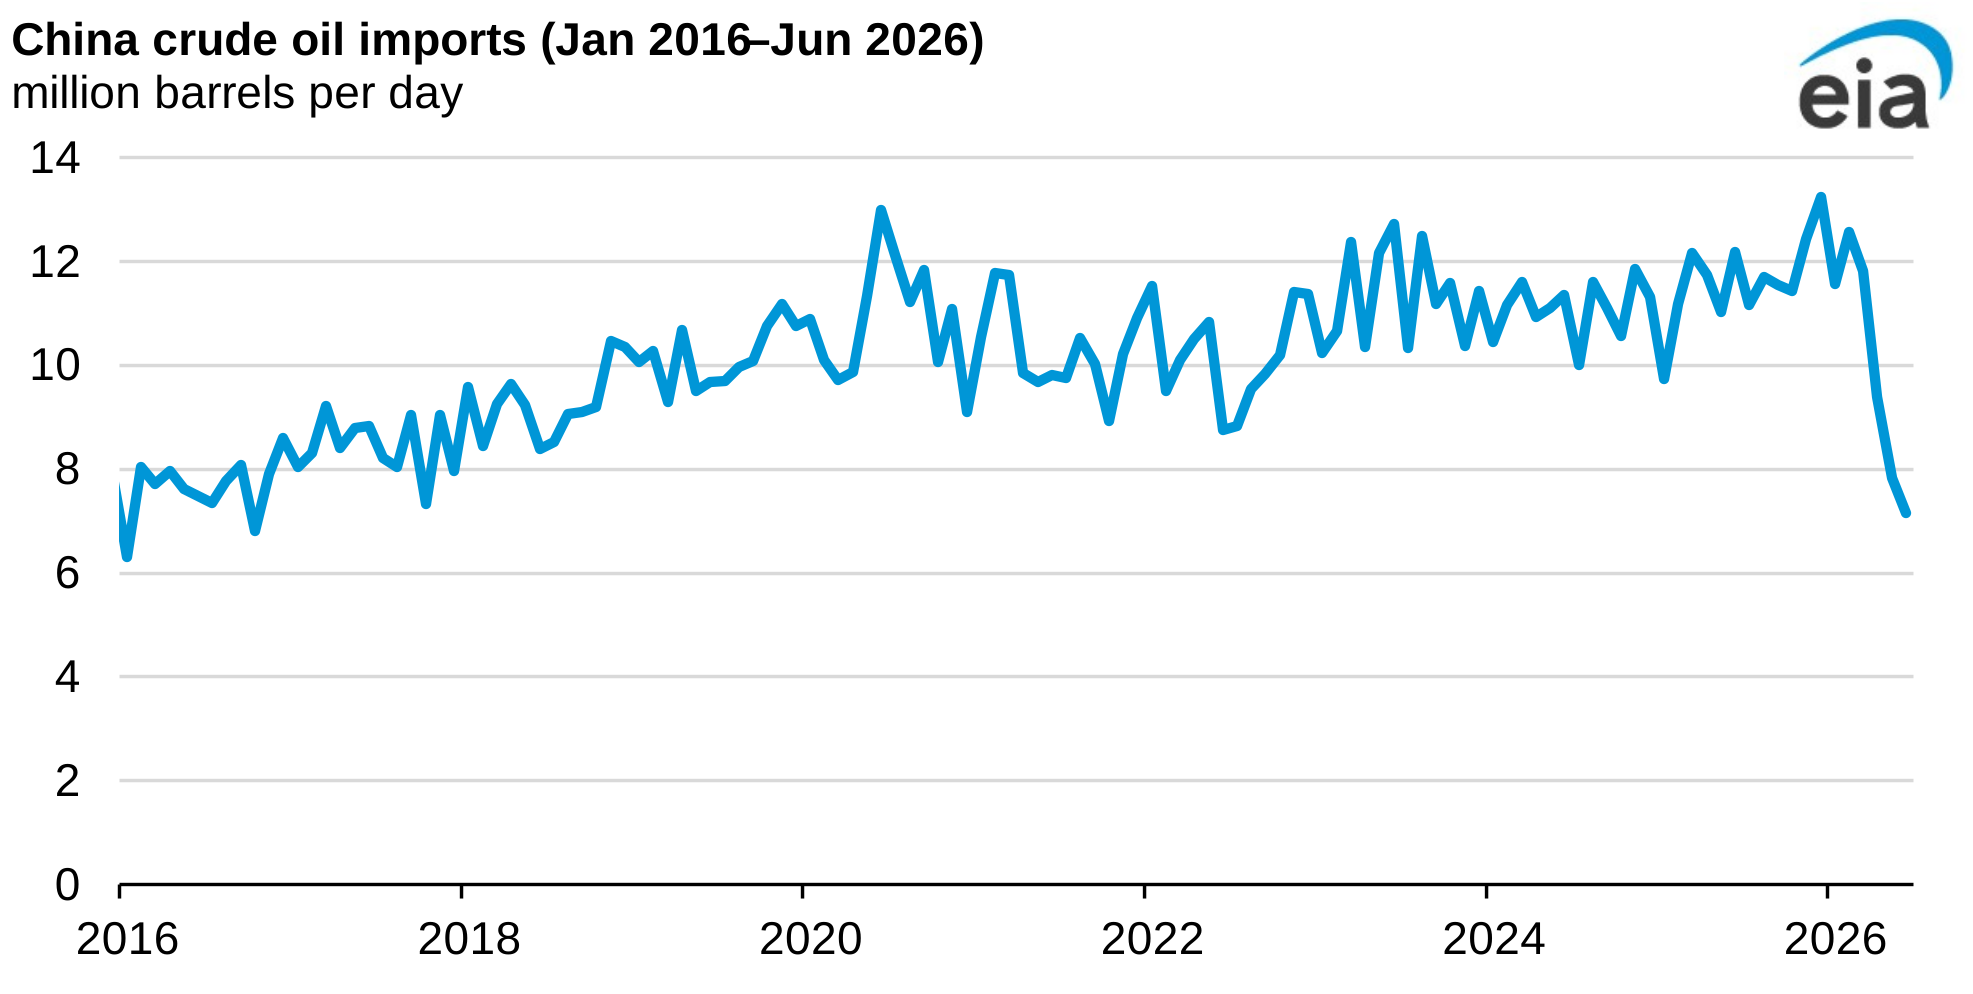
China’s crude oil imports fell in the second quarter
Data source: China General Administration of Customs, Bloomberg L.P.
China, the world’s largest importer of crude oil, imported less crude oil in the second quarter of 2026 (2Q26) following higher crude oil prices that resulted from disrupted flows through the Strait of Hormuz. China’s lower imports reduced global demand, softening the upward price effects from the disrupted supply through the strait.
In-brief analysis
Jul 29, 2026
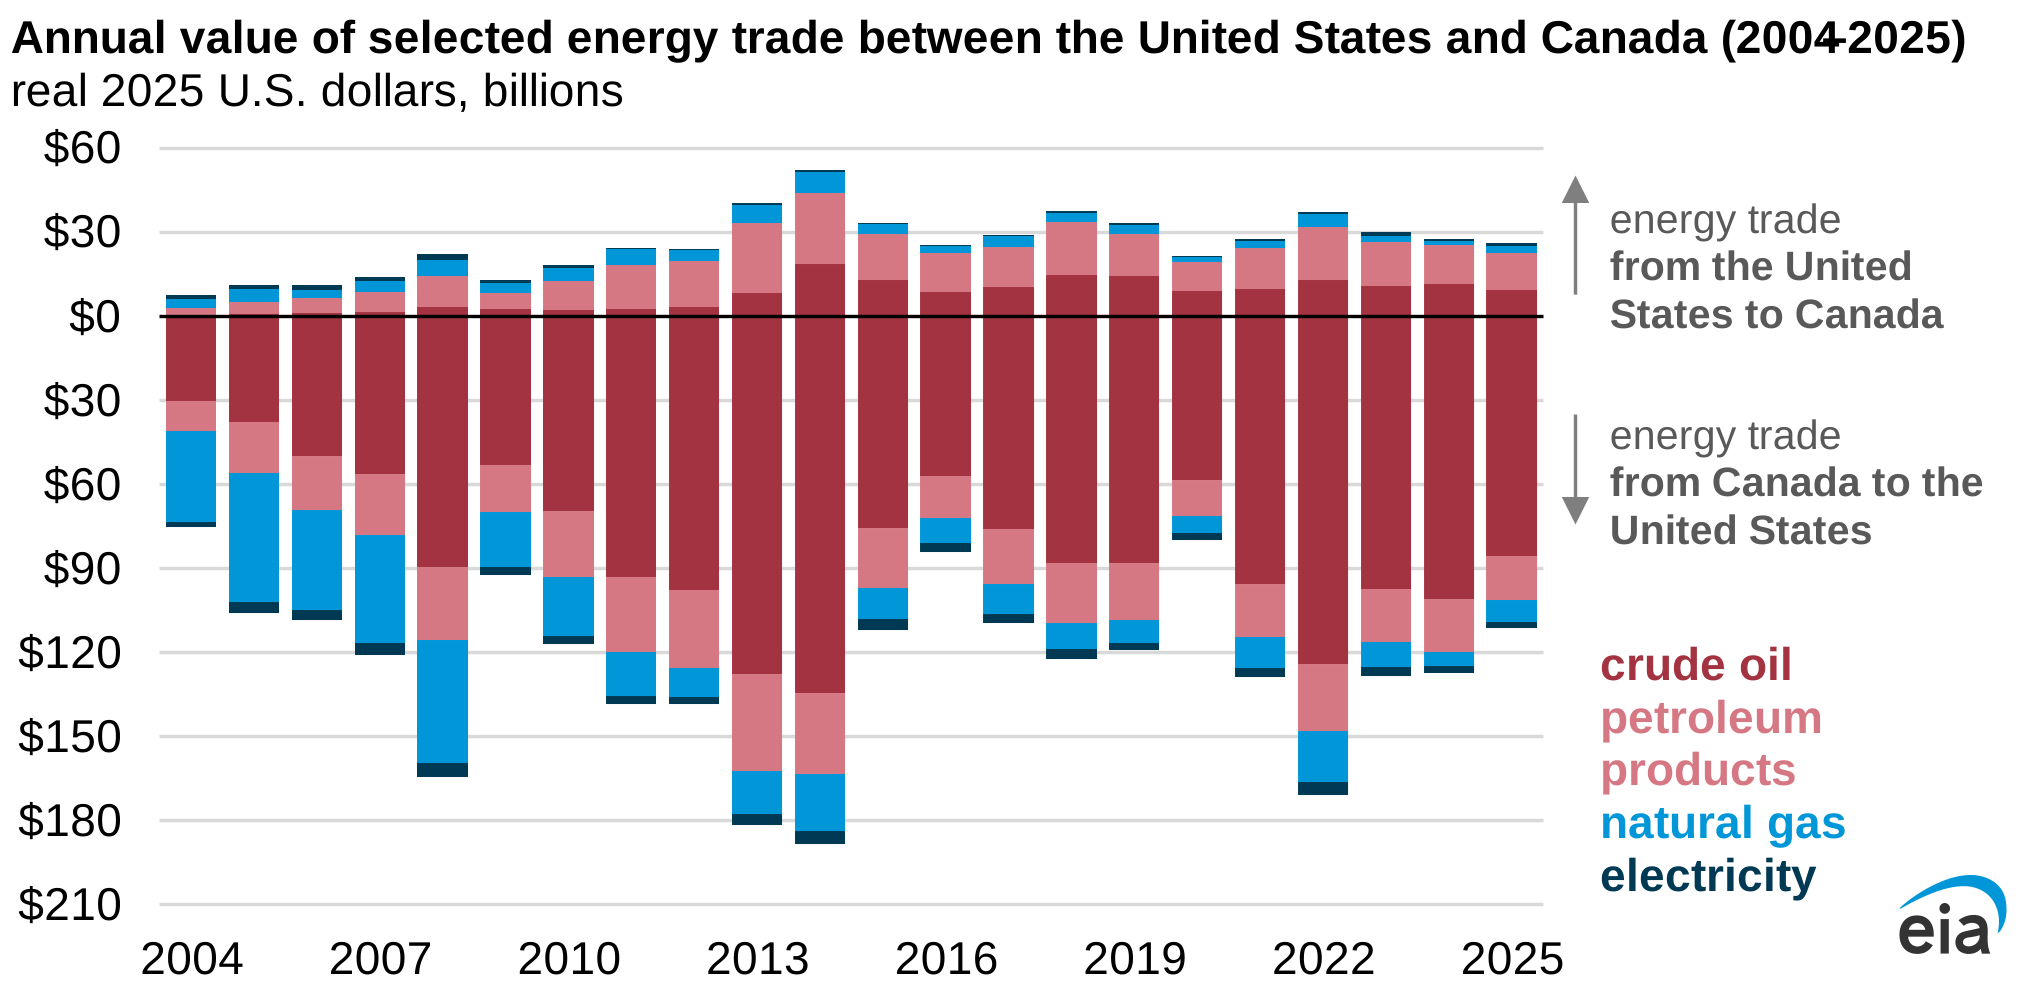
Lower crude oil prices reduced U.S.-Canada energy trade value in 2025
Data source: Standard International Trade Classification data published by the U.S. Census Bureau
Note: Prices are adjusted for inflation.
The value of energy trade between the United States and Canada fell by 11% in 2025 to an estimated $137 billion, according to data from the U.S. Census Bureau. Energy trade value is the total value of energy imports and exports between two countries and is driven by commodity volumes and prices. Most of the U.S.-Canada trade value is U.S. energy imports from Canada—$111 billion in 2025—rather than from U.S. energy exports to Canada, which totaled $26 billion last year. Crude oil accounts for the largest component of U.S.-Canada energy trade, making up 69% of the total value traded in 2025.
In-brief analysis
Jul 27, 2026
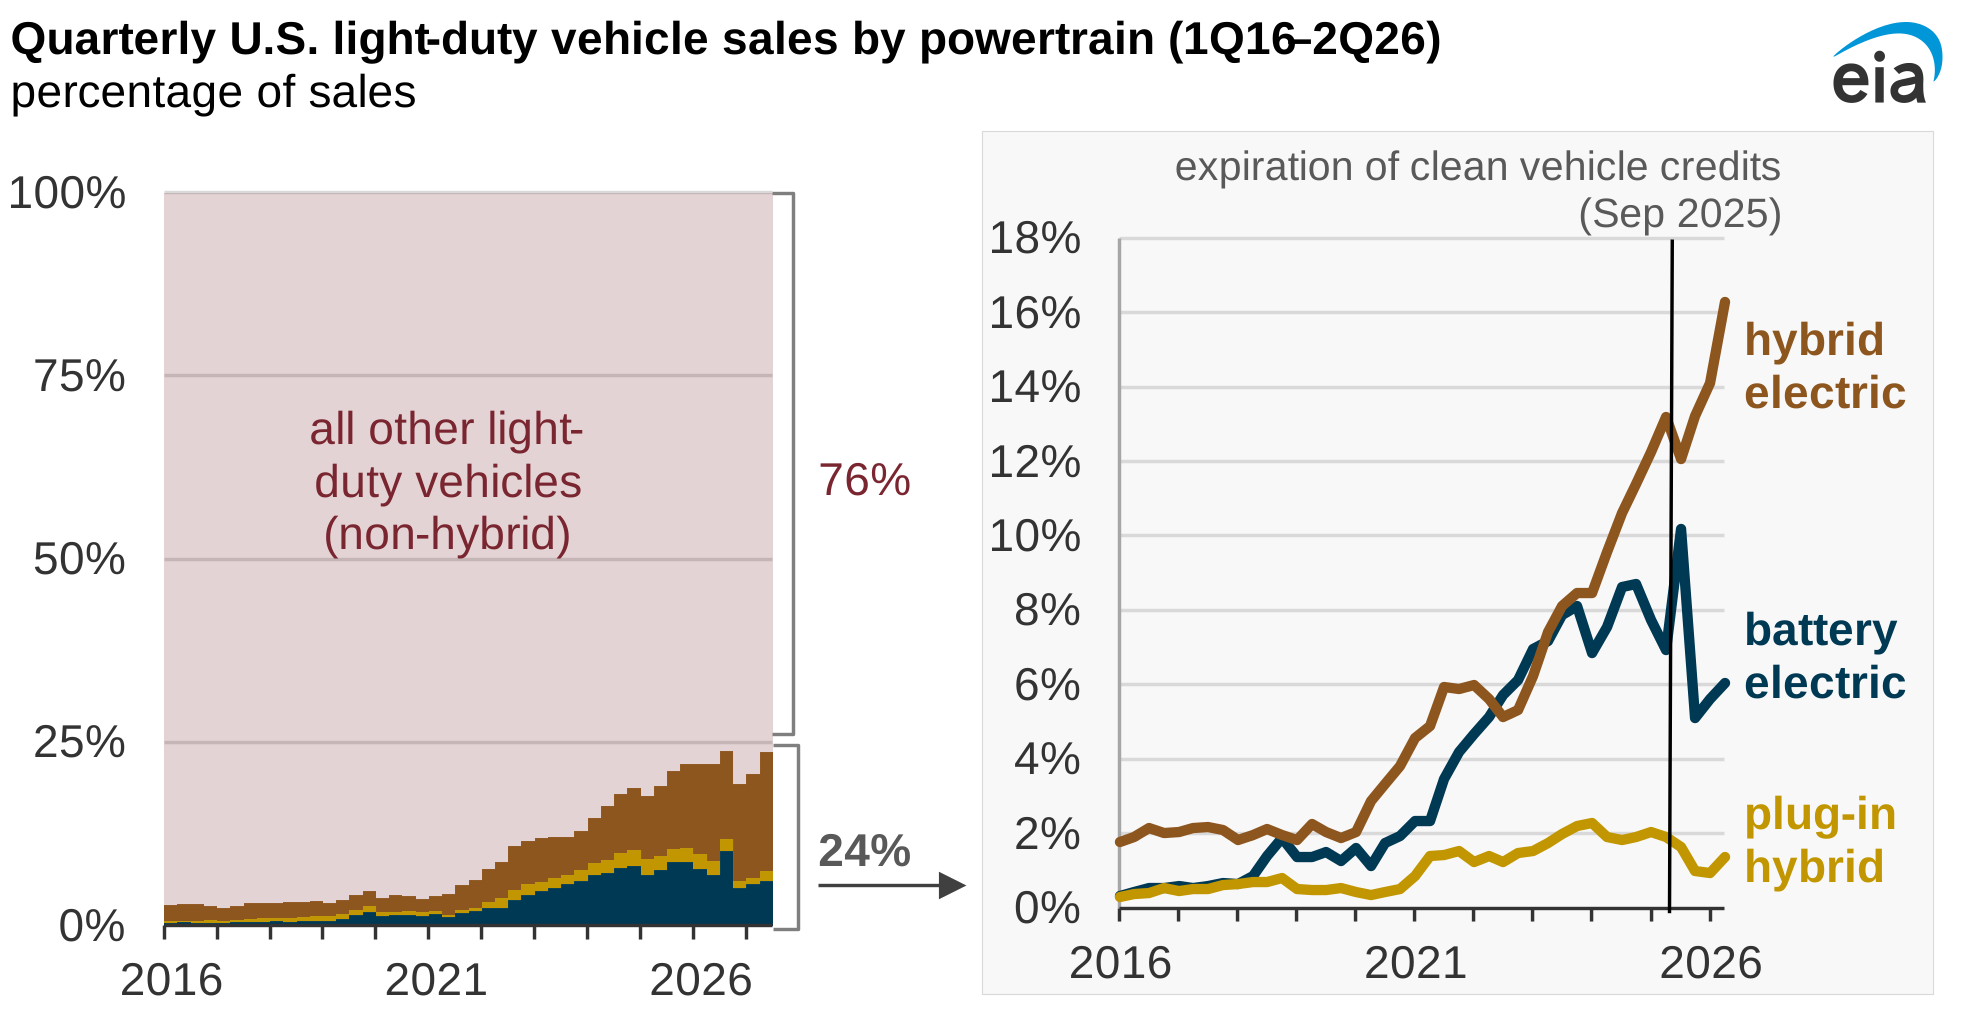
Hybrid sales rise while battery electric sales remain lower after tax credit expiration
Data source: Omdia
Note: 1Q16=first quarter 2016; 2Q26=second quarter 2026
In the second quarter of 2026 (2Q26), 24% of new light-duty vehicles sold in the United States were hybrid electric, battery electric, or plug-in hybrid electric vehicles, up from 22% in 2Q25. Between 2Q25 and 2Q26, hybrid electric vehicles continued to gain market share, reaching a record 16% of light-duty vehicle sales. The market shares of battery electric and plug-in hybrid electric vehicles decreased, according to estimates from Omdia. In 2Q26, battery electric vehicle sales were 6% of new light-duty vehicles sold, down from 7% in 2Q25; plug-in hybrid electric vehicle sales fell from 1.9% to 1.4% over the same period.
In-brief analysis
Jul 24, 2026
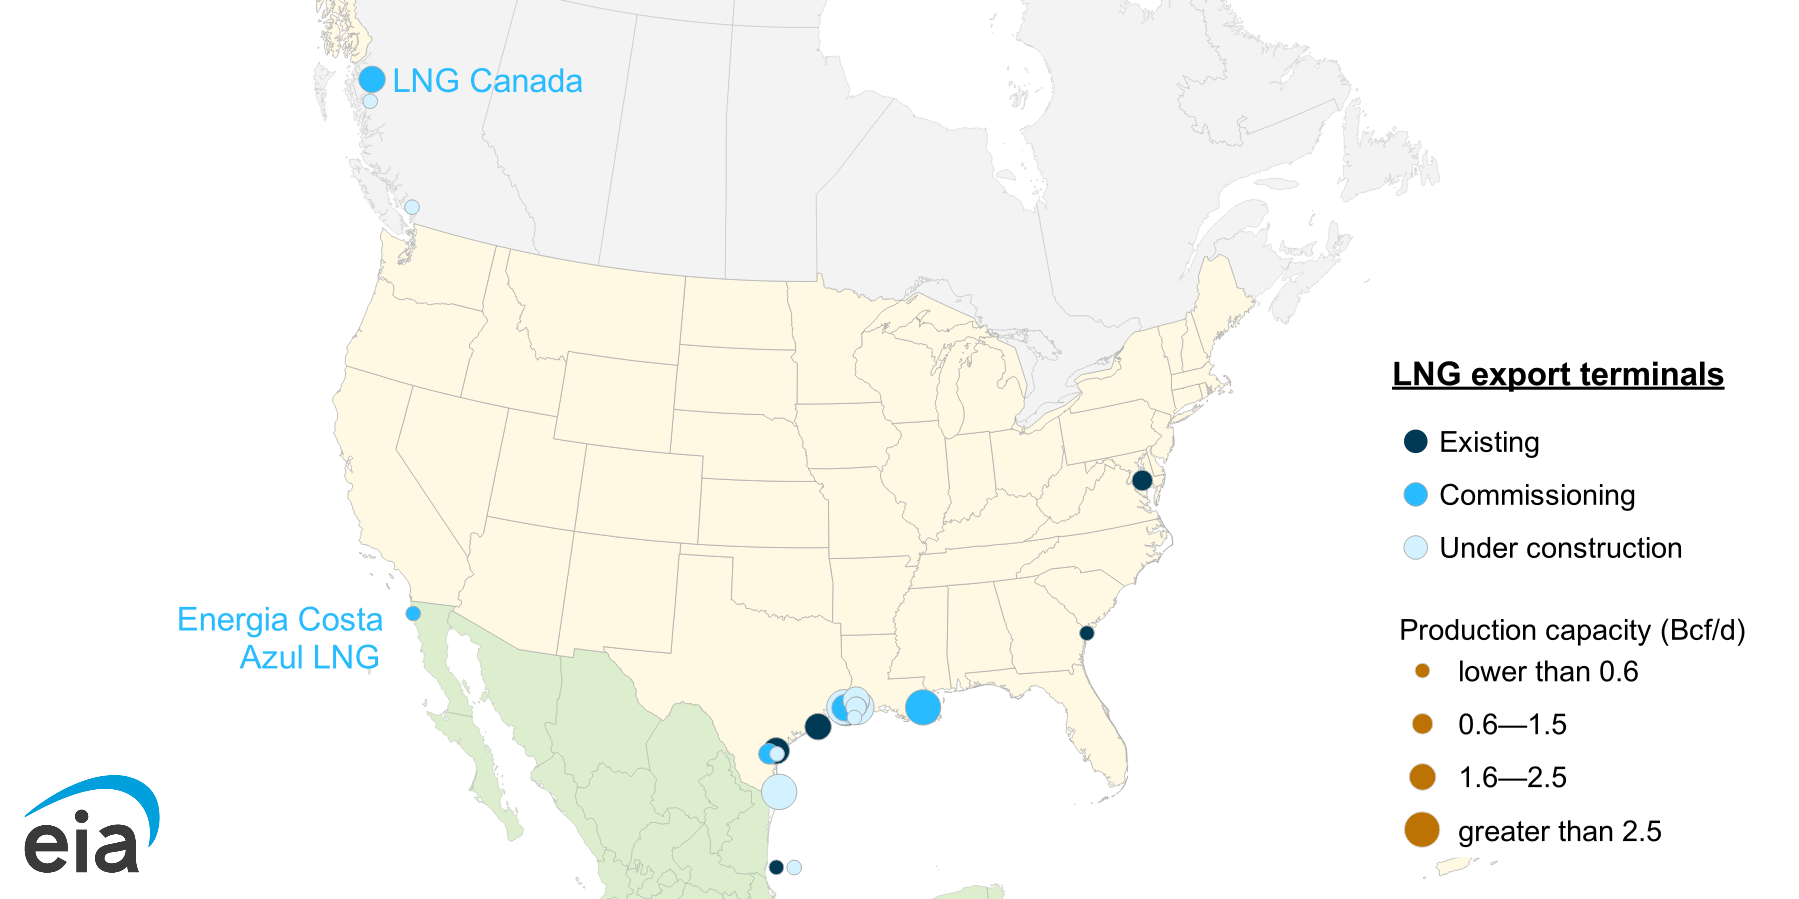
Energia Costa Azul, Mexico’s second LNG terminal, shipped first cargo
North America liquefied natural gas export facilities (2016–2031)
Data source: U.S. Energy Information Administration, Liquefaction Capacity File, and trade press
Note: Bcf/d=billion cubic feet per day; LNG=liquefied natural gas; FLNG=floating liquefied natural gas. Sites that are listed as commissioning have introduced feedgas, system testing, and first LNG production and exports but have not started meeting long-term shipping obligations.
Energia Costa Azul, the second liquefied natural gas (LNG) export facility in Mexico, shipped its initial cargo from Phase 1 of the terminal on July 8, according to the project developer. The completion of the project adds 0.4 billion cubic feet per day (Bcf/d) of nominal export capacity from a single train, tripling Mexico’s LNG export capacity. The facility is the first terminal in Mexico and the second in North America, following LNG Canada, to be located on the Pacific Coast, boosting North American export capacity there to 2.2 Bcf/d. The Pacific Coast location allows for shorter shipping routes to importers in Asia.
In-brief analysis
Jul 22, 2026
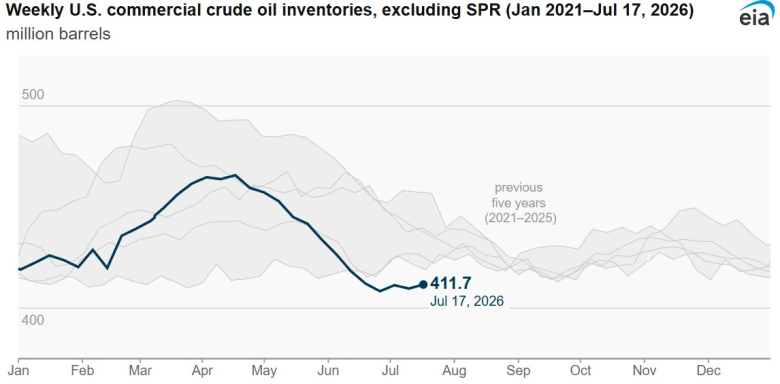
Commercial crude oil inventories increased by 2.0 million barrels
Data source: U.S. Energy Information Administration, Weekly Petroleum Status Report
Note: Commercial crude oil inventories do not include crude oil in the Strategic Petroleum Reserve (SPR).
For the week ending July 17, 2026, commercial crude oil inventories (excluding the Strategic Petroleum Reserve) increased 2.0 million barrels to 411.7 million barrels, 6% below the previous five-year (2021–2025) average. Gasoline inventories increased 0.8 million barrels, 7% below the five-year average. Distillate inventories increased 1.4 million barrels, 10% below the five-year average. Propane/propylene inventories increased 6.3 million barrels, 34% above the five-year average. Total commercial petroleum inventories increased by 11.6 million barrels for the week.