
Posted by Vihar Kurama|Published on Sep 19, 2022
9 min read

“”Featuring the Error pane with a never-before-seen breakdown of what it is and how it can help you debug your apps lighting fast
That’s a tongue twister, innit? Almost.
Here’s a meme that isn’t. It’s just the painful truth.

There is no perfect code, so you know debugging is inevitable, but it’s still a chore and is as crushing often times as the meme claims it is.
But, while debugging is inevitable, making it painful is optional, especially when you have the Appsmith Debugger. We have claimed we champion developer experience as many times as we could before without being brazen about it. We think. So, we thought some more and said, “Let’s prove the claim, too.”
“Wait, wait. What is the Appsmith Debugger?”
In 2021, we shipped the Appsmith Debugger, a set of Chrome DevelTools-like features that have helped you investigate and resolve errors in Appsmith.
We recorded a video for it in a series about the Debugger, talked about it in our docs, and referenced it enough times to make you groan about our obsession with errors. If this is the first you are hearing of it, get on our e-mail list so we can tell you some more about it.
Why we did this
Browser dev tools are as helpful as a magnet when looking for iron fillings in a pristine haystack. To the untrained eye, they can be downright criminal, too.
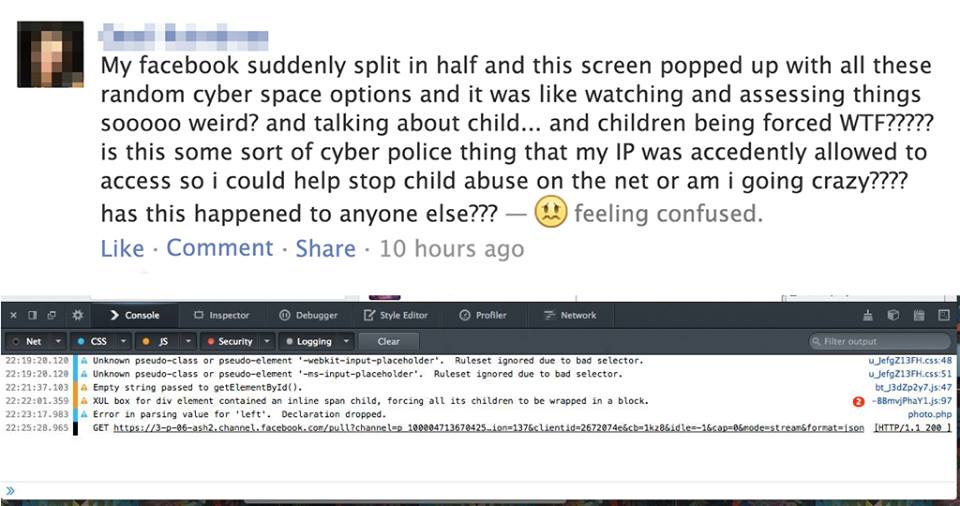
Sure, sure, they nest groups of errors and there are separate tabs for the Console and the Debugger, but meh! There’s a sea of error messages, system logs, console logs, and then there’s you swimming in it.
Before we shipped the debugger, you saw,
errors inside a widget's Property pane that floated on your canvas which probably already had several widgets
the Editor’s Response pane, which clubbed legit responses with errors
The Debugger solved several of those problems.
What’s the Debugger have
Available on app.appsmith.com and our self-hosted release images, it can be called by toggling the debug icon—the one that looks like a bug—on the bottom-right corner of your Appsmith screen or with CTRL/CMD +D.
Inside the Debugger, live three panes, Errors, Logs, and Inspect Entity, each with their own uses. In the first part of this two part post, we will break the Error pane down for you and see how it can save you hours over browser dev tools in debugging.
“”If you would much rather just learn about Logs and Inspect Entity, bookmark this post. We will link to Part 2 in five days. :-)
Errors
Borrowing from a browser’s dev tools sub-window but improving on it radically, the Error pane lists all errors that we see when you are building inside Appsmith. Familiar examples include syntax errors from JavaScript bindings, reference errors from queries, and datatype mismatch errors.
Errors in the pane are specific to an Appsmith entity. Translated from Appsmithlish, it means you see helpful error messages about a faulting widget, a rogue query, or a stubborn JS Object.
These errors get logged to the pane in lockstep with the sequence of code execution in Appsmith.
The Error pane is the default view when working with widgets—most noticeable if you have the Debugger sub-window resized as in the pictures in purple—so you know what’s going wrong and where in real-time.
The Editor’s Error pane is smarter. It doesn’t automatically switch to the Error pane—Response is the default on this screen—when an error occurs. Instead, the
Debugicon lights up in red with a numeric notification that’s like a running ticker for the number of errors the Debugger sees with your queries or JS Objects. Click it to open the Error pane.Every error you see in the pane follows a template with a few helpful pieces of info to help you debug.
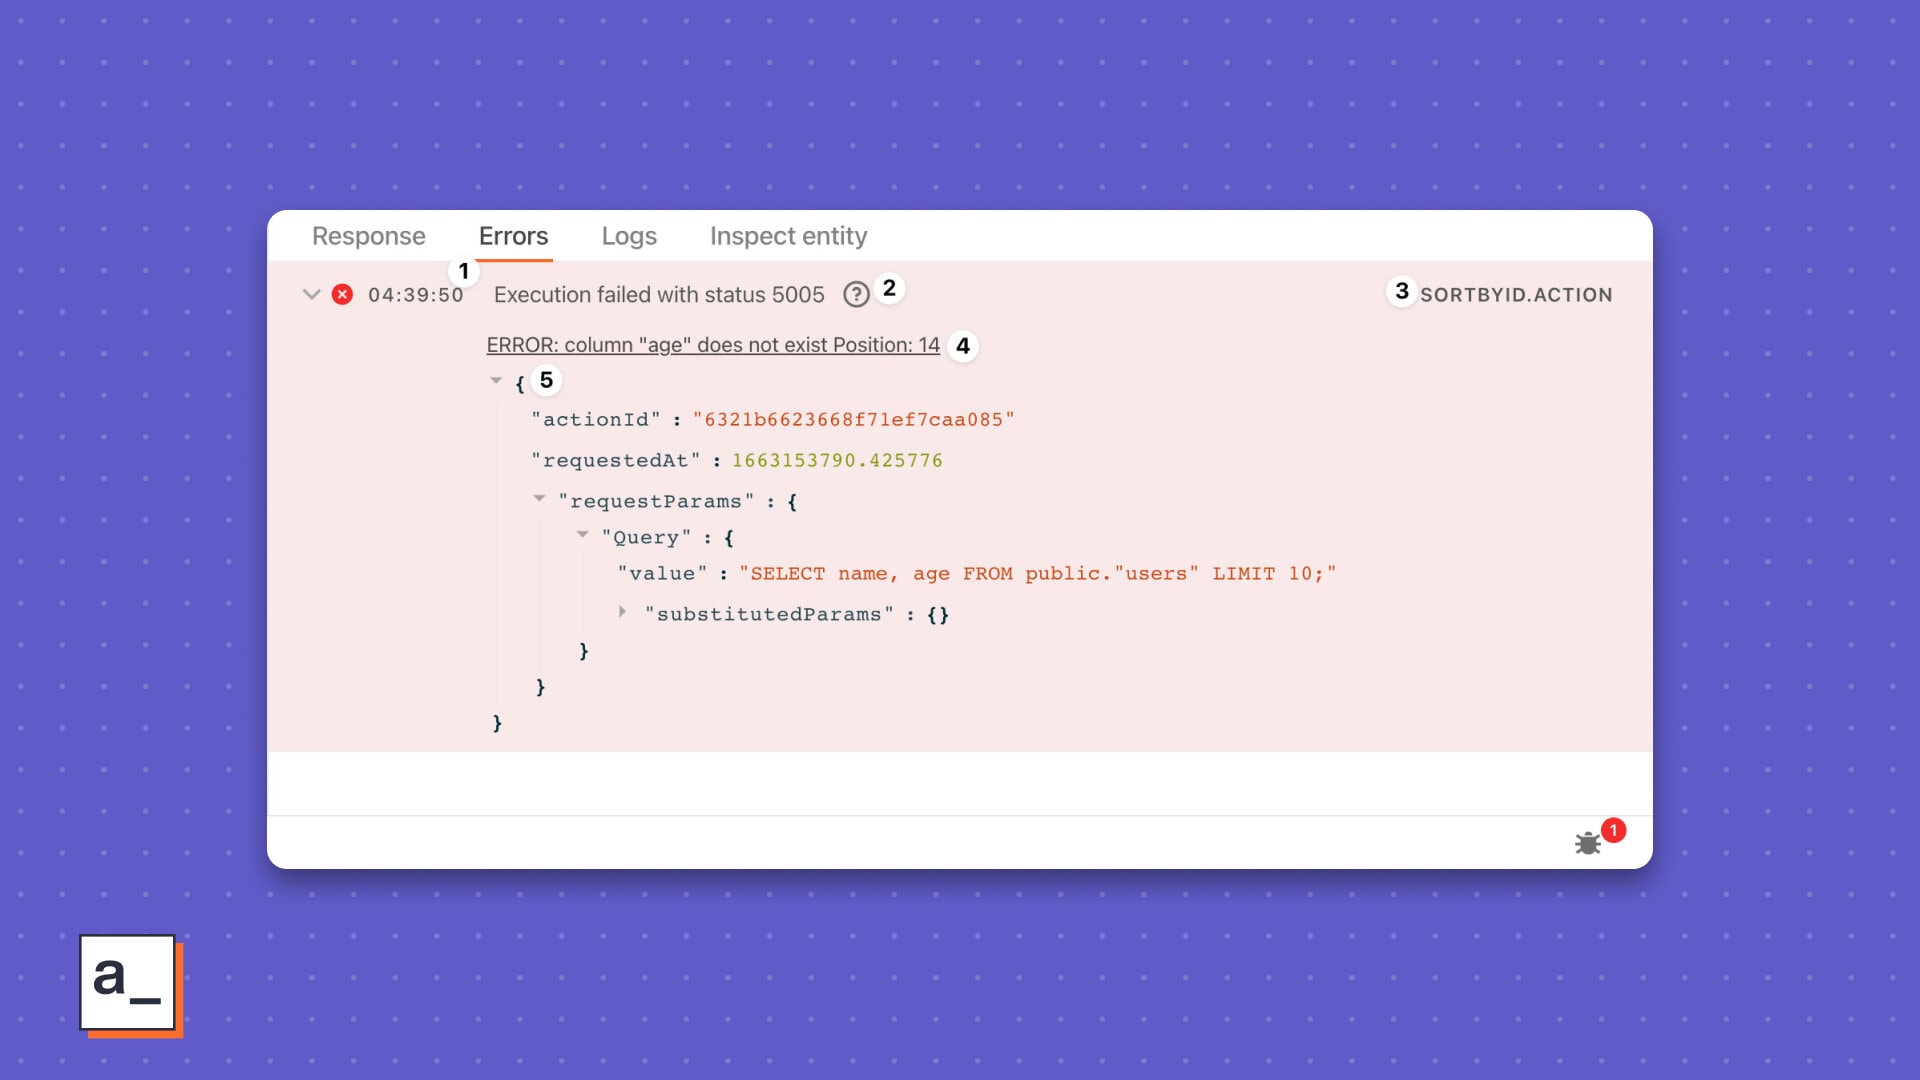
The timestamp
Logged as your code executes or a value evaluates with your widgets, these little breadcrumbs help you track back from when the error occurred to when last it was A-Okay.
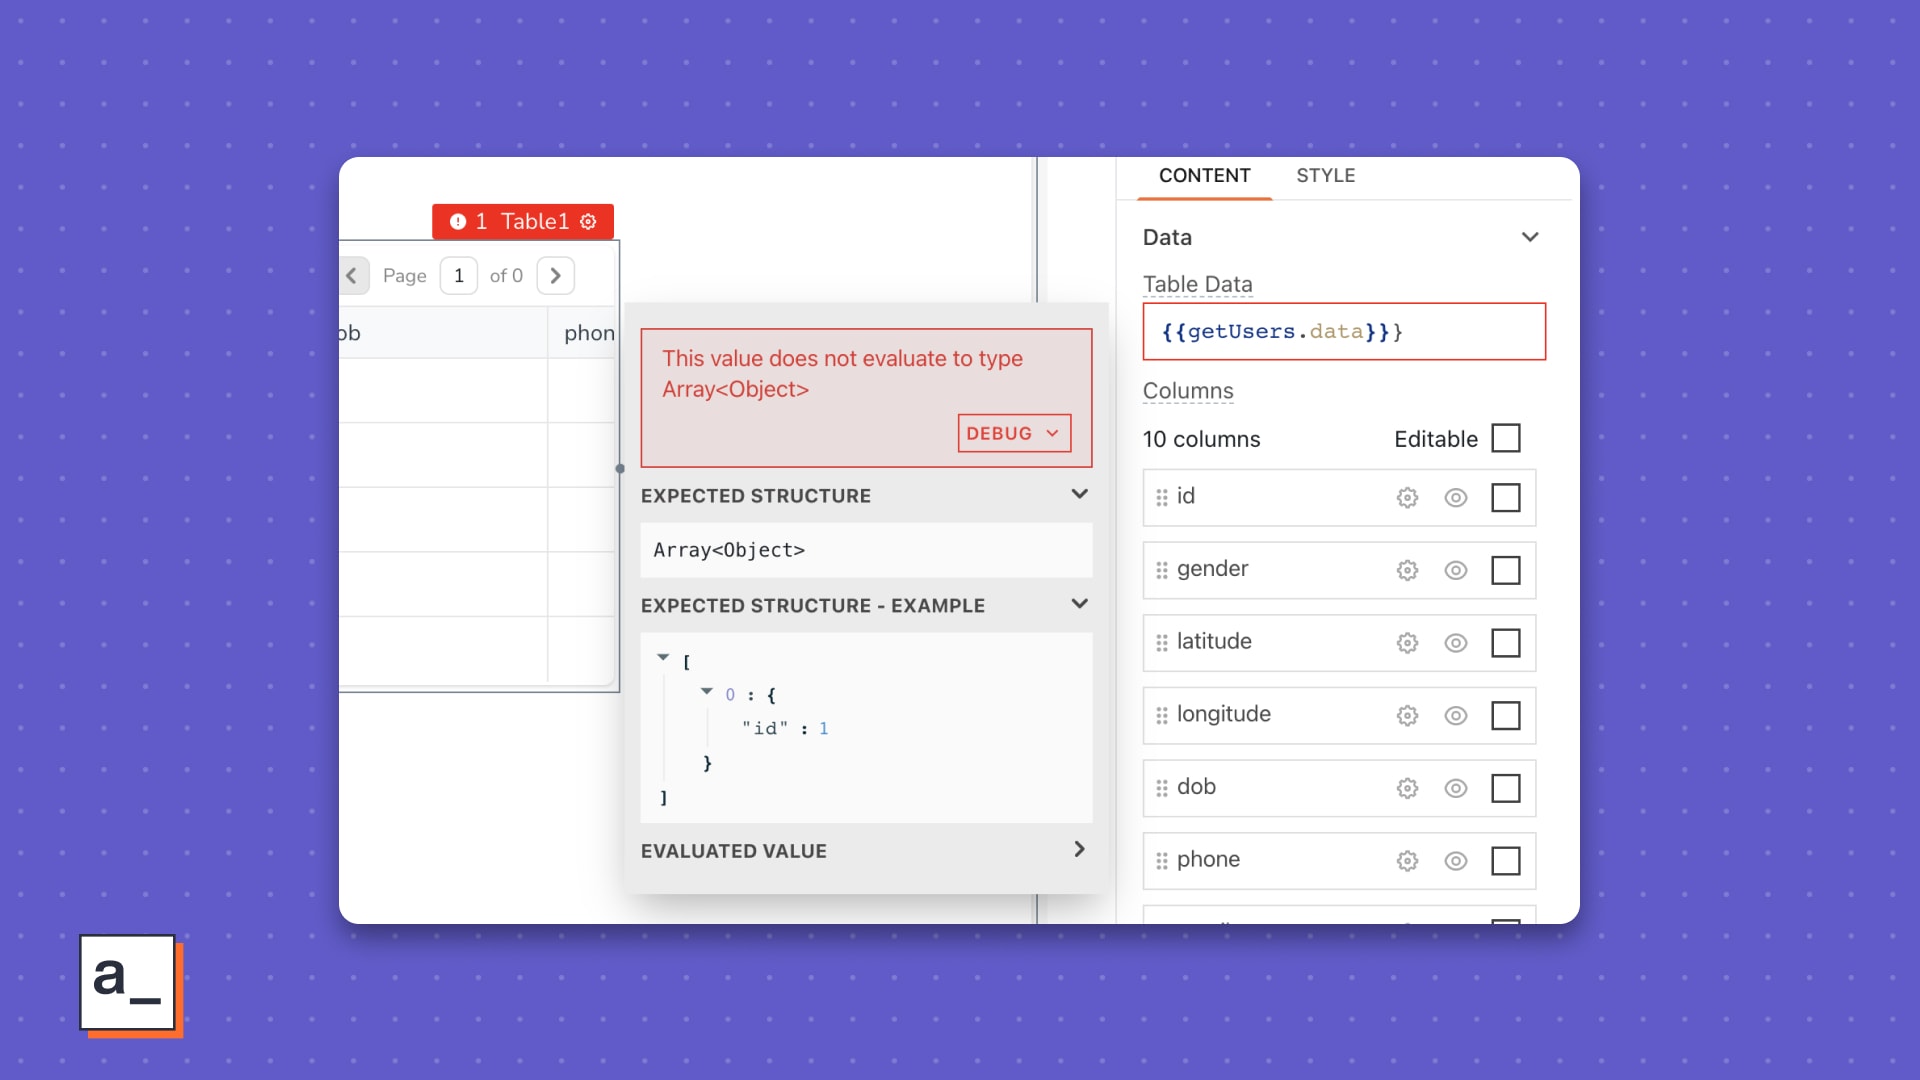
The issue Depending on the error type, you will see a couple different kinds of issues.
With widgets, you’ll see the faulting widget property’s name. An example of this is the commonplace
The value at tableData is invalid, occurring when the propertytableDataexpects anArray