Monitoring the progress of fermentation of beer in a simple fashion
(found problems with yeast krausen effecting the hydrometer displacement)
Intro
We wanted to design a simple system to measure the change of specific gravity during fermentation, thus enabling us to see the rate of fermentation.
We also want to measure the temperature of the beer, which we do through the use of ds18b20 1-wire temperature probes.
We do this by measuring the distance of displacement of a hydrometer. This distance can be converted into a measure of specific gravity, provided we first calibrate our system with a known liquid, such as water, which will have a specific gravity of 1.000.
Diagram
We make use of a time-of-flight sensor, from ST, which uses an IR laser to emit a pulse of light, which is reflected by objects and picked up by the sensor. The sensor measures the time from the pulse being emitted, to being reflected and detected, allowing it to deduce distance from this, to approximately 1mm accuracy, for the distances we are interested in.
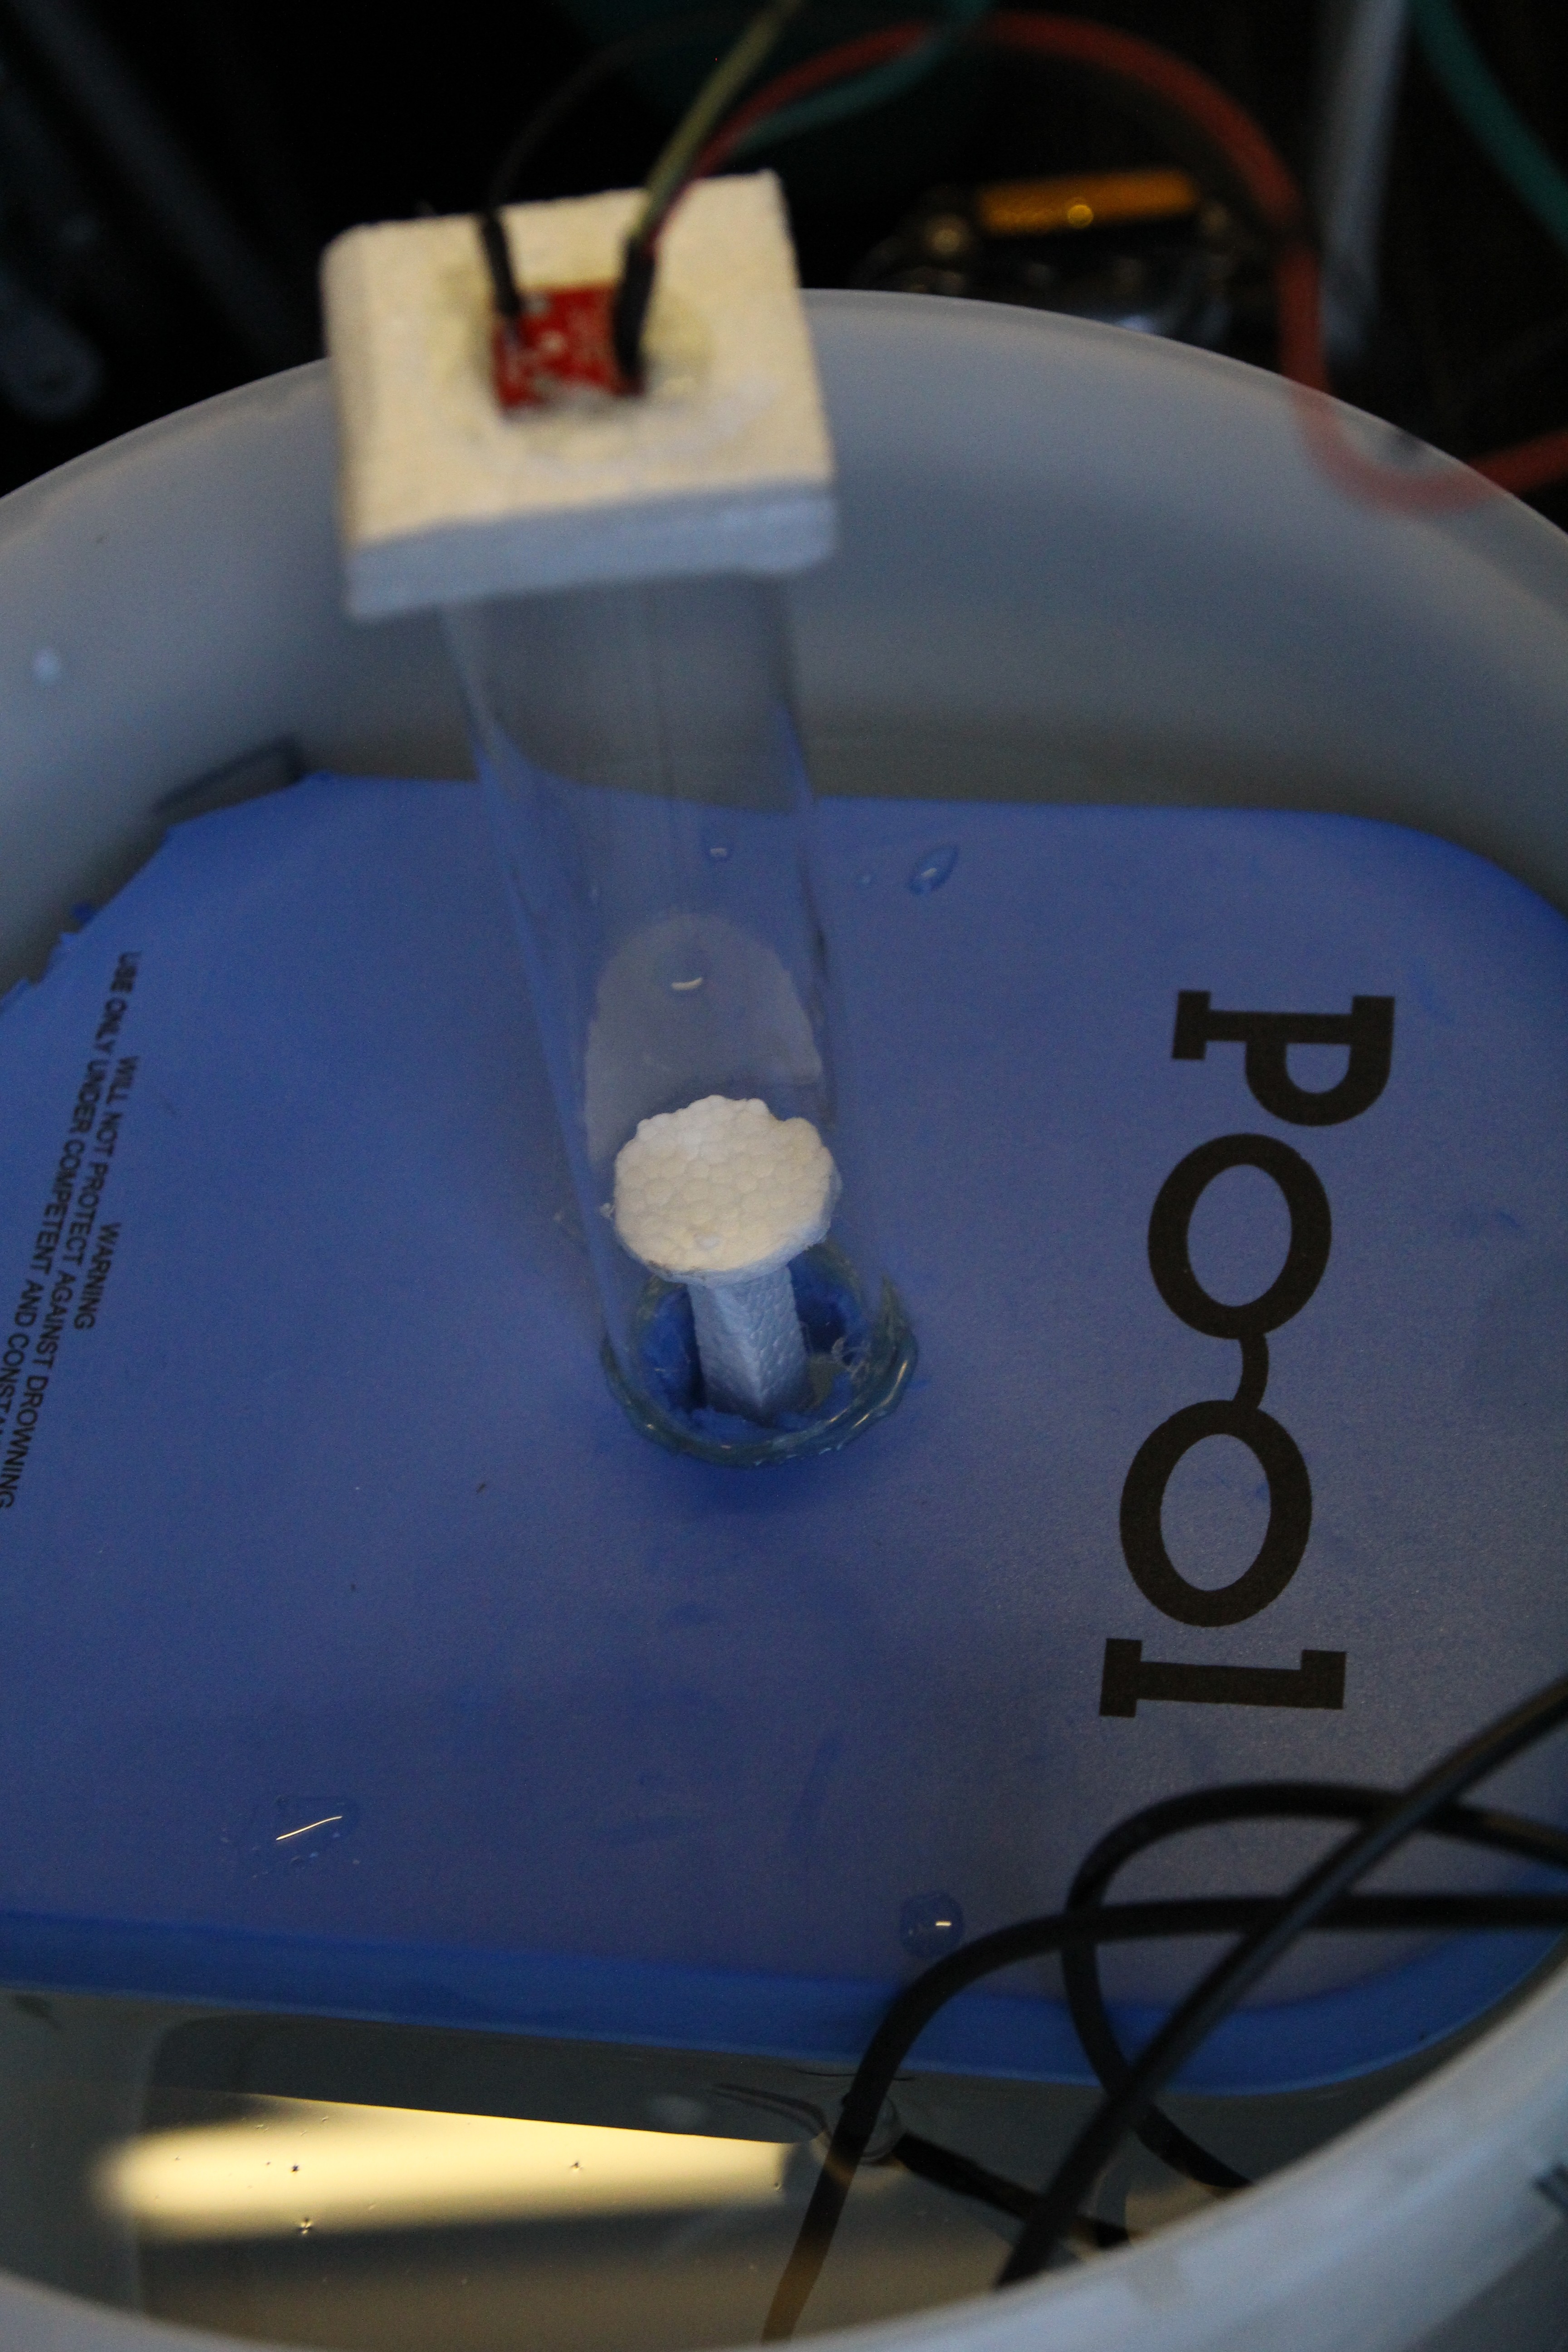
From the diagram you can see the hydrometer has attached to it, a small disc, which is used to catch and reflect the light emitted by the ToF sensor.
We make use of a swimming float, with the ToF sensor mounted on an acrylic pipe. This is because we need to measure the distance to the top of the hydrometer and need to work with arbitrary liquid levels.
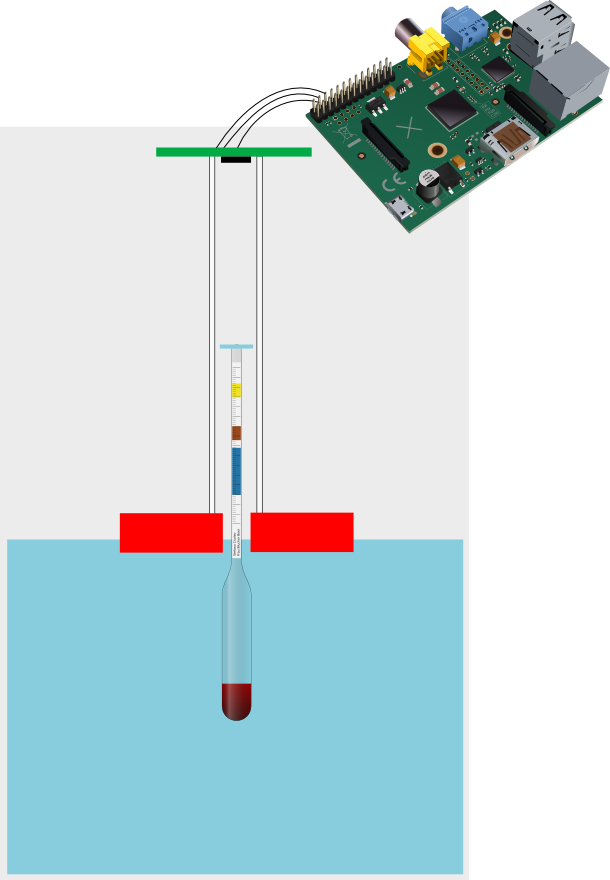
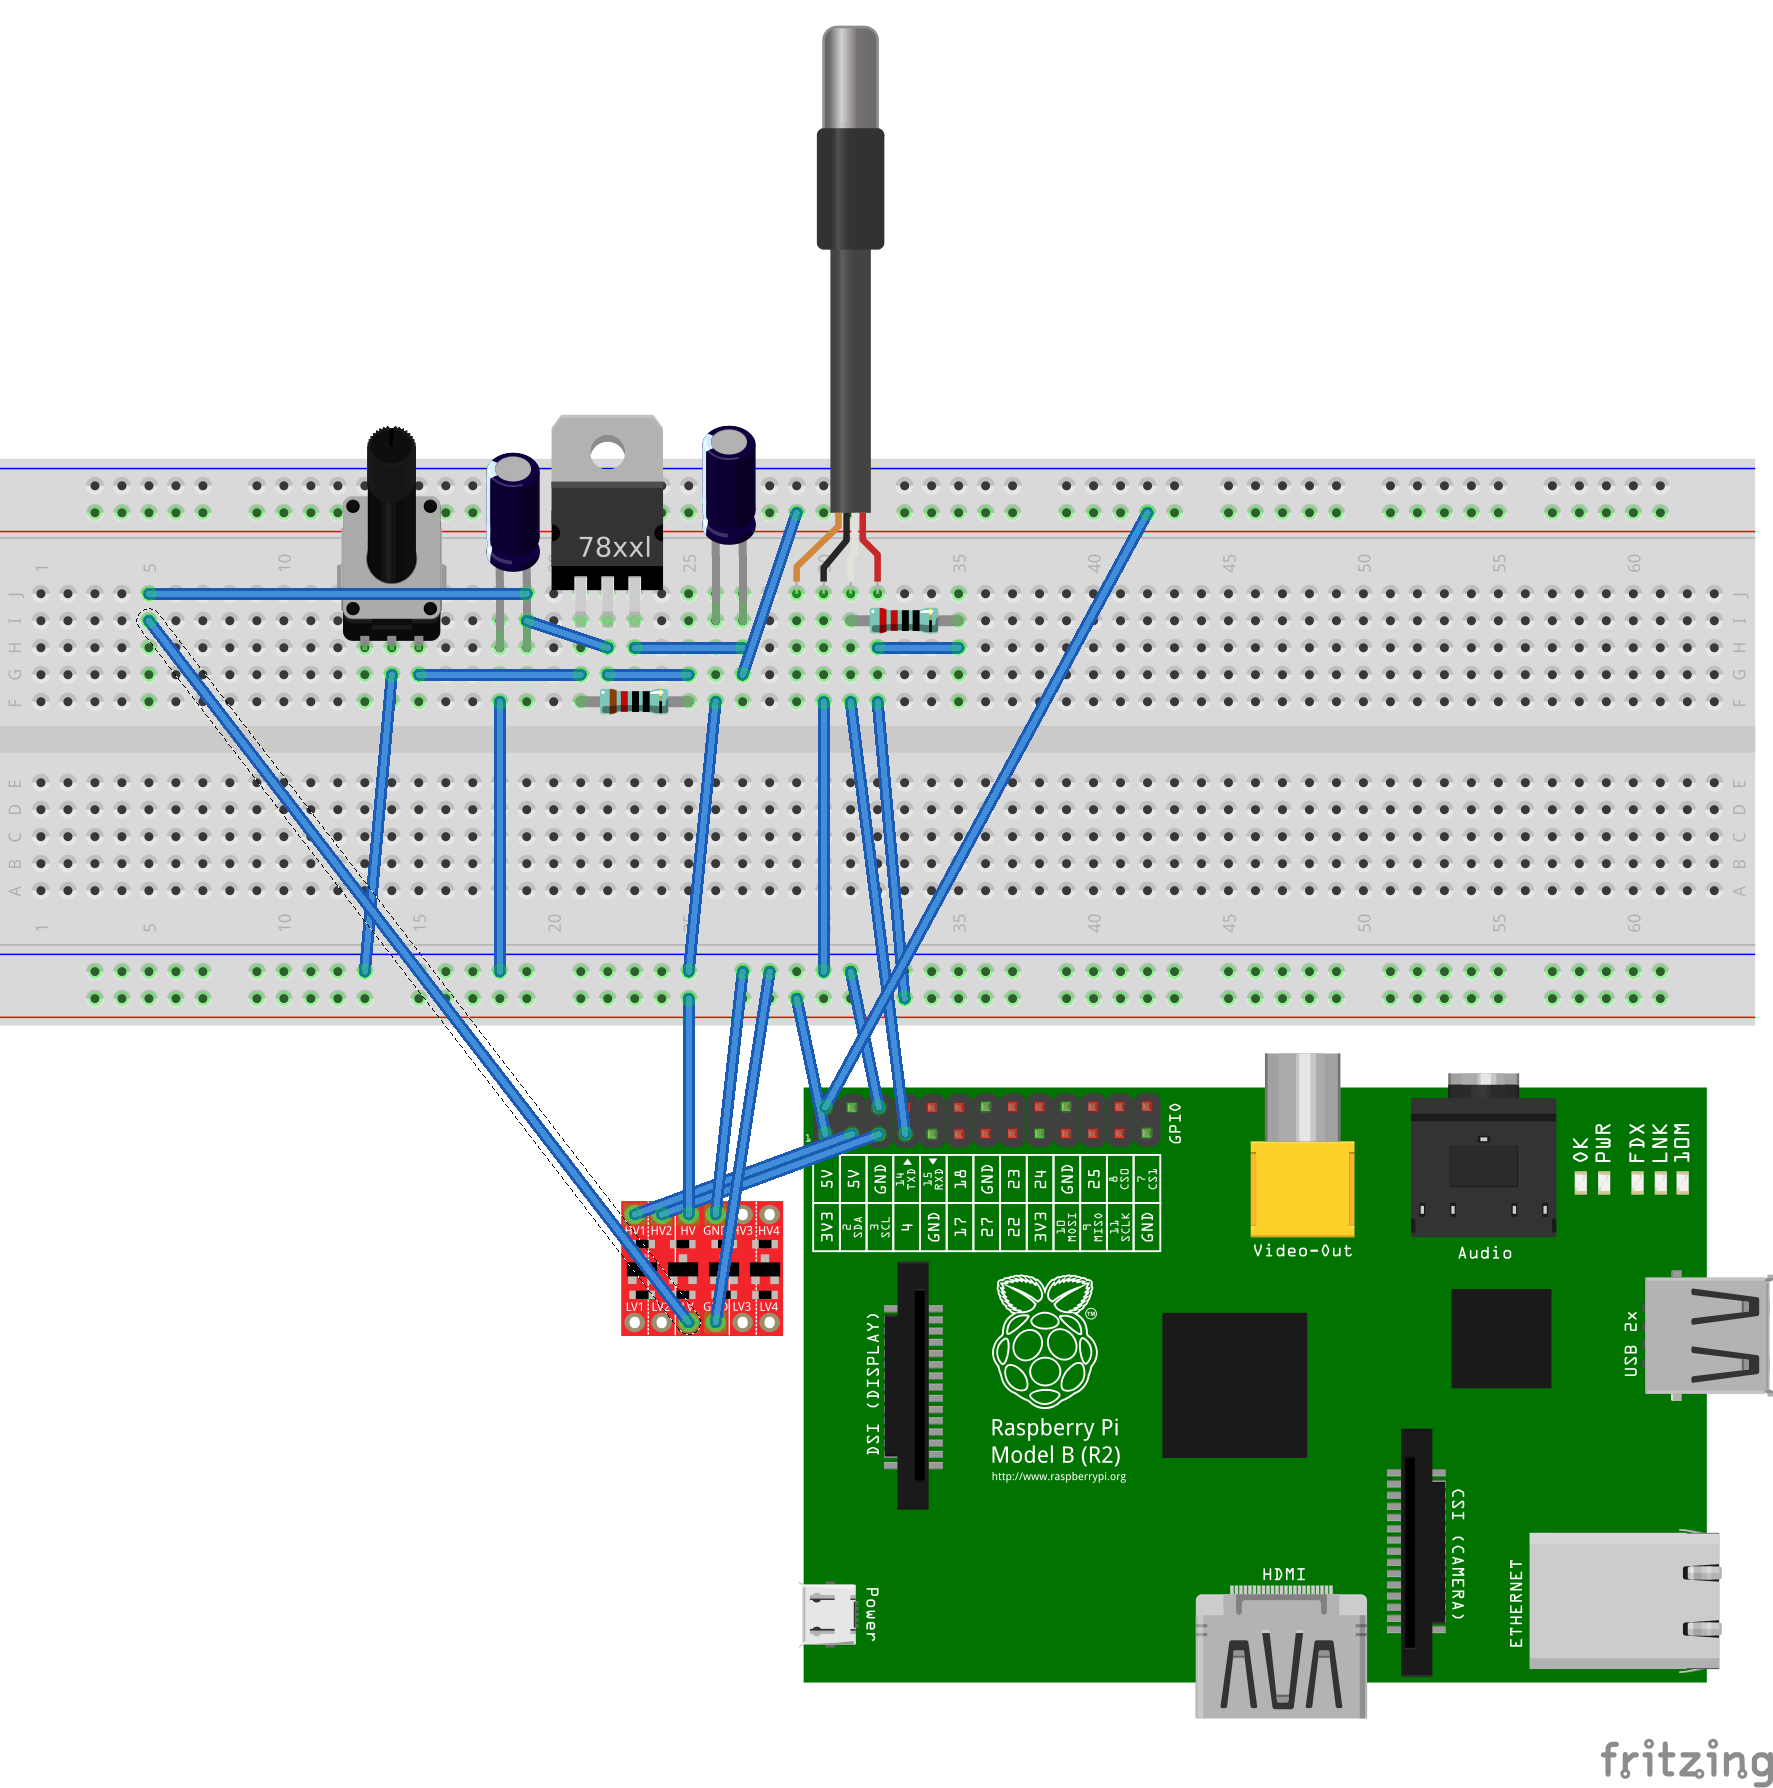
Diagram depicting the 1-wire temperature probe attached to the Raspberry Pi, along with the LD1117V generating 2.8V
The ToF sensor connects to the LV pins of the bi-directional logic level converter
Bill of materials
- Hydrometer – £11
- Swimming float – £3
- ToF sensor (https://www.sparkfun.com/products/12784) – $14.95
- Logic level converter (https://www.sparkfun.com/products/12009) – $2.95
- Raspberry Pi – £25
- Acrylic cylinder (40mm x 750mm) – £10
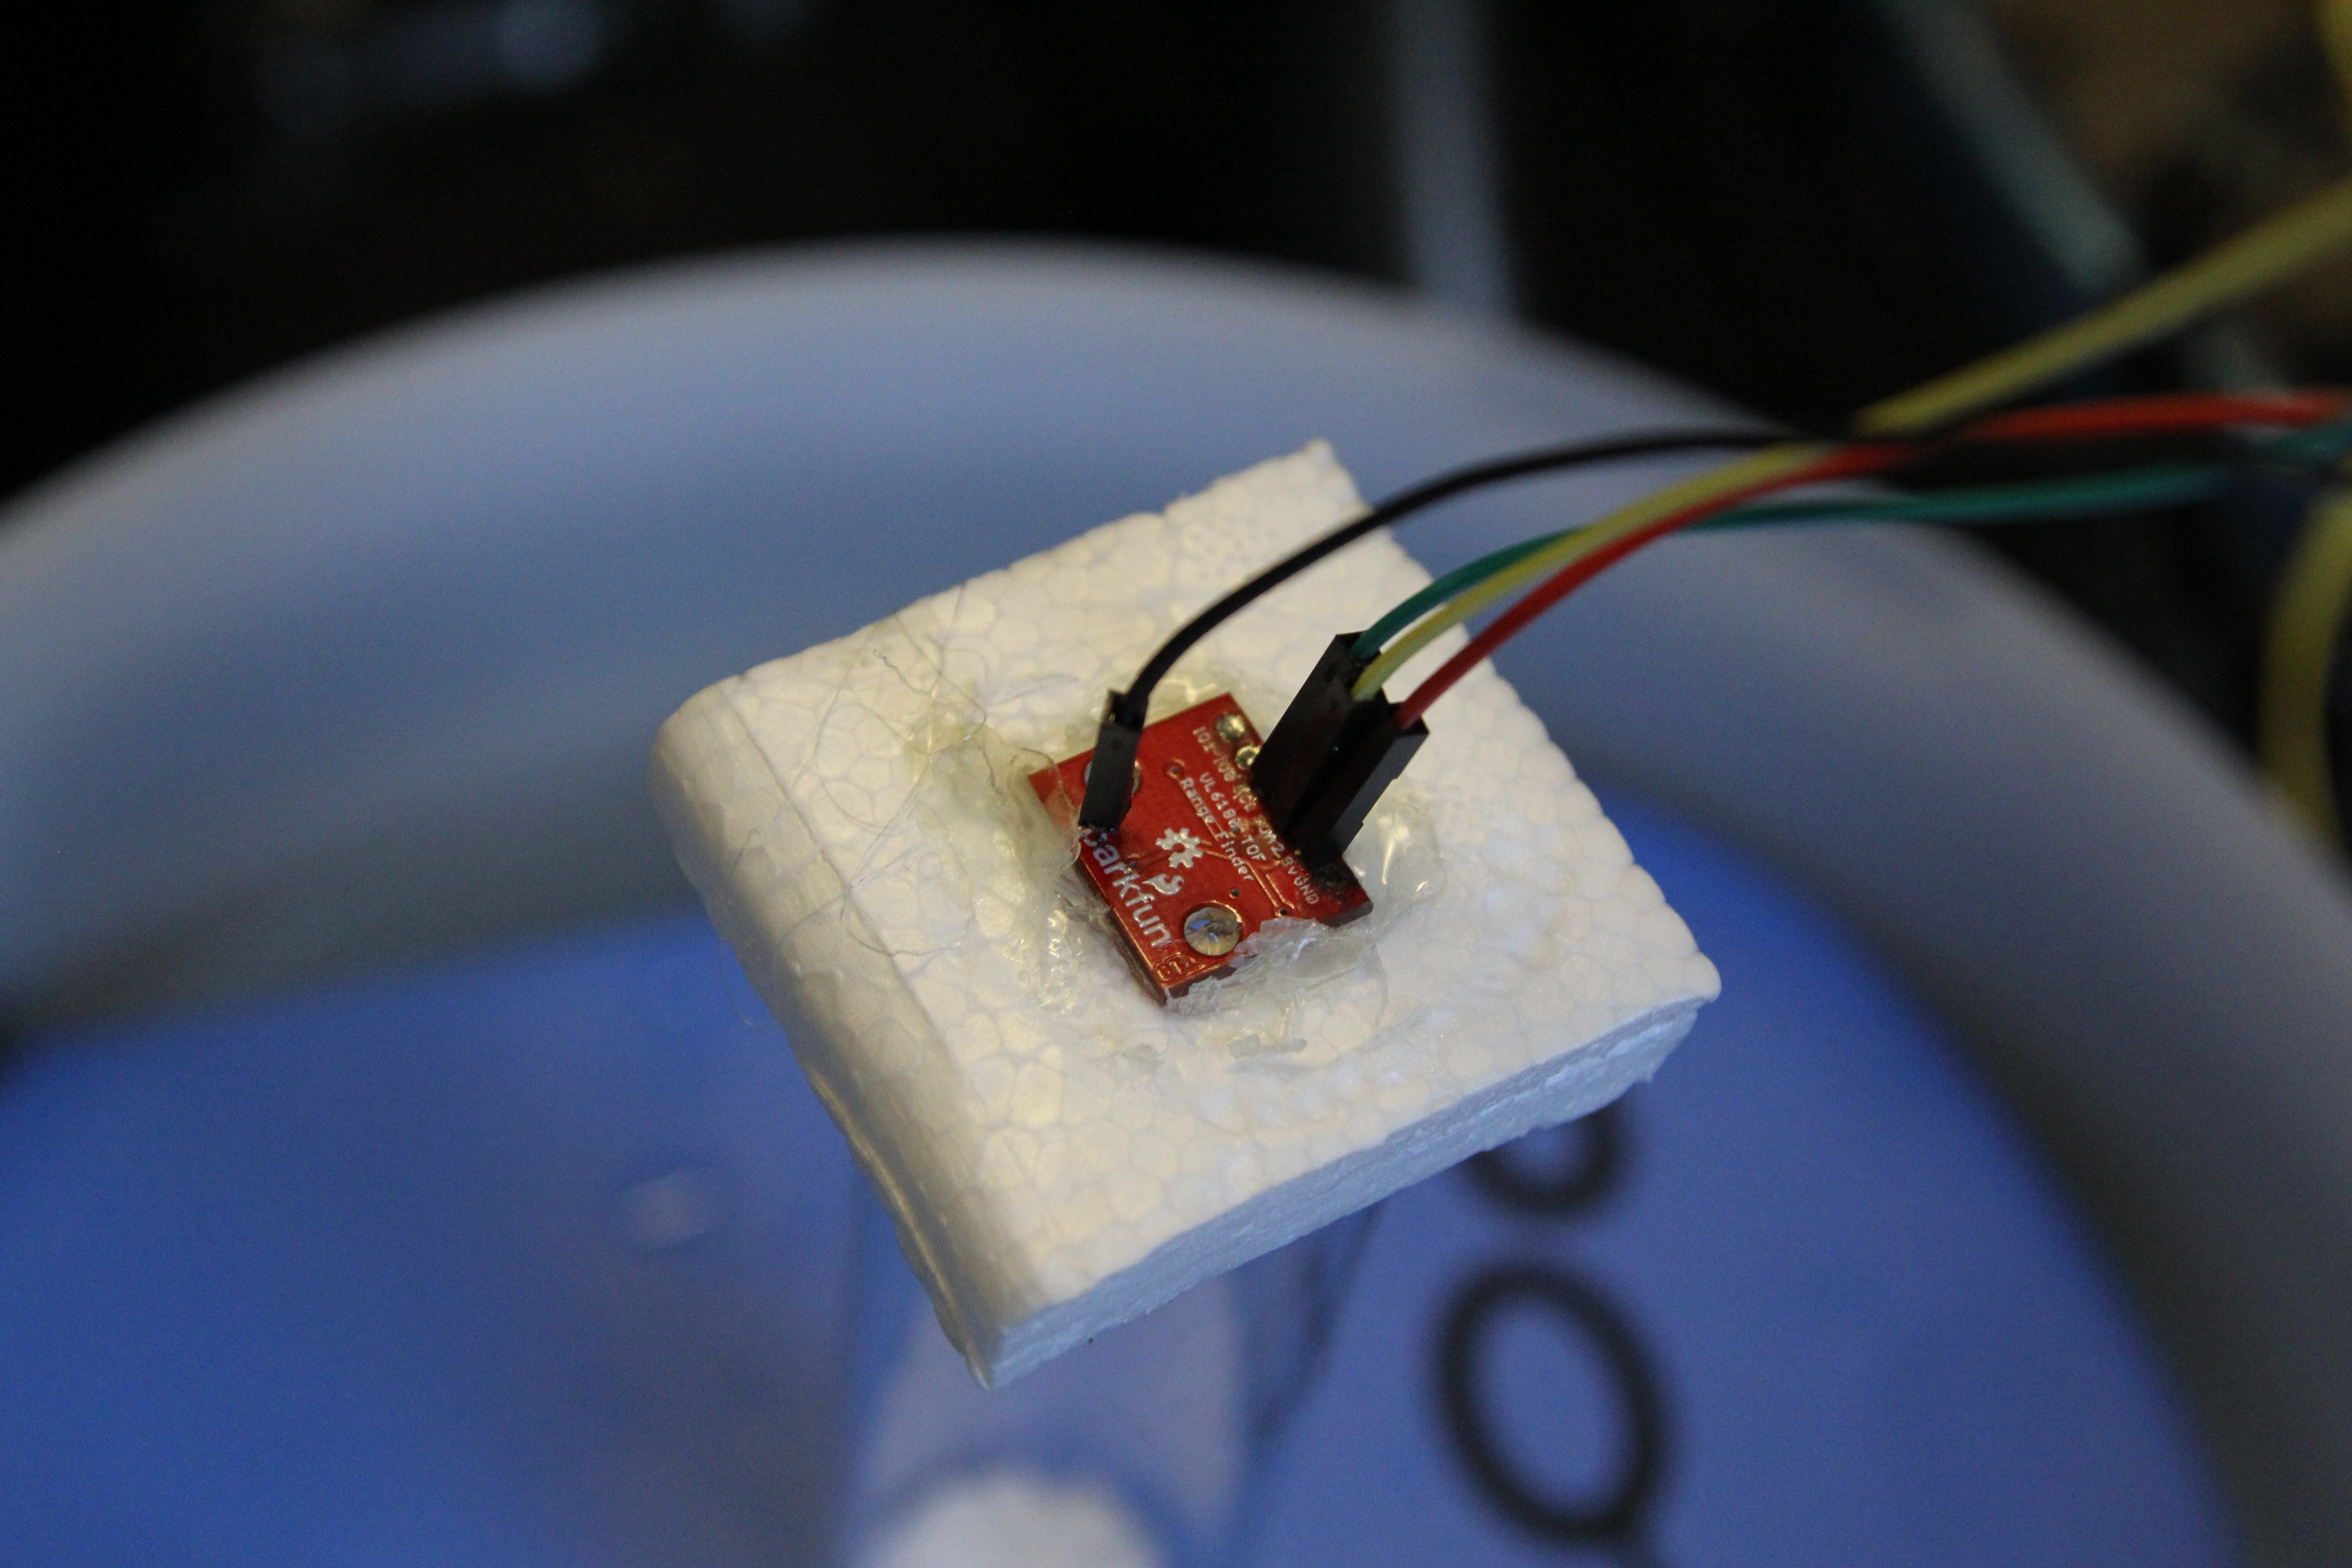
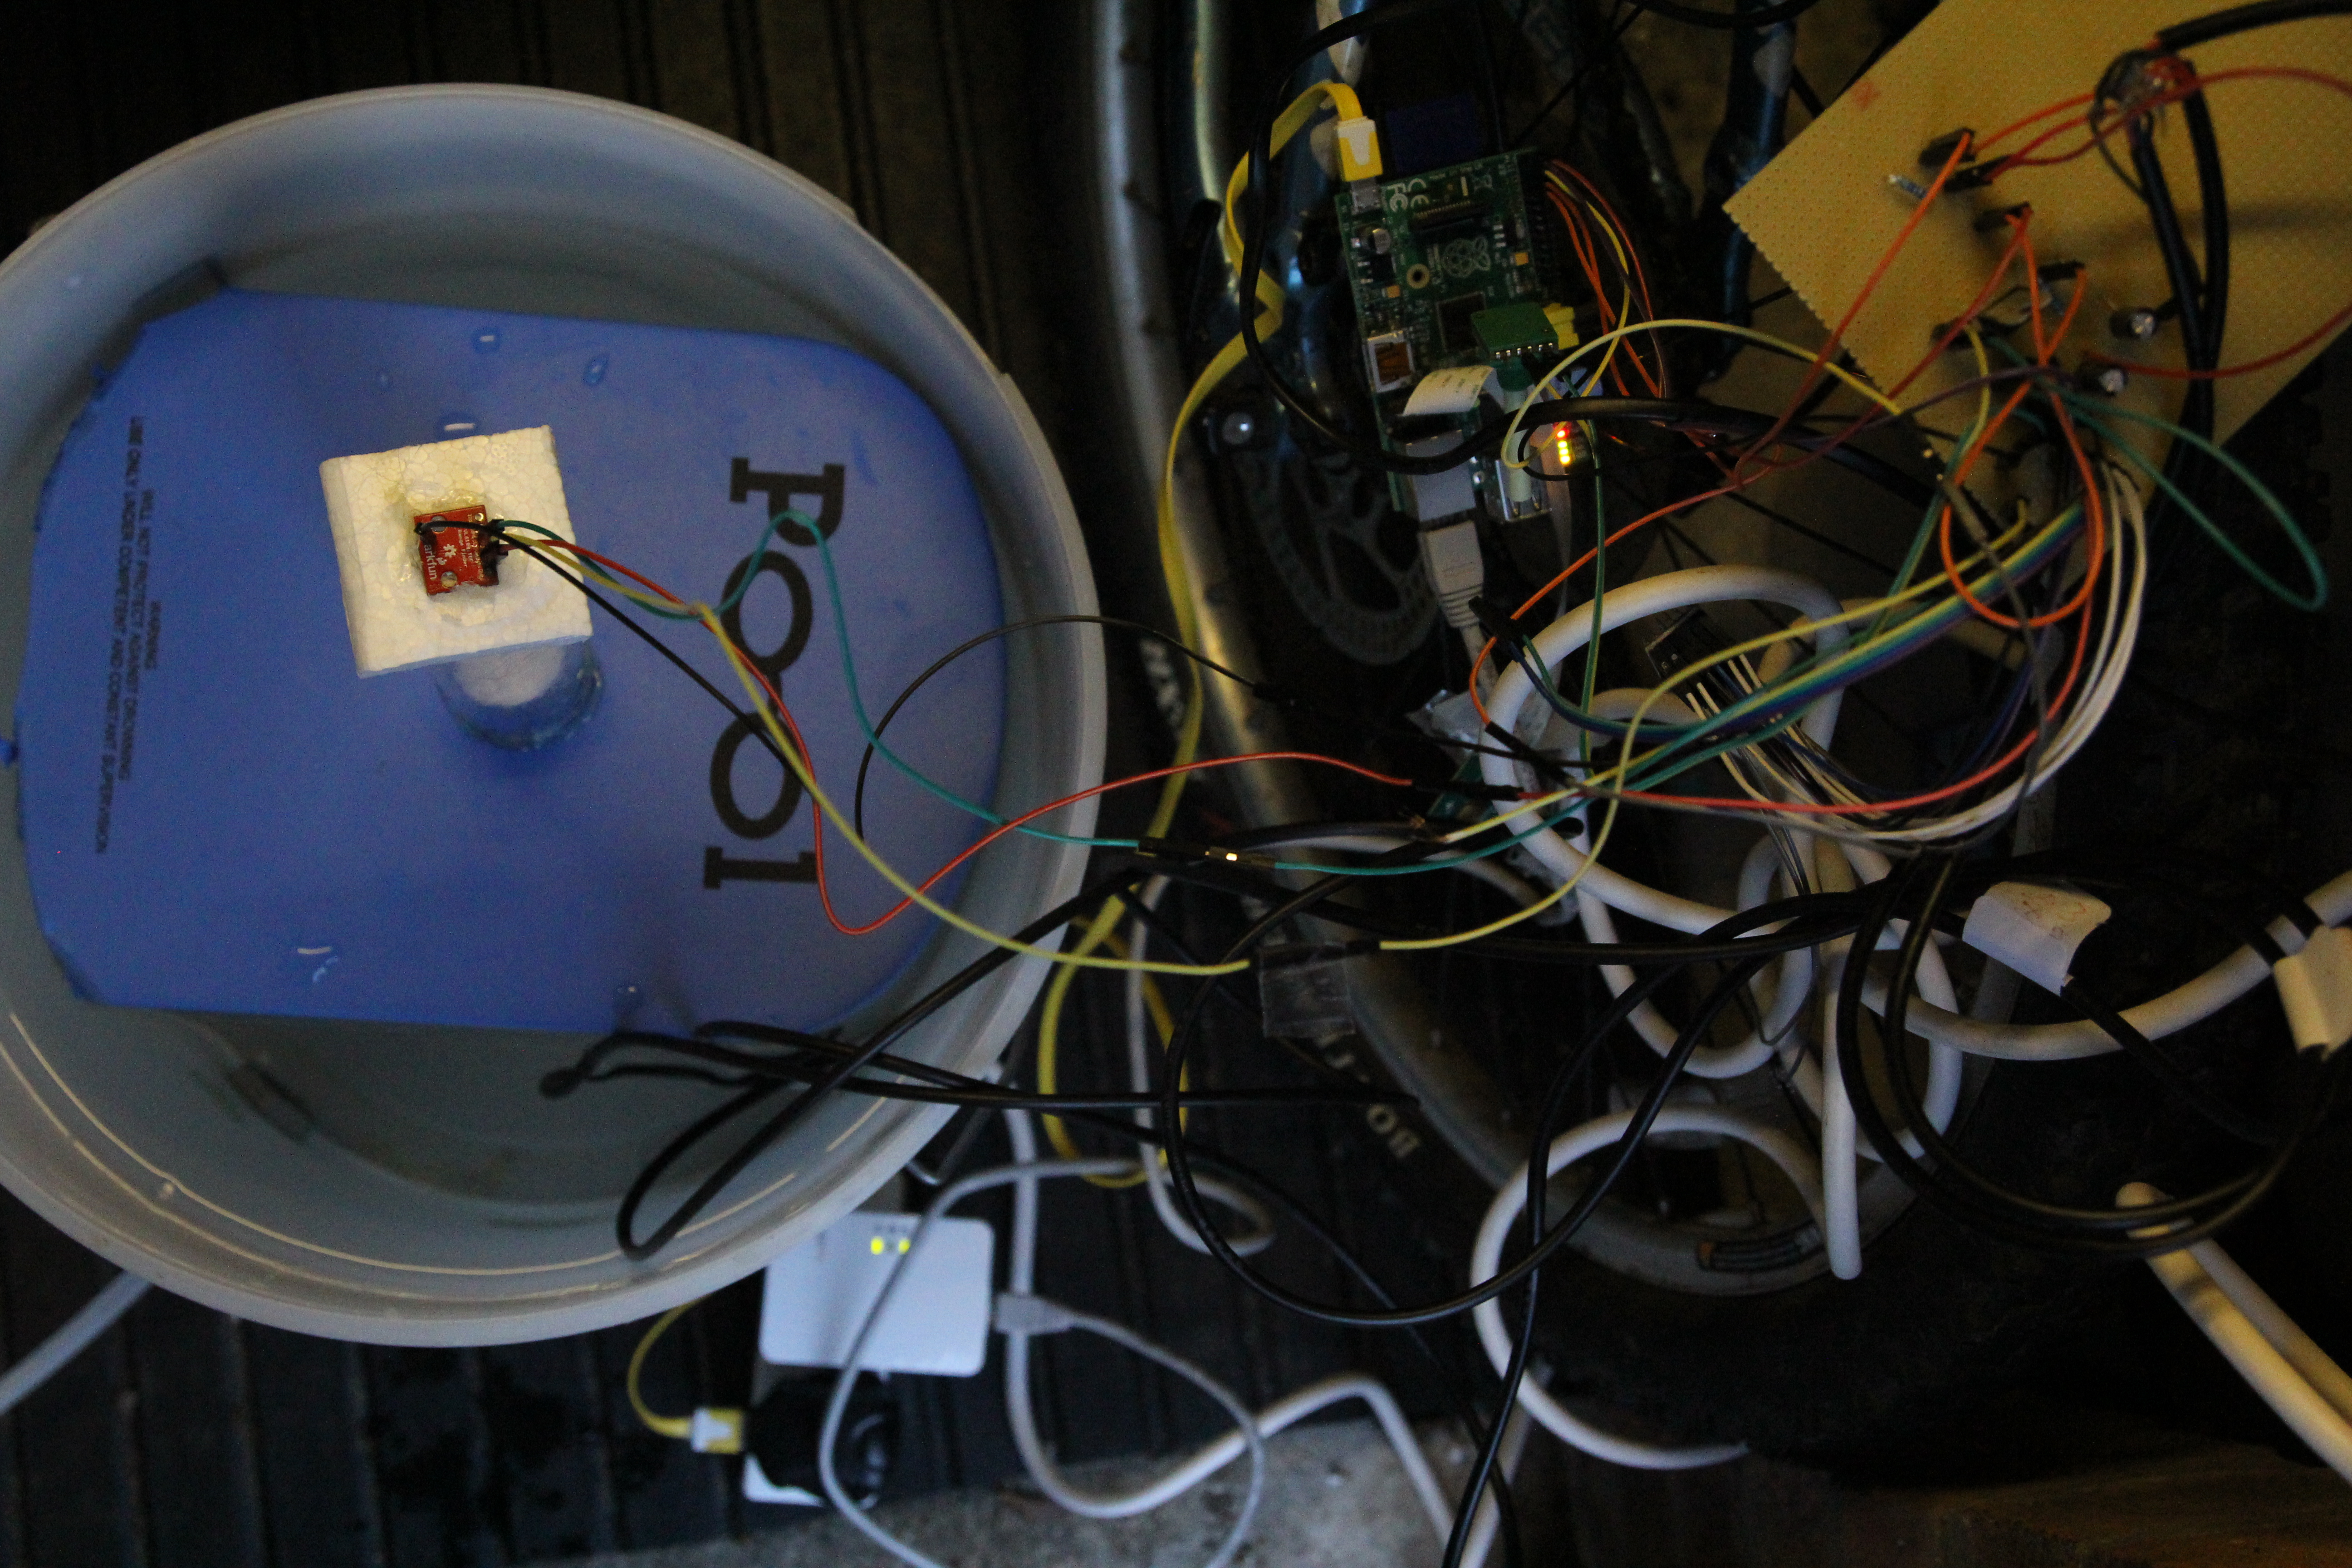
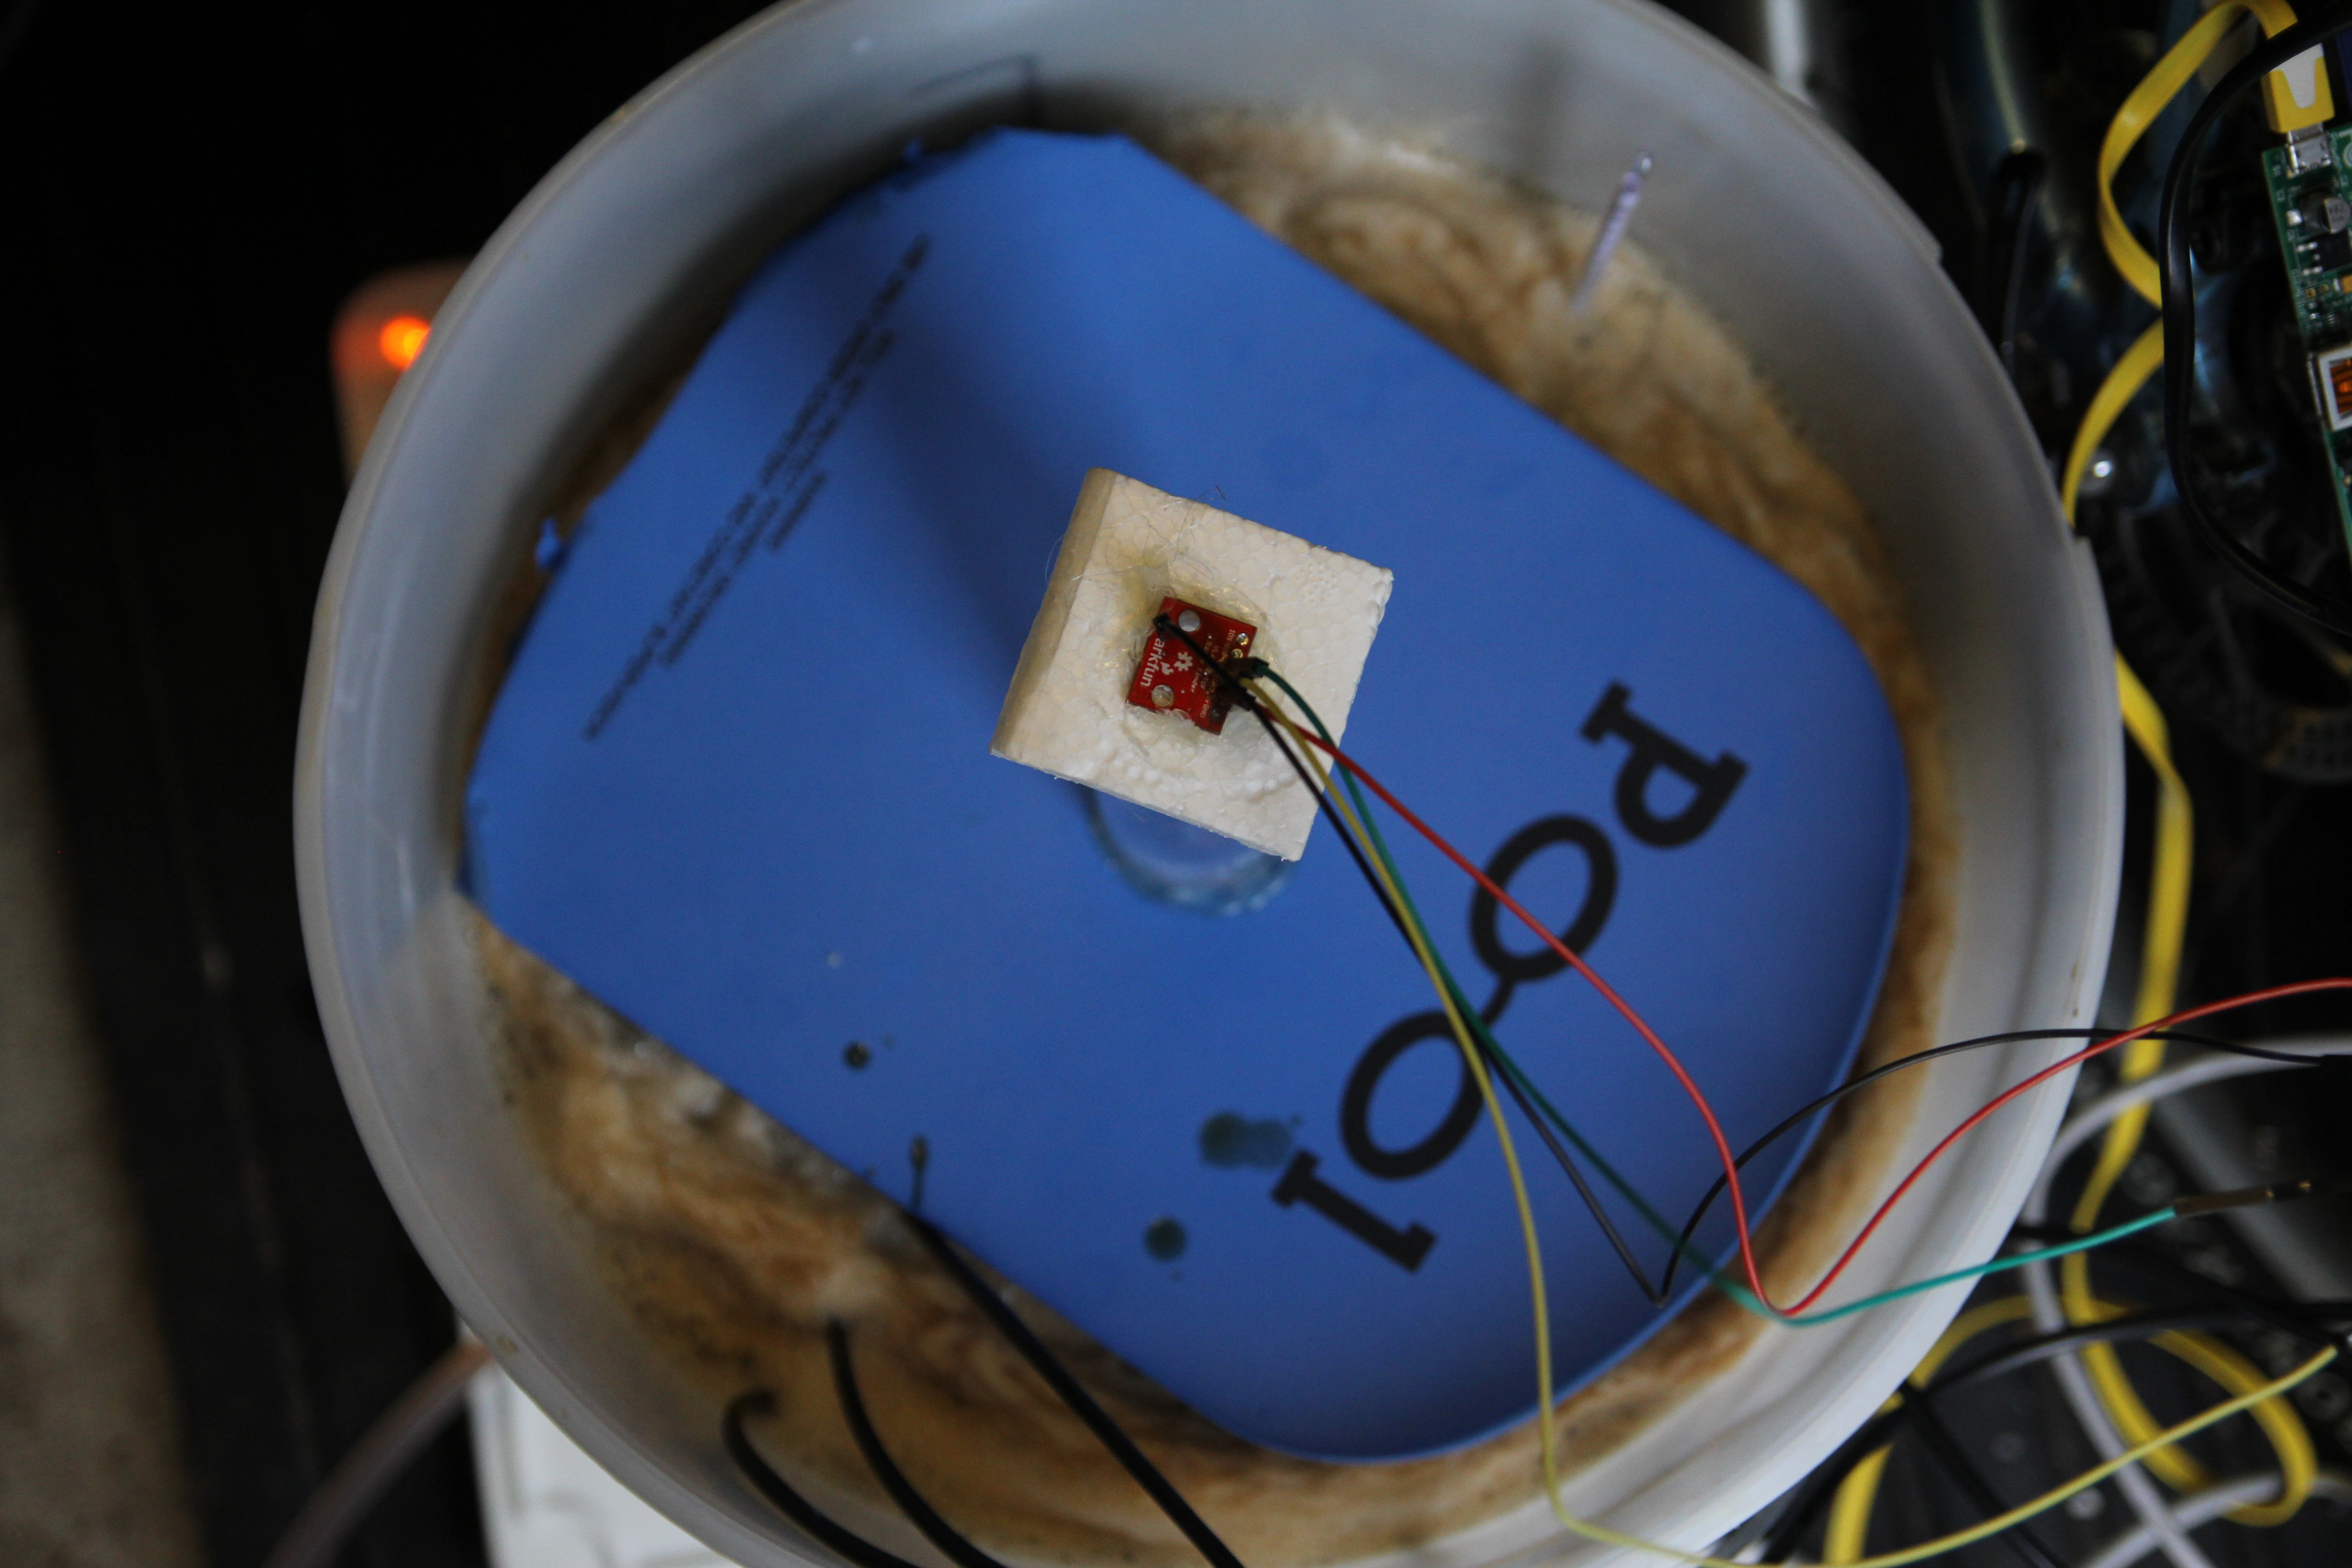
ToF sensor mounted onto polystyrene and attached to acrylic pipe
LD1117V generating the 2.8V needed for the ToF chip from the Raspberry Pi’s 5V output
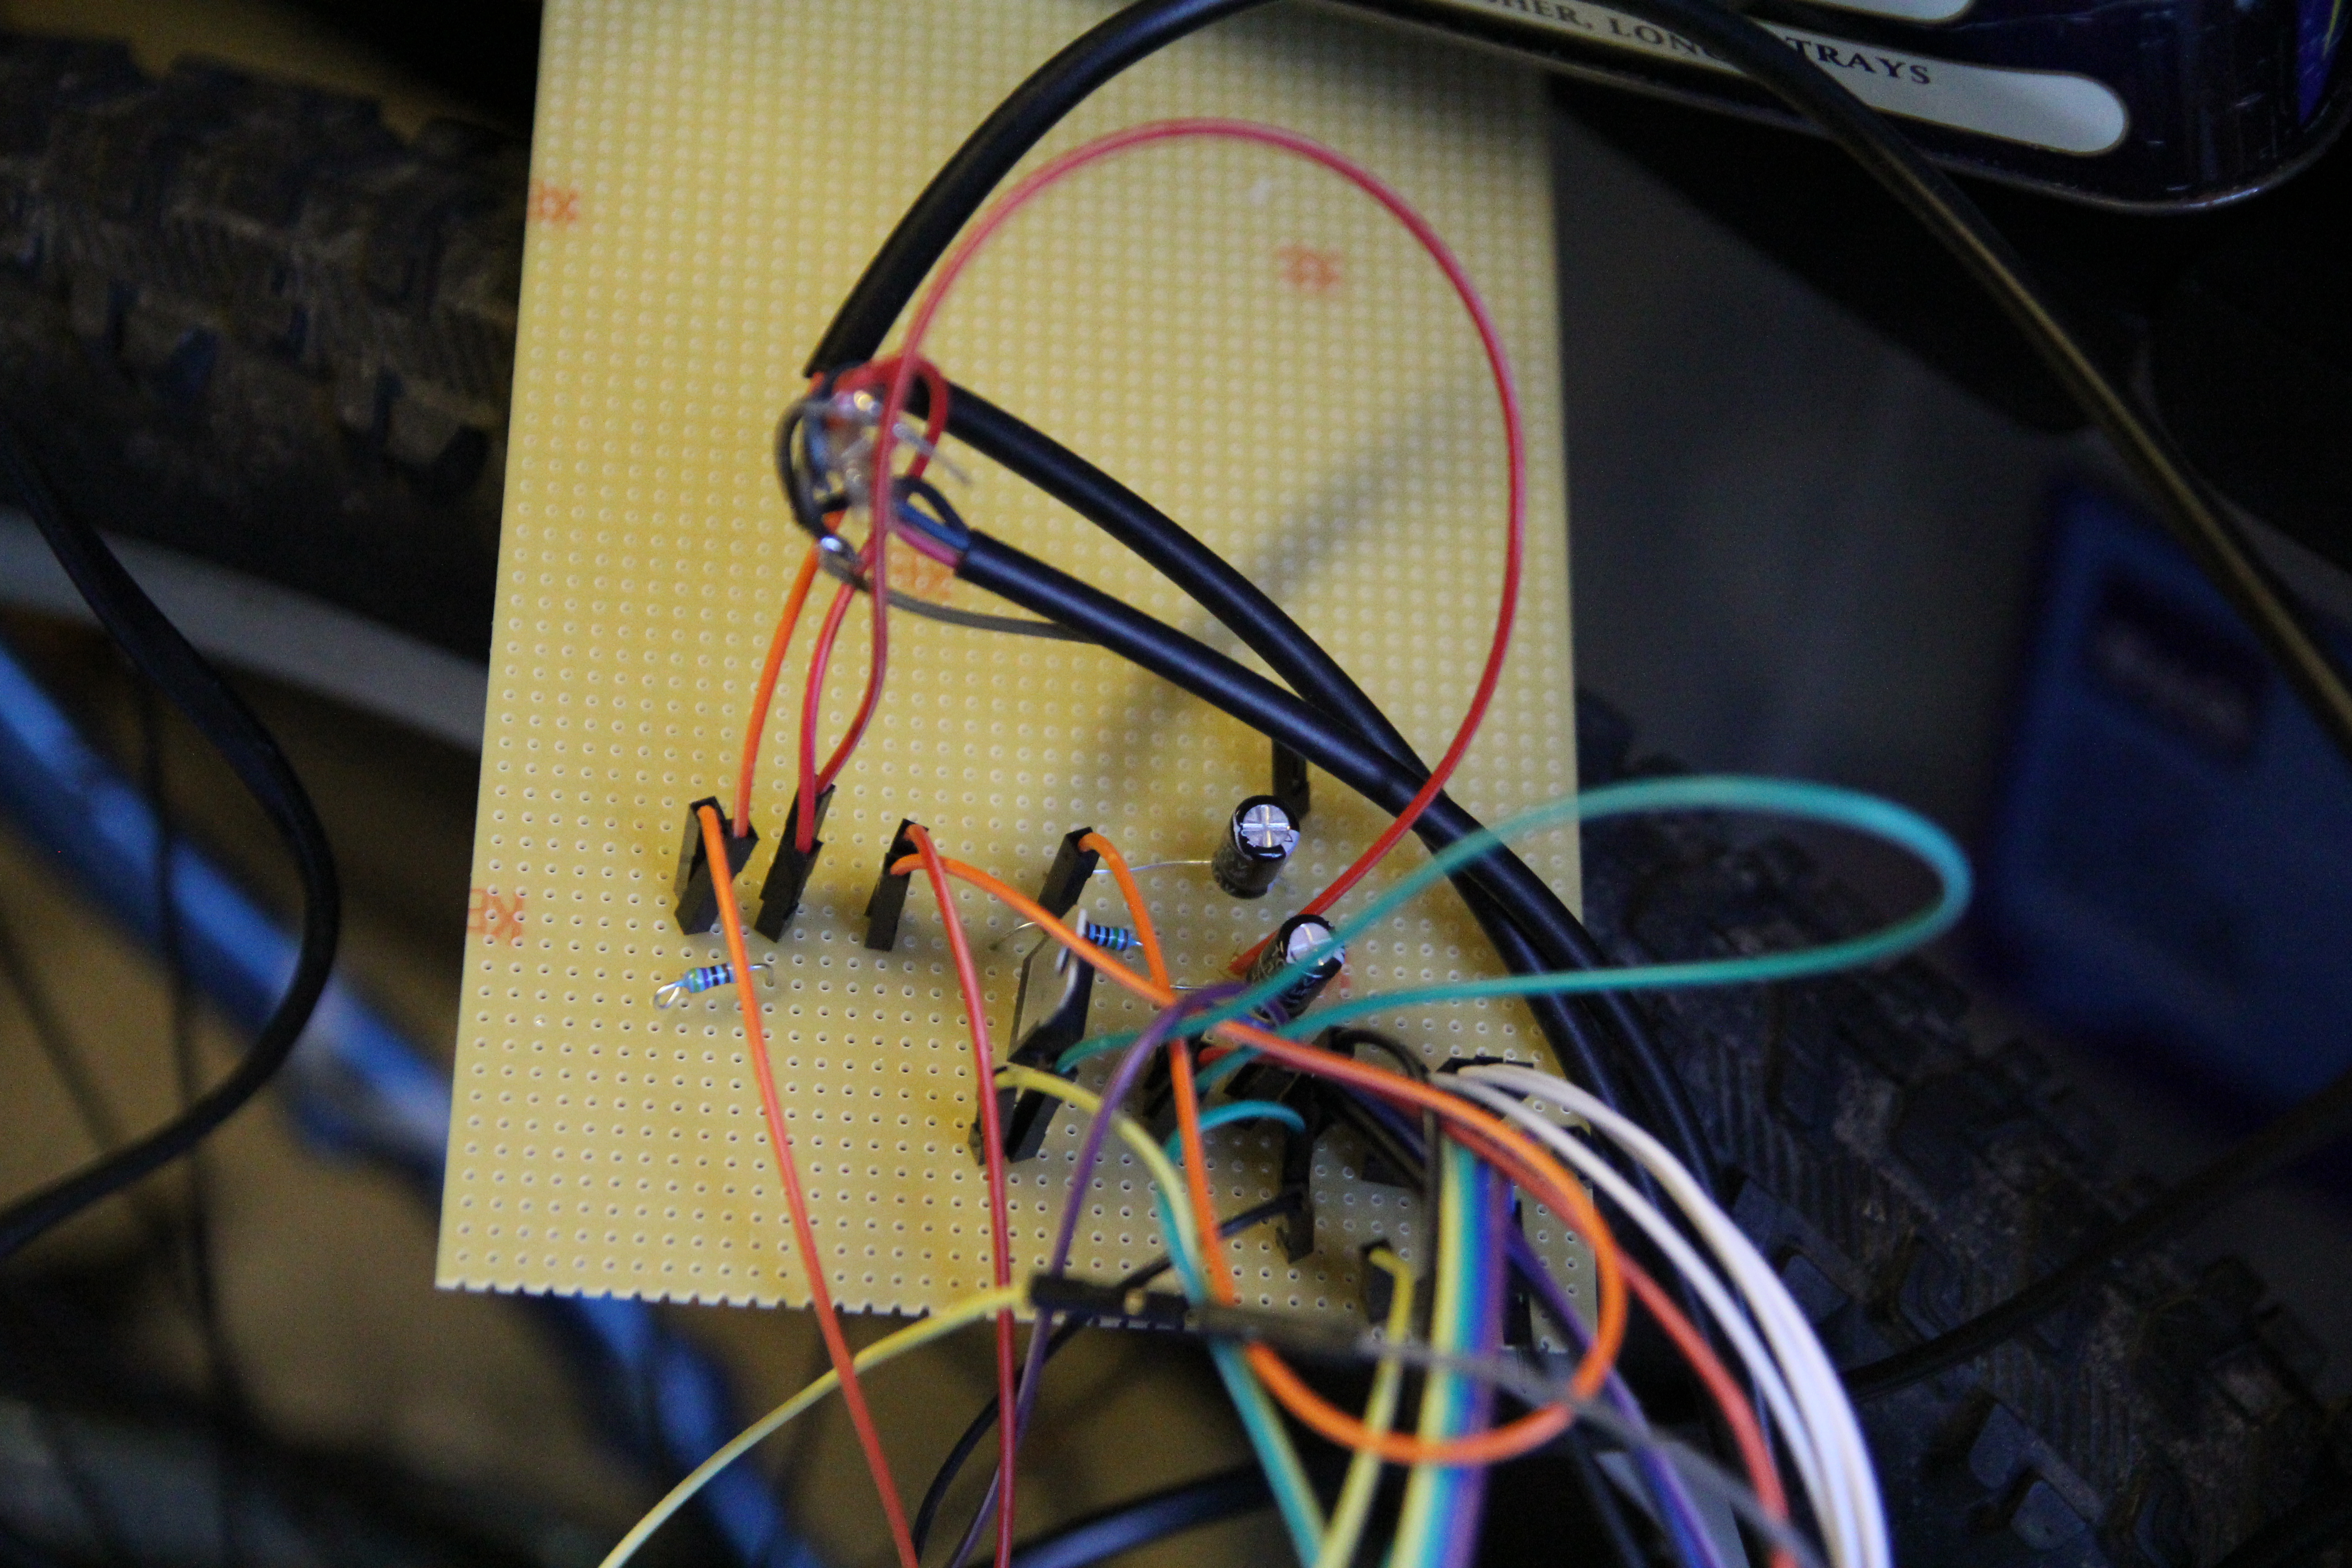
Our system, connected to a networked Raspberry Pi
Polystyrene attached to the top of the hydrometer along with acrylic pipe attached to float
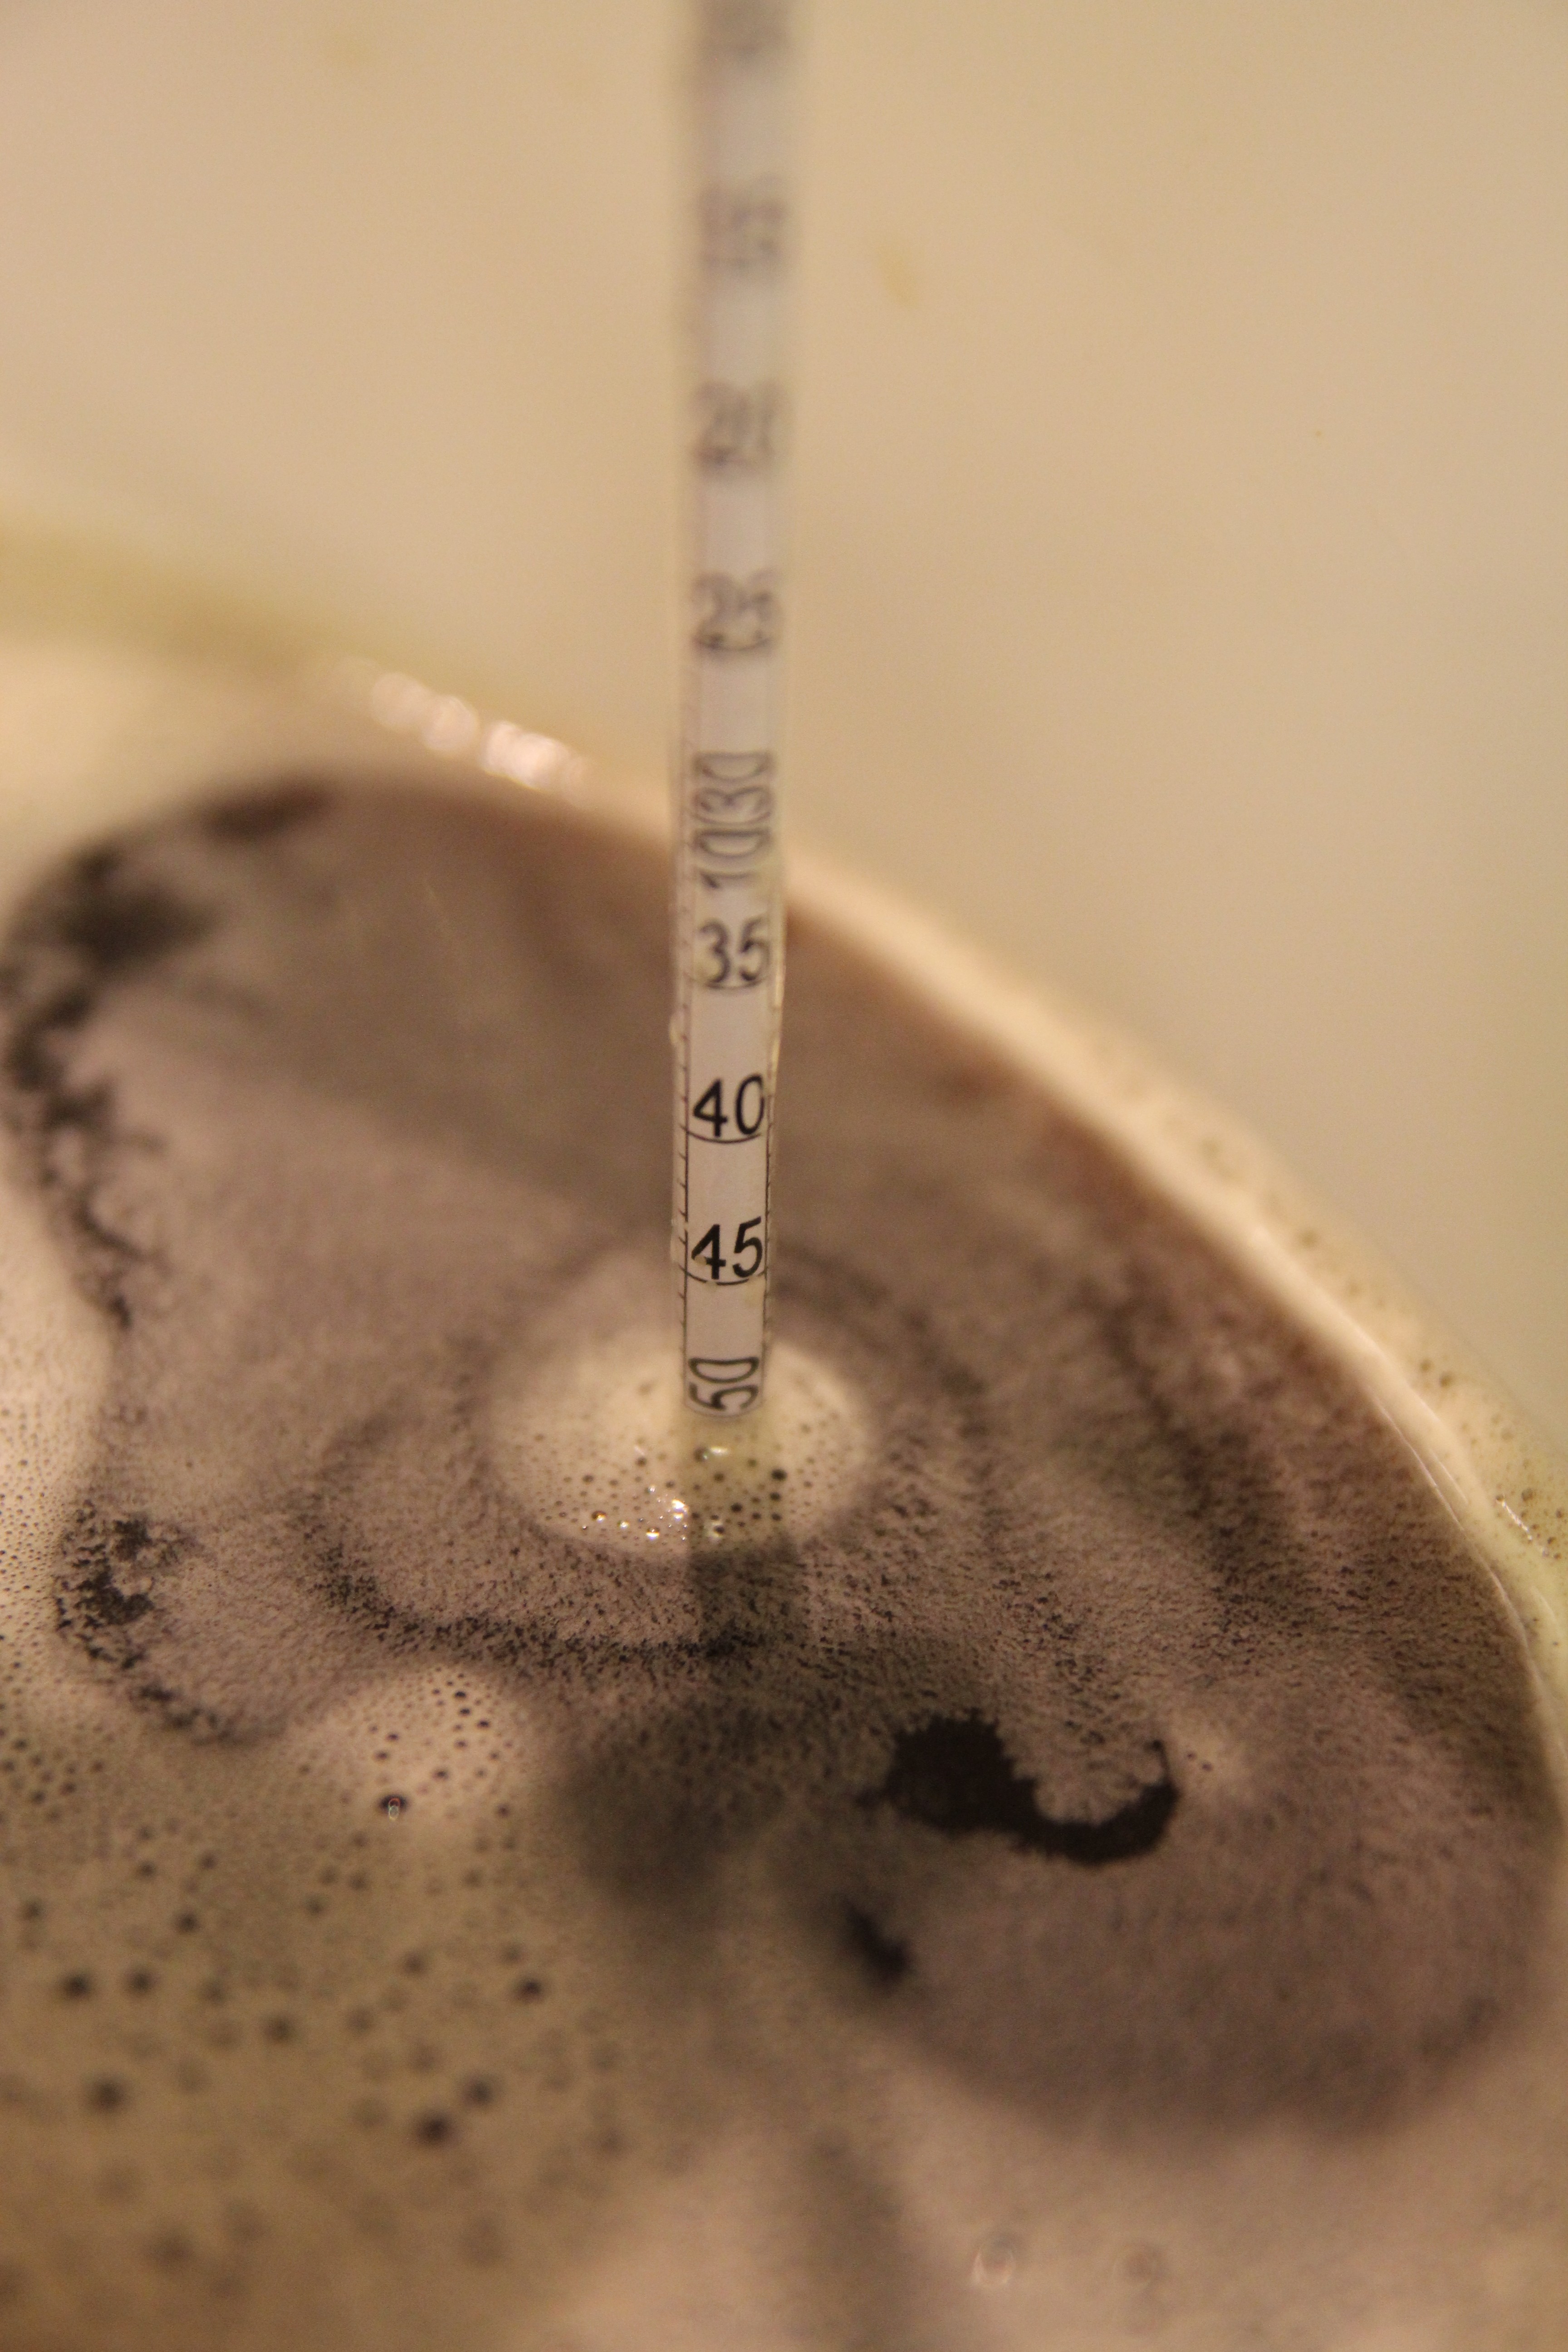
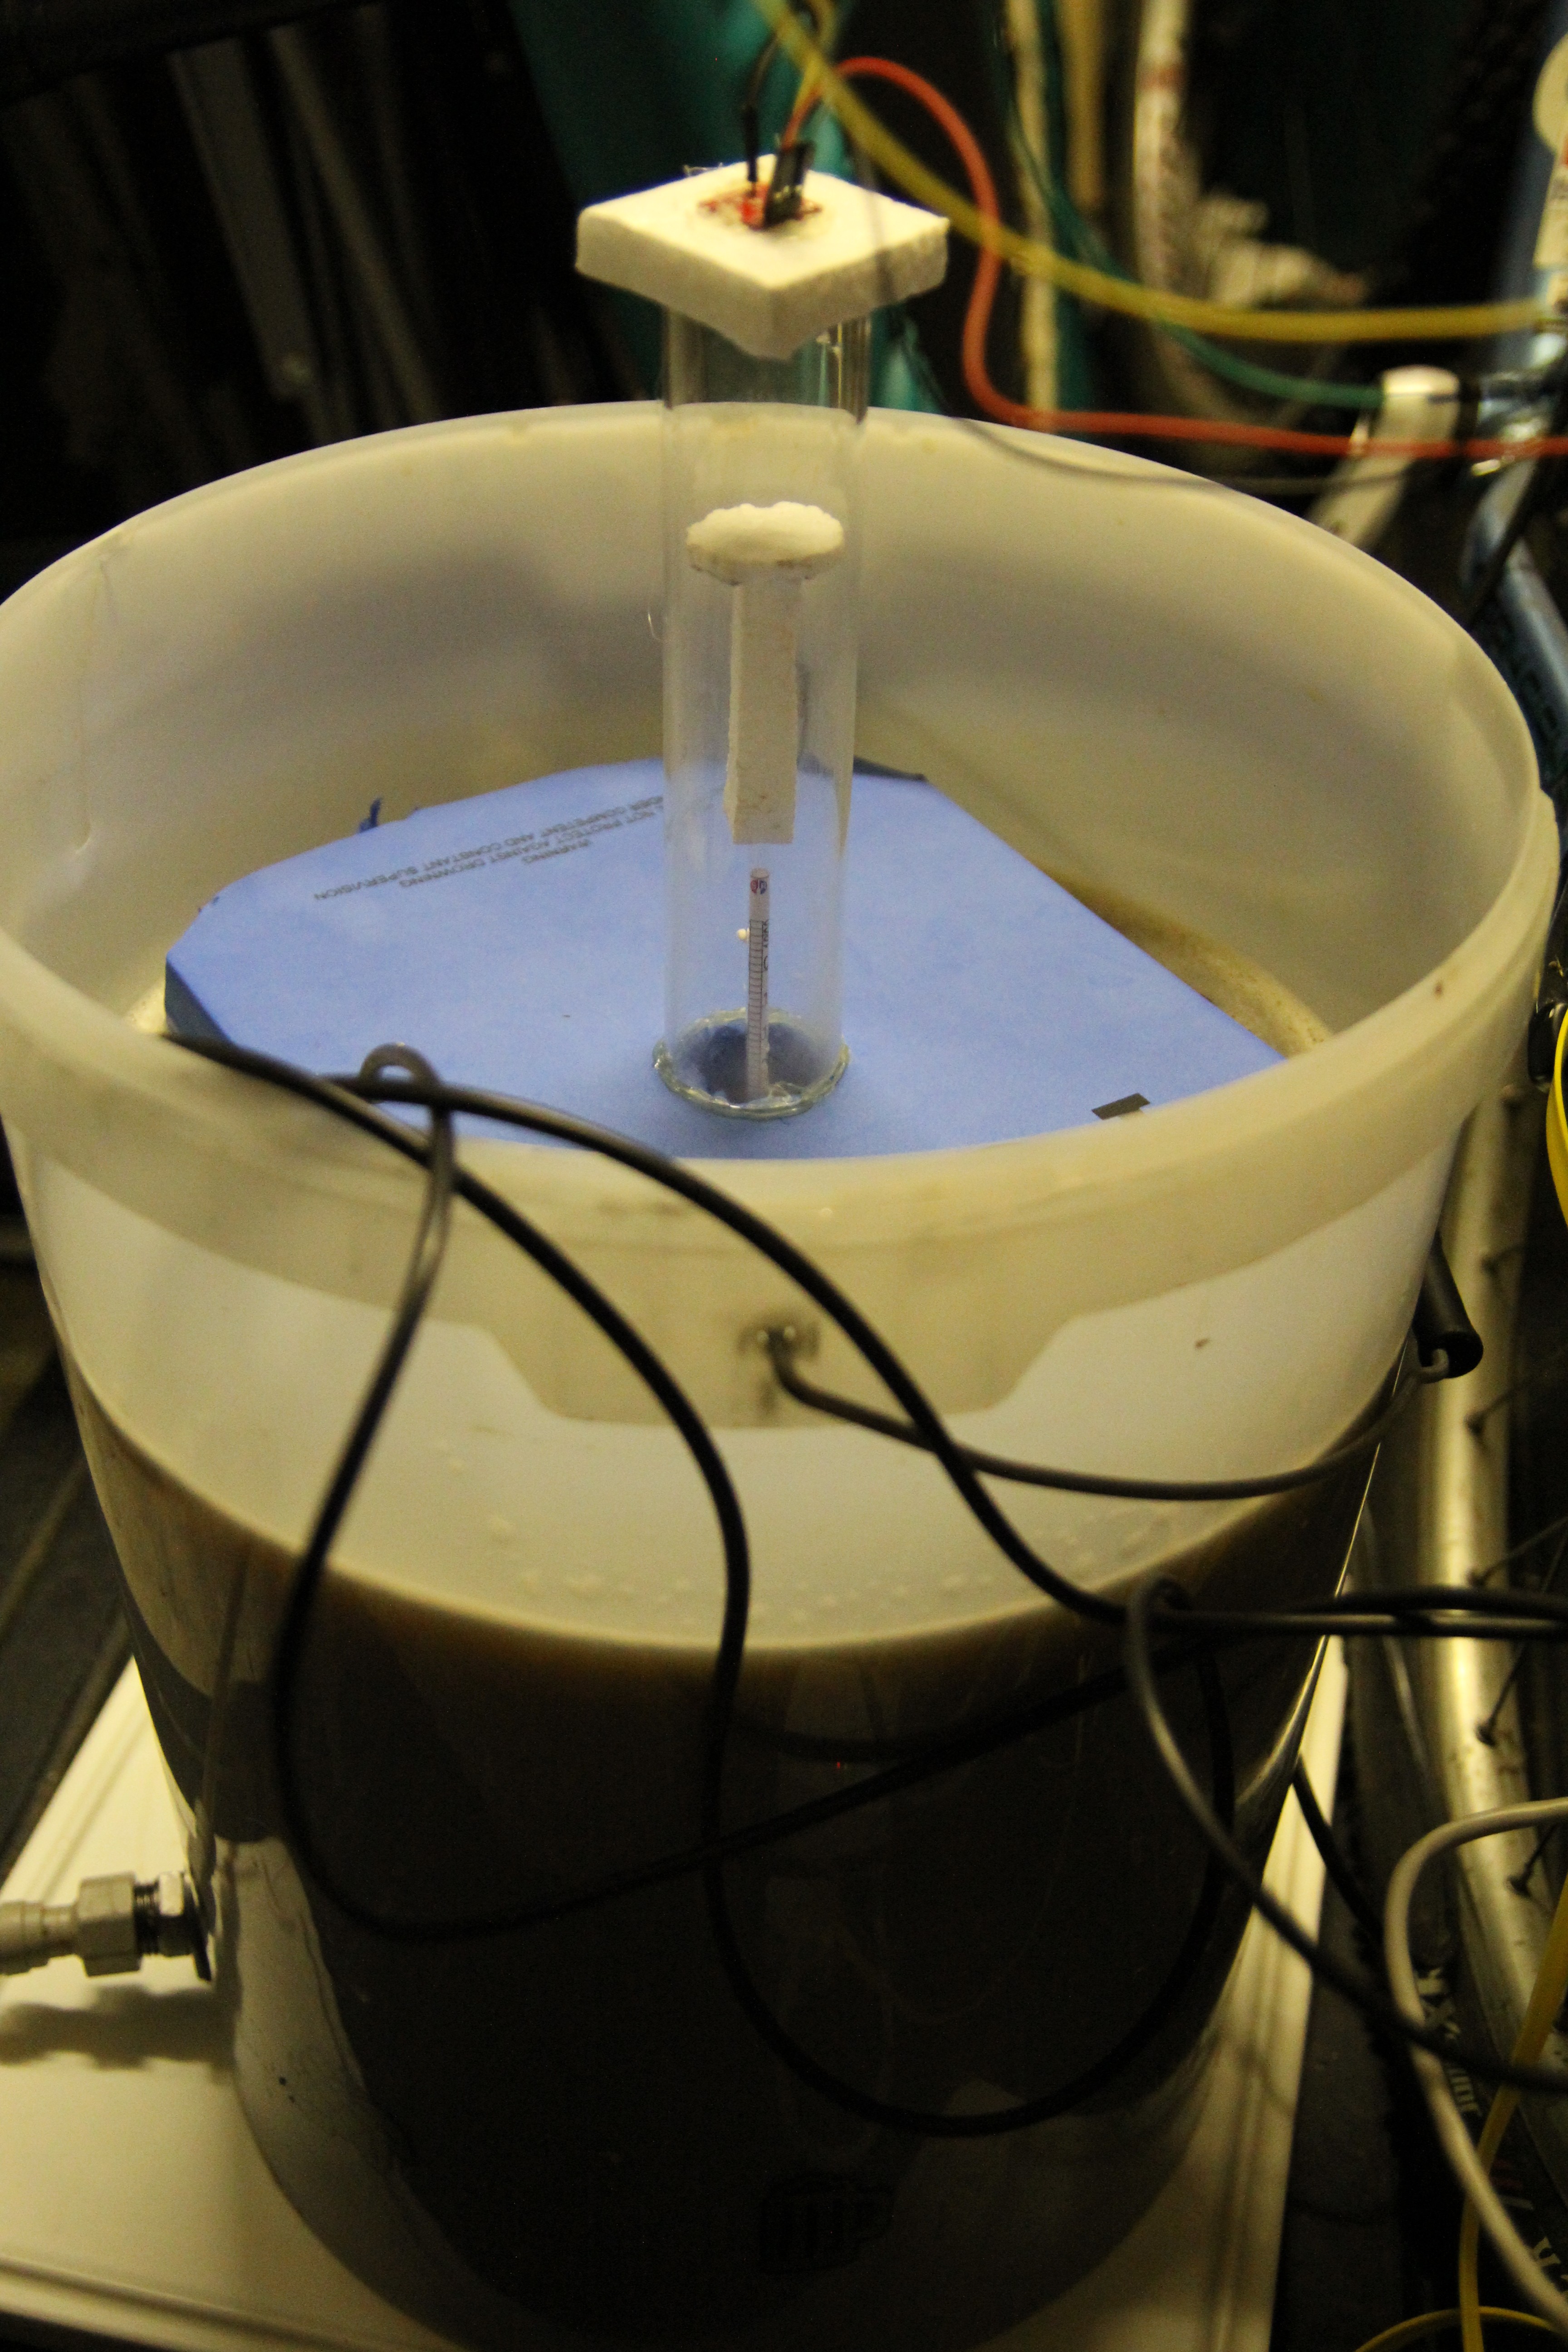
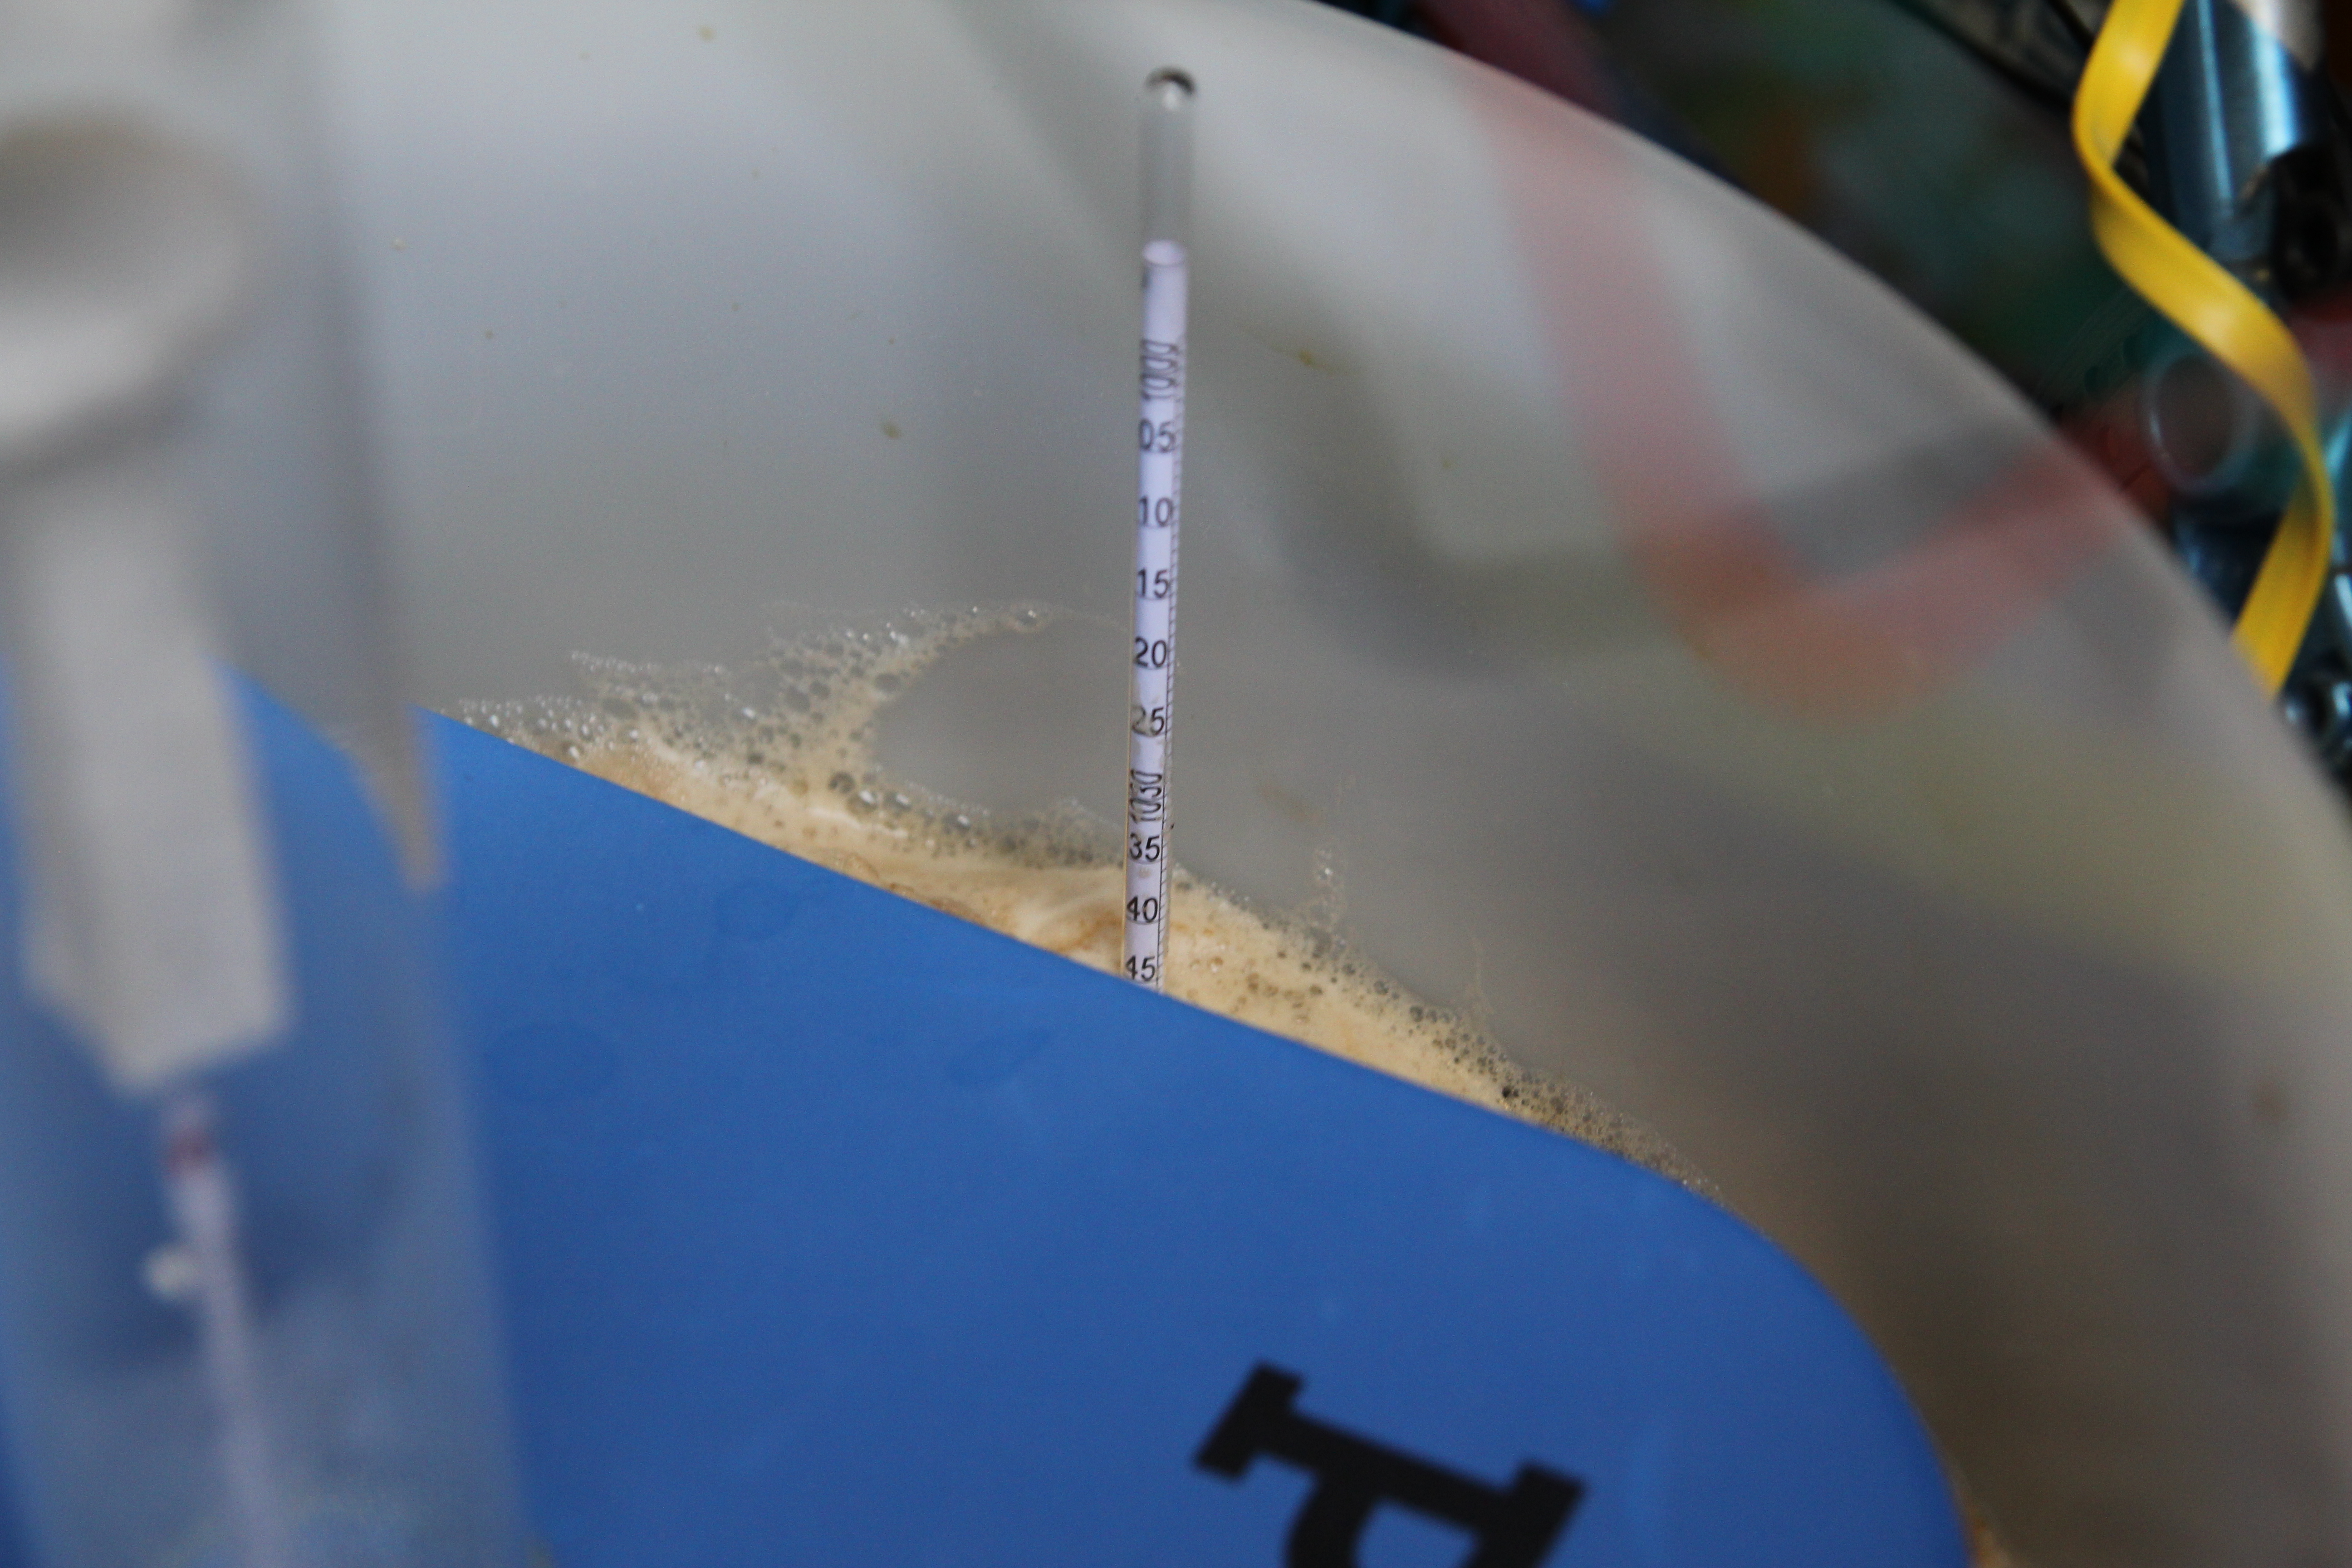
Hydrometer photo taken 28/03/2015 10:30
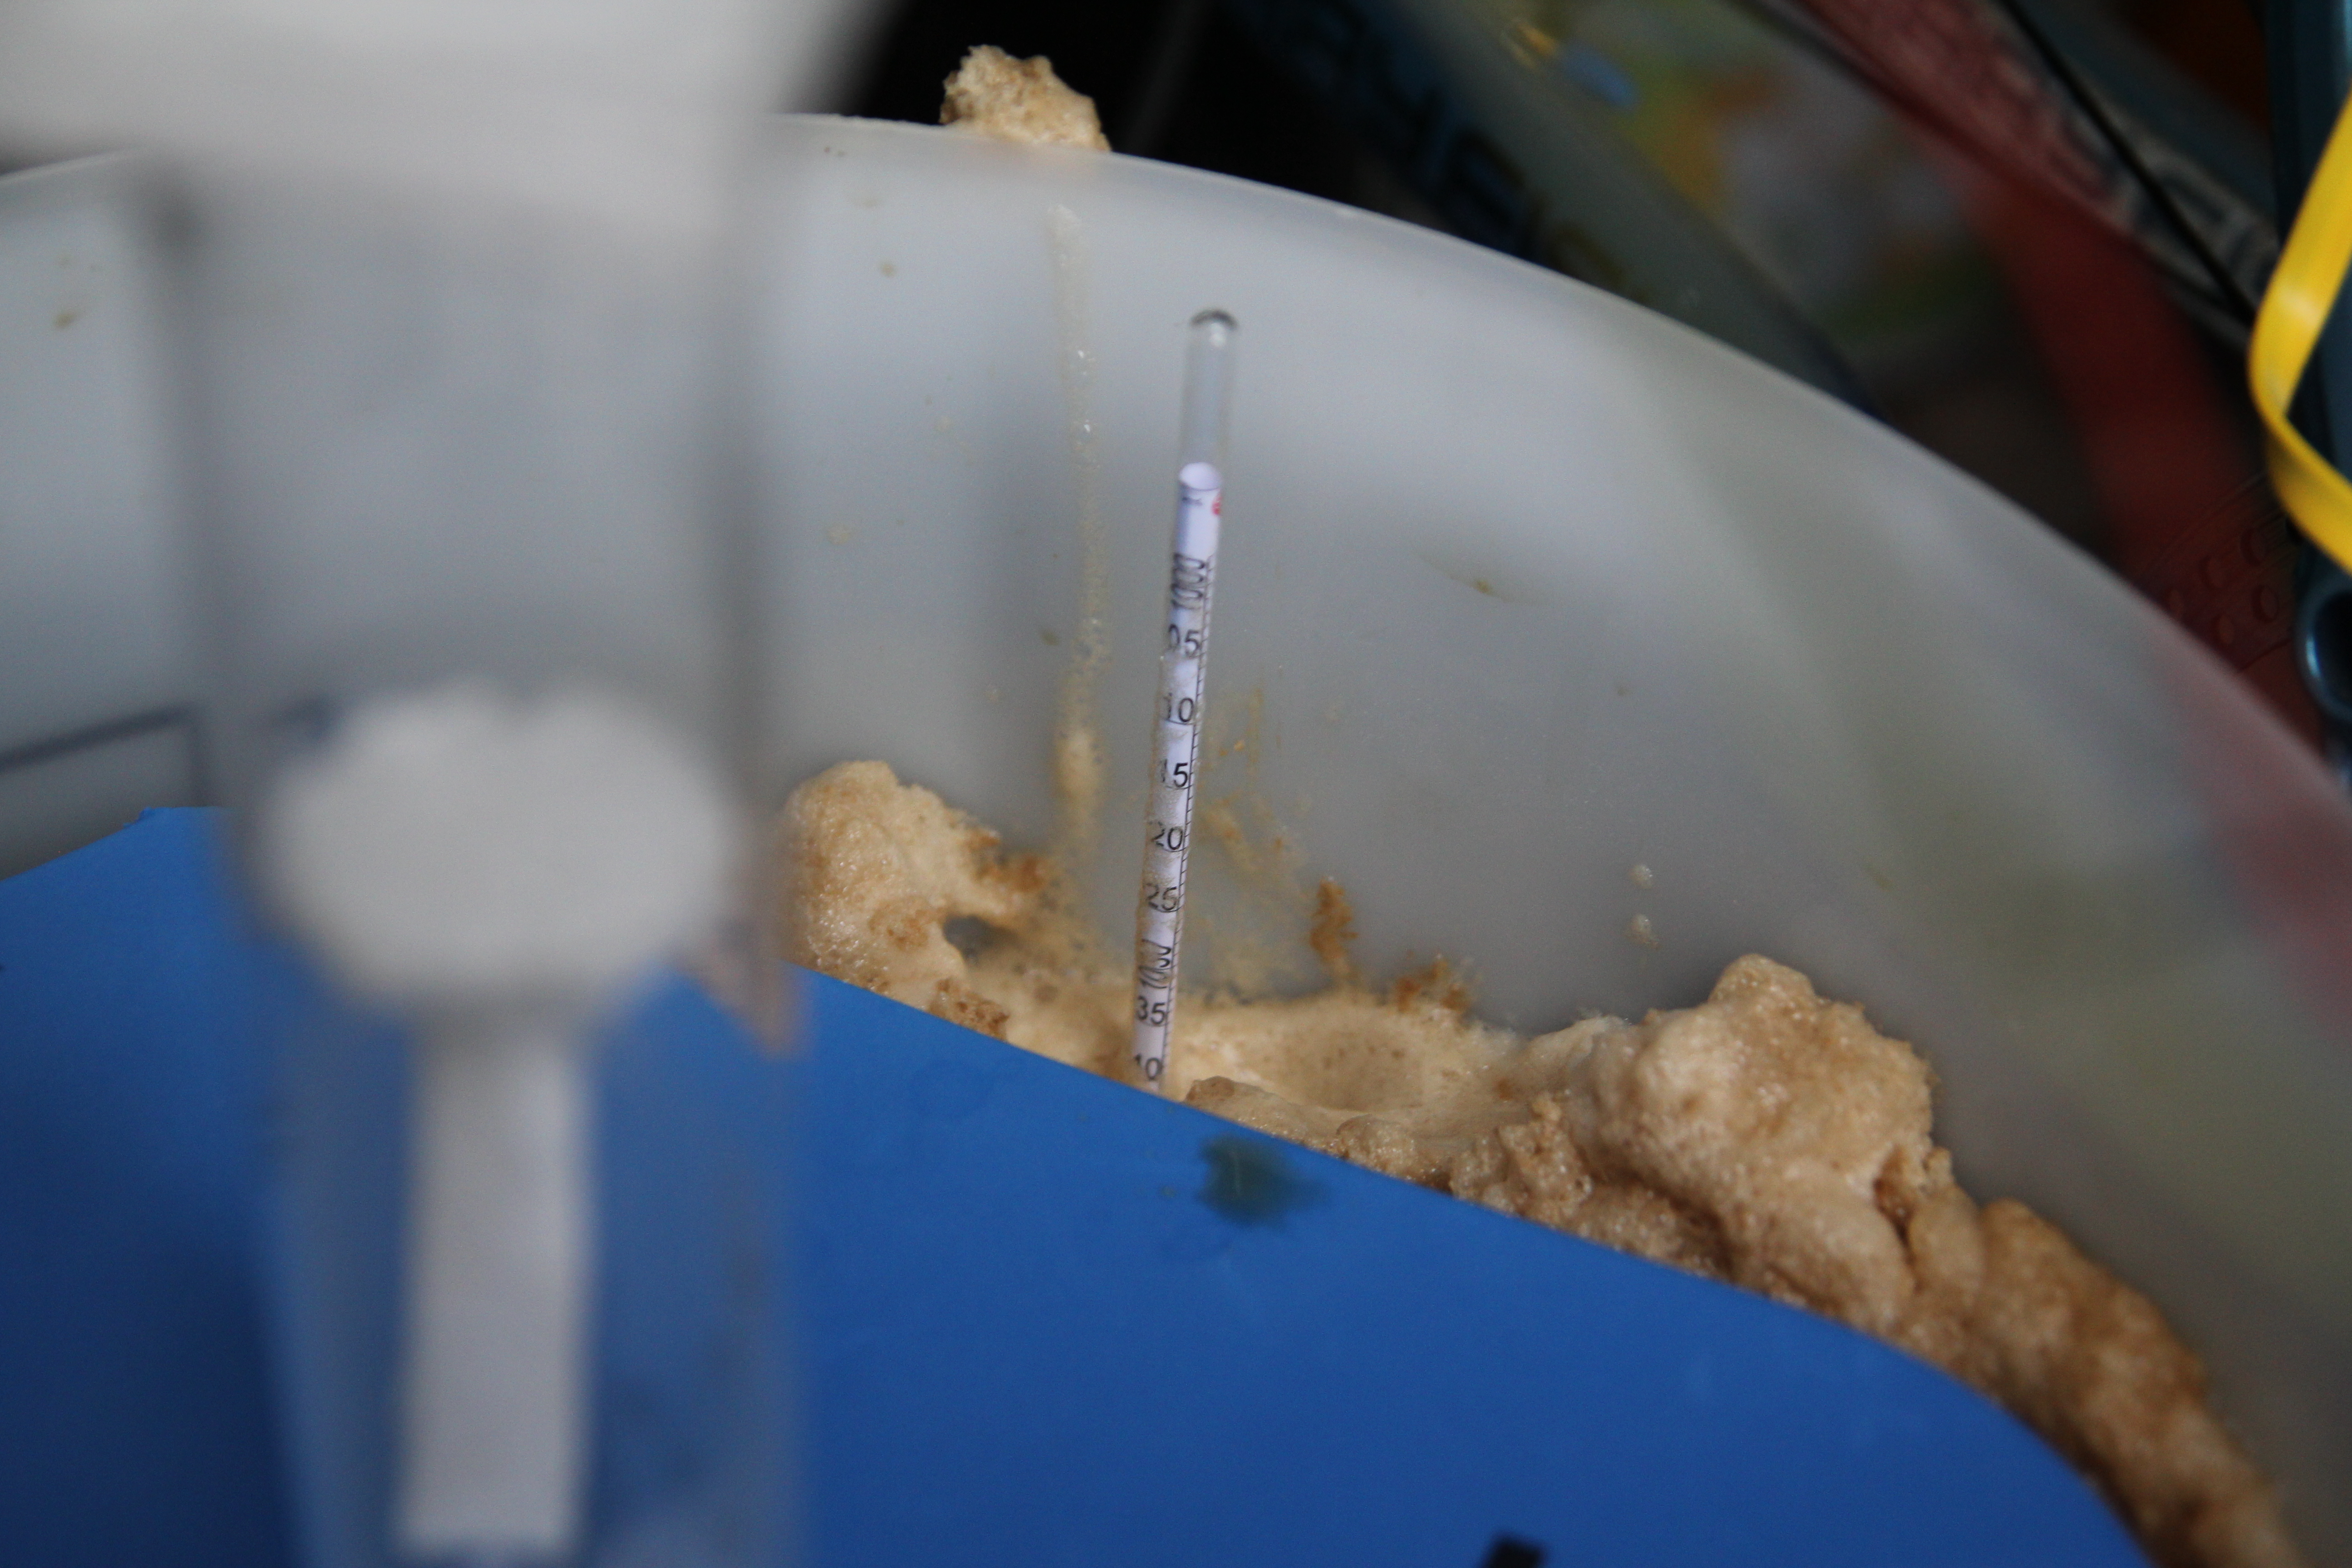
Hydrometer photo taken 28/03/2015 17:00
Calibration
We took 2 points, in order to calibrate our system.
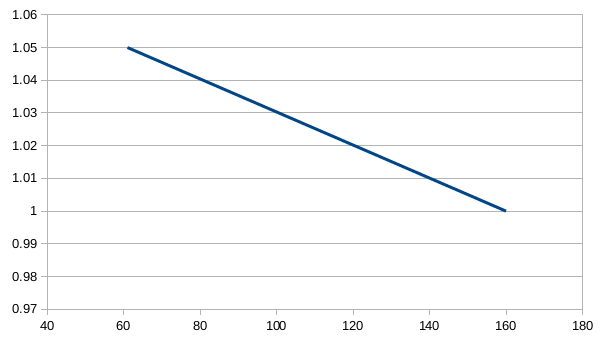
| Distance from ToF (mm) | Measured S.G. |
| 61 | 1.050 |
| 160 | 1.000 |
From these two points, we are able to create a formulae for the line. Which then enables us to convert distances from the ToF sensor to S.G. readings.
y − y1 = m(x − x1)
m = (1-1.05)/(160-61) = -0.0005050505
y - 1.05 = -0.0005050505 (x-61)
y - 1.05 = -0.0005050505*x + 0.0308080805
y =  -0.0005050505*x + 1.0808080805
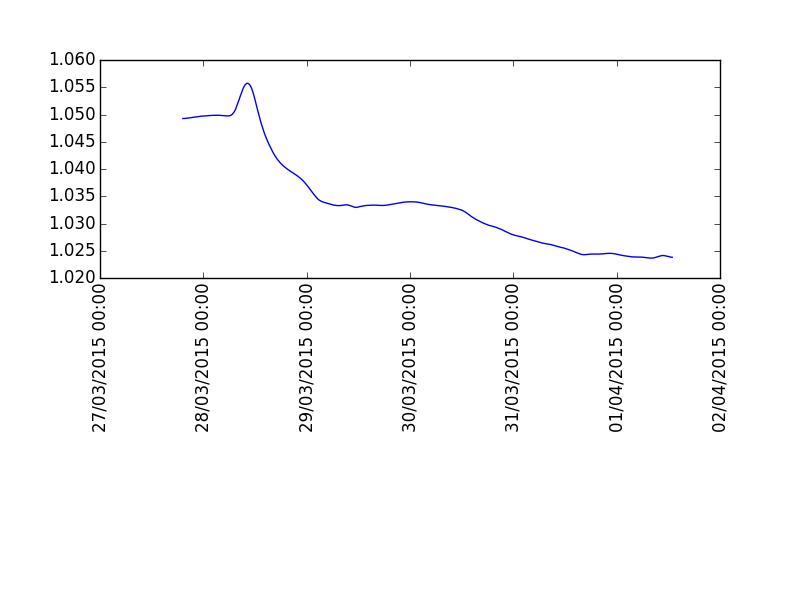
SG graph
You can see a big ‘bump’ in the graph, near the start, which I can only think, is because of the explosion of yeast growth, creating a mass of foam, which pushes up the hydrometer (note that I applied a Gaussian filter to the data, to make the line nice and smooth)
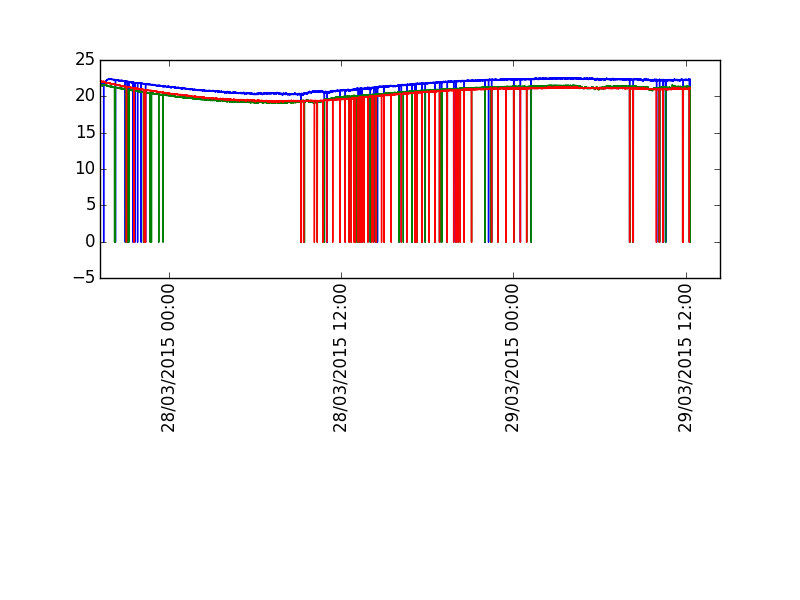
Temp graph
I’m not sure what is causing the glitches, with the 1-wire temperature probes at the moment
Improvements
As the yeast foam seems to effect the displacement, I wonder if there is a way to agitate the top of the beer, to remove the foam around the hydrometer.
As the foam seems to be the issue, could pump a small amount of wort through a filter into another vessel to perform the measurement and then pump back into the main vessel.
Could we just do some jiggery-pokery to remove the ‘bump’ using maths – although that would be a hack.
Also I’m curious to hear of other ideas for this.
Addendum
Please note this is only an experiment, if it was to be used practically I would coat the foam with a plastic such as HDPE to make it sanitary.