This analysis indicates that while there might be a slight tendency for more expensive web hosting services to provide faster load times, the correlation is weak. Therefore, higher prices do not guarantee significantly better performance, and there are economical hosting options that offer competitive speeds.
Putting all this data together; which of the top three hosts would I actually recommend?
Based on all this analysis conducted across several metrics – average load times, price-to-performance ratio (Speed Dollars), consistency in performance, and improvement over time – here are my top recommendations, in two scenarios:
Let’s zoom back out 🔭
Our methodology
Let me give you a bit of backstory first:
I think we started this experiment around 2019. It began rather simple; we just wanted to see who’s faster, Bluehost or SiteGround (we were working on a review). Then we added WP Engine to the mix, and then before we knew it, our portfolio of “unneeded” hosting accounts had grown to 18 in total.
Yes, you read that right. For some reason, we keep paying for 18 different web (and) WordPress hosting accounts and use them for nothing else than “science” purposes to check how fast they actually load and which is the fastest one.
This brings us to today. I figured, why not just show you the results of these tests, the historical spreadsheets, plus some conclusions and considerations on the topic of the fastest WordPress hosting overall?
I used the word “science” there in quotes since what we did wasn’t really science. The experiment started rather organically, with no specific thought process behind it and no big planning. There are certainly some holes in this approach, and feel free to point them out in the comments, but I still think the overall findings might be helpful for those of you interested in this kind of stuff.
Unfortunately, we didn’t track the early numbers when we just had a couple of hosts on record. We only started doing that around 2021, when the lineup was already 12–14.
Here’s how we set up each host and how we do our tests:
We buy each hosting setup independently
We don’t inform the hosting company about what we intend to do. We want to be just regular ol’ customers of each of them.
We also use these setups to write individual reviews for those hosts, so sometimes we buy the entry-level plans, sometimes higher tiers of hosting.
We run a test site on each host
We use WordPress on all our test sites. We install WordPress…well…normally – through the host’s own panel or cPanel. Nothing fancy.
We then make every site look the same:
- All sites use the same theme (Neve) and starter design (see below).
- All sites have the same test content; it’s the stock content of the starter site design.
- All sites also have the same set of popular plugins to add some extra load. Right now, the stack is: All In One WP Security, Templates Patterns Collection (Themeisle’s starter designs), WP Statistics, WPForms, Yoast SEO.
🎨 Click here to see the design:

The idea behind this is that we want these websites to emulate a real website as much as possible. We really didn’t want to just have a simple HTML page with 3B of content on it. In that scenario, each host would probably do a great job loading it in no time.
The homepages of our sites are around 650KB, which, while still not huge, does manage to feature all the common design elements (which you can see in the screenshot above).
Here’s roughly how the individual resources break down:
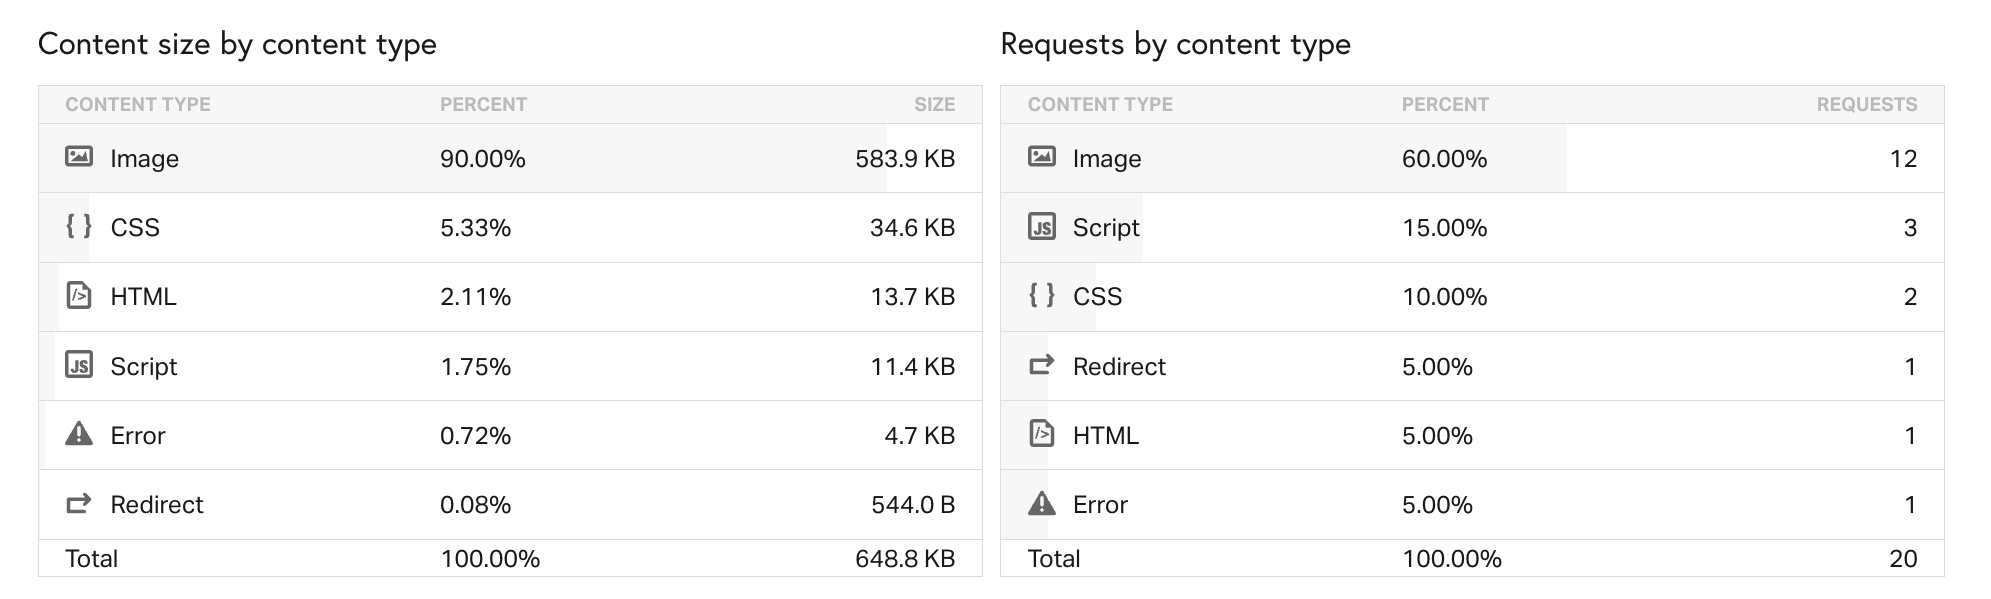
Other important considerations:
- We don’t equalize the settings of the servers. In short, we want to give some benefit to the hosts that go the extra step and try to gain an inch by fine-tuning their server configuration. More or less, we want to make our experience similar to what a normal user’s experience would have been. I’d argue that most users (at least on the entry-level plans) won’t fiddle with a lot of options in their hosting config files.
- We update all the plugins, themes and WordPress core every month.
- And, lastly, sorry, we won’t make the addresses public. We just don’t want the companies (or anyone else) messing with them and skewing the results over time.
What we measure and how
There’s a lot of tools and options to test load times and uptimes of your website, so that’s good, but we had some requirements when picking one:
- We’re interested in the total load time (“time to fully loaded”) of each of our test setups. Metrics like initial response times or FCP times can be misleading and aren’t really representative of an actual user’s experience or perceived speed of the site. That’s why we went the distance and decided to measure the time it takes to load the page entirely.
- We wanted to be able to test the sites from multiple locations around the globe.
- We wanted to emulate an actual web connection and user browser. The idea behind it is that we didn’t want to make it into a lab-like, synthetic experiment.
- We needed to do multiple tests per site and then average out the numbers to get the final “typical” load time. Ideally, in the range of 3-5.
Given the experiment was an organic one, the choice of tools also evolved organically. First, I started doing this with Pingdom Tools totally by hand. Meaning, I clicked through the interface, inputted the site, and picked each location individually. Then repeat. Then repeat.
It was pretty doable somewhere up to the fifth site mark. Above that, I decided to switch to something that can be more automated.
The math just doesn’t work in our favor here…18 sites x 6 locations x 5 runs each. That’s 540 individual tests every month. Have mercy on me; I’m not clicking this through on my own any longer!
There’s just one solution on the web that can deliver all that – WebPageTest. It has an API, plus some interesting open-source scripts available on the web. It’s highly customizable and lets you test your site from basically all over the world.
I’ve experimented with different test locations and parameters over the years, but as of 2024, I’ve gone for what they call a “native” connection (with no traffic shaping*) and used the desktop version of Chrome as the end user environment. We’ve been testing our sites from N.Virginia (USA), California (USA), Utah (USA), London (UK), Paris (France), and Mumbai (India).
* WebPageTest also lets you set up emulated testing for different connections, like cable, DSL, 3G, LTE, and so on, plus all sorts of popular browsers and devices. Truly powerful stuff. Would recommend.
What about uptime?
Oh, right, tracking uptime is much simpler. We picked UptimeRobot for that.
It pays attention to uptime 24/7 and records every second of downtime. It also gives us one year of history, plus those cool status pages for each of the hosts. Plus, we put the older numbers in a separate spreadsheet not to lose any data older than one year.
I’m only mentioning this for context. Uptime doesn’t have much to do with site speed, but I thought some of you would be interested to see this as well. Feel free to go to our status page and see up to a year of history for each host.
👉 Note; Here’s an in-depth breakdown of our methodology, testing sites, server locations, and all the steps that lead us to our data findings.
We’re finally reaching the end here. What do you think of the results of this ongoing experiment of ours? Speak up in the comments below.