Newly released data series from the Bureau Economic Analysis have revealed a pretty eye-popping economic reality that’s been invisible in the national accounts…forever. Subtract households’ Personal Taxes and Personal Outlays from Personal Income to yield Personal Saving, and it turns out that the bulk of U.S. households don’t save. Quite the contrary: the bottom 80% spends more than its income, year in and year out. Only the top 20% consistently saves.1
This reality was invisible before publication of the Distribution of Personal Income Accounts (here, the “DPIAs”), first released in December 2020 and now in its fourth (greatly improved) prototype version, released December 2023. It provides breakdowns of Personal Income and Personal Taxes by income deciles — top 10%, next 10%, etc. — currently for twenty-two years 2000 through 2021.2 The situation revealed in this post was simply invisible before the DPIAs were released.

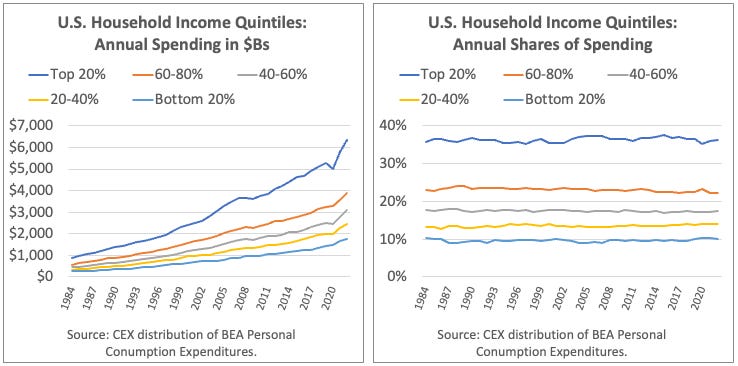
Meanwhile the BLS Consumer Expenditure Survey (CEX) provides income-quintiles’ annual spending shares, going back to 1984.3
Subtract an income-quintile’s outlays (spending and consumer-interest payments) from disposable income, and you’ve got Personal Saving for that quintile group. Divide that by disposable income, and you get the standard-issue Personal Saving Rate.

What in the actual hell? How can households maintain a spending deficit over decades, without running out of assets to spend? Spending is transferring assets to firms (mostly), in exchange for newly-produced goods and services. If you don’t have assets, you can’t spend.
The answer lies in the first footnote here. Personal Income isn’t the only source of household assets. The two big missing pieces are holding (capital) gains on assets, and borrowing (which adds both assets and liabilities, in equal amounts, to household balance sheets). Adding these two additional measures does shift most bottom quintiles from spending deficits to asset surpluses in most years.
Bottom-80% borrowing and and holding gains, as a percent of bottom-80% household-spending deficits. Post-GFC, pre-covid years.

While many have suggested that borrowing is what explains households’ ability to keep spending (it is, some), overwhelmingly it’s holding gains that “fund” the perennial dissaving of the bottom 80%.
For those who’d like more details, here’s a pared-down version of the spreadsheet that includes the data and graphs (but not all the derivations of that data). A new, full version of this paper and spreadsheet will be available in the next few weeks, incorporating all the latest national accounting data and multiple other improvements.
As always, comments, questions, and corrections from my gentle readers are greatly appreciated.