Depending on where you live, property taxes can be anything from a minor annoyance to a significant financial strain. The average U.S. household pays $3,119 per year in property taxes on their home, according to the U.S. Census Bureau, and residents in the 26 states that levy vehicle property taxes pay an additional $499 annually.
While property taxes may seem irrelevant to the 35% of households that rent, that assumption misses the mark. Whether paid directly or indirectly, nearly everyone bears the cost of property taxes, as they influence rental prices and help fund state and local governments.
So which states place the heaviest property tax burden on residents, and what should taxpayers know about managing and potentially reducing what they owe? To find out, we examined real estate and vehicle property taxes across all 50 states and the District of Columbia, and consulted a panel of property-tax experts for both practical guidance and policy insight.

“Some states charge no property taxes at all, while others charge an arm and a leg. Americans who are considering moving and want to maximize the amount of money they take home should take into account property tax rates, in addition to other financial factors like the overall cost of living, when deciding on a city.”
Chip Lupo, WalletHub Analyst
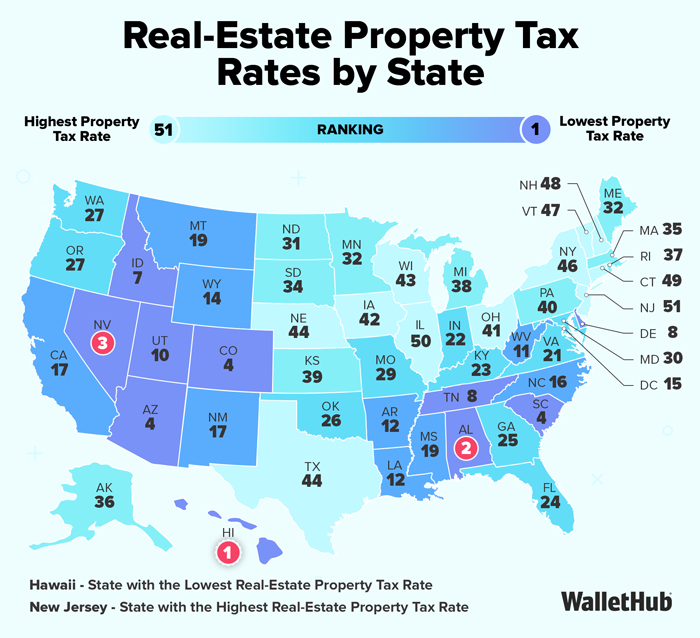
Real-Estate Tax Ranking
Real-Estate Property Tax Rates by State
|
Rank |
State |
Effective Real-Estate Tax Rate |
Annual Taxes on $332.7K Home* |
State Median Home Value |
Annual Taxes on Home Priced at State Median Value |
|---|---|---|---|---|---|
| 1 | Hawaii | 0.27% | $888 | $839,100 | $2,239 |
| 2 | Alabama | 0.38% | $1,249 | $209,900 | $788 |
| 3 | Nevada | 0.47% | $1,549 | $435,400 | $2,027 |
| 4 | Arizona | 0.48% | $1,585 | $394,500 | $1,879 |
| 4 | Colorado | 0.48% | $1,605 | $539,400 | $2,602 |
| 4 | South Carolina | 0.48% | $1,607 | $259,000 | $1,251 |
| 7 | Idaho | 0.49% | $1,620 | $418,600 | $2,038 |
| 8 | Delaware | 0.50% | $1,671 | $352,000 | $1,768 |
| 8 | Tennessee | 0.50% | $1,673 | $286,700 | $1,442 |
| 10 | Utah | 0.52% | $1,717 | $489,400 | $2,525 |
| 11 | West Virginia | 0.53% | $1,770 | $162,600 | $865 |
| 12 | Louisiana | 0.55% | $1,813 | $216,500 | $1,180 |
| 12 | Arkansas | 0.55% | $1,840 | $188,000 | $1,040 |
| 14 | Wyoming | 0.57% | $1,898 | $309,700 | $1,767 |
| 15 | District of Columbia | 0.58% | $1,946 | $737,100 | $4,312 |
| 16 | North Carolina | 0.66% | $2,183 | $288,900 | $1,896 |
| 17 | New Mexico | 0.70% | $2,321 | $248,100 | $1,731 |
| 17 | California | 0.70% | $2,320 | $734,700 | $5,124 |
| 19 | Montana | 0.72% | $2,384 | $375,800 | $2,693 |
| 19 | Mississippi | 0.72% | $2,381 | $169,800 | $1,215 |
| 21 | Virginia | 0.73% | $2,419 | $383,700 | $2,790 |
| 22 | Indiana | 0.74% | $2,461 | $218,200 | $1,614 |
| 23 | Kentucky | 0.75% | $2,498 | $205,600 | $1,544 |
| 24 | Florida | 0.76% | $2,530 | $359,000 | $2,730 |
| 25 | Georgia | 0.77% | $2,568 | $303,300 | $2,341 |
| 26 | Oklahoma | 0.80% | $2,663 | $199,800 | $1,599 |
| 27 | Oregon | 0.81% | $2,700 | $477,600 | $3,876 |
| 27 | Washington | 0.81% | $2,685 | $564,600 | $4,556 |
| 29 | Missouri | 0.85% | $2,814 | $230,300 | $1,948 |
| 30 | Maryland | 0.97% | $3,243 | $419,900 | $4,093 |
| 31 | North Dakota | 0.99% | $3,286 | $249,900 | $2,468 |
| 32 | Minnesota | 1.02% | $3,392 | $329,300 | $3,357 |
| 32 | Maine | 1.02% | $3,406 | $296,600 | $3,036 |
| 34 | South Dakota | 1.06% | $3,521 | $257,400 | $2,724 |
| 35 | Massachusetts | 1.07% | $3,547 | $562,100 | $5,992 |
| 36 | Alaska | 1.11% | $3,678 | $352,900 | $3,901 |
| 37 | Rhode Island | 1.21% | $4,033 | $404,200 | $4,900 |
| 38 | Michigan | 1.25% | $4,172 | $231,600 | $2,904 |
| 39 | Kansas | 1.29% | $4,286 | $217,200 | $2,798 |
| 40 | Pennsylvania | 1.30% | $4,328 | $254,500 | $3,311 |
| 41 | Ohio | 1.31% | $4,371 | $214,800 | $2,822 |
| 42 | Iowa | 1.39% | $4,634 | $208,000 | $2,897 |
| 43 | Wisconsin | 1.42% | $4,734 | $266,500 | $3,792 |
| 44 | Texas | 1.49% | $4,961 | $283,800 | $4,232 |
| 44 | Nebraska | 1.49% | $4,949 | $238,600 | $3,549 |
| 46 | New York | 1.55% | $5,167 | $423,800 | $6,582 |
| 47 | Vermont | 1.59% | $5,295 | $316,600 | $5,039 |
| 48 | New Hampshire | 1.66% | $5,511 | $402,500 | $6,667 |
| 49 | Connecticut | 1.81% | $6,024 | $366,900 | $6,643 |
| 50 | Illinois | 2.01% | $6,694 | $263,300 | $5,298 |
| 51 | New Jersey | 2.11% | $7,022 | $454,400 | $9,590 |
*$332,700 is the median home value in the U.S. as of 2024, the year of the most recent available data.
Changes to Real-Estate Tax Rates Over Time

Red States vs Blue States

Vehicle Property Tax Ranking
Vehicle Property Tax Rates by State
|
Rank |
State |
Effective Vehicle Tax Rate |
Annual Taxes on $29.1K Car* |
|---|---|---|---|
| 1 | Hawaii | 0.00% | $0 |
| 1 | Idaho | 0.00% | $0 |
| 1 | Delaware | 0.00% | $0 |
| 1 | Tennessee | 0.00% | $0 |
| 1 | Utah | 0.00% | $0 |
| 1 | District of Columbia | 0.00% | $0 |
| 1 | New Mexico | 0.00% | $0 |
| 1 | Florida | 0.00% | $0 |
| 1 | Georgia | 0.00% | $0 |
| 1 | Oklahoma | 0.00% | $0 |
| 1 | Oregon | 0.00% | $0 |
| 1 | Washington | 0.00% | $0 |
| 1 | Maryland | 0.00% | $0 |
| 1 | North Dakota | 0.00% | $0 |
| 1 | South Dakota | 0.00% | $0 |
| 1 | Alaska | 0.00% | $0 |
| 1 | Rhode Island | 0.00% | $0 |
| 1 | Pennsylvania | 0.00% | $0 |
| 1 | Ohio | 0.00% | $0 |
| 1 | Wisconsin | 0.00% | $0 |
| 1 | Texas | 0.00% | $0 |
| 1 | New York | 0.00% | $0 |
| 1 | Vermont | 0.00% | $0 |
| 1 | Illinois | 0.00% | $0 |
| 1 | New Jersey | 0.00% | $0 |
| 26 | Louisiana | 0.10% | $29 |
| 27 | Michigan | 0.61% | $178 |
| 28 | California | 0.65% | $189 |
| 29 | Alabama | 0.70% | $203 |
| 30 | Iowa | 1.00% | $291 |
| 31 | Arkansas | 1.02% | $297 |
| 32 | North Carolina | 1.10% | $319 |
| 33 | Montana | 1.13% | $329 |
| 34 | Indiana | 1.20% | $350 |
| 35 | Kentucky | 1.44% | $420 |
| 36 | Minnesota | 1.58% | $458 |
| 37 | West Virginia | 1.66% | $484 |
| 38 | Arizona | 1.68% | $489 |
| 39 | Colorado | 1.79% | $519 |
| 40 | Wyoming | 1.80% | $524 |
| 40 | New Hampshire | 1.80% | $524 |
| 42 | Kansas | 1.93% | $561 |
| 43 | Connecticut | 2.07% | $602 |
| 44 | Nevada | 2.12% | $617 |
| 45 | Massachusetts | 2.25% | $655 |
| 46 | Nebraska | 2.27% | $660 |
| 47 | South Carolina | 2.33% | $678 |
| 48 | Maine | 2.40% | $698 |
| 49 | Missouri | 2.55% | $743 |
| 50 | Mississippi | 3.42% | $996 |
| 51 | Virginia | 3.97% | $1,156 |
*$29,100 is the value of a Toyota Camry LE four-door Sedan (as of January 2026), the highest-selling car of 2025.
Ask the Experts
Property taxes are an extremely important issue since they impact all of our lives. But how should we incorporate them into our financial decision making? And how should policy makers across the U.S. approach them as well? For answers to those questions and more, we consulted a panel of tax and public-policy experts. You can check out their bios and responses to key questions below.
- Do people consider property taxes when deciding where to move? Should they?
- Should nonprofits pay property taxes?
- Should local tax policy be adjusted to rely more or less on property taxes versus other forms of taxation?
- Should more types of property be subject to property taxes? If yes, what types?
- Should certain groups of people be exempt from property taxes or be taxed at a lower rate?
Dr. Mitchell Franklin
Ph.D., CPA, Distinguished Jack Collins '60 Chair in Accounting, Professor of Accounting, Madden College of Business and Economics - Le Moyne College
Read More
Xu Jiang
Ph.D., Associate Professor of Business Administration - Duke University, Fuqua School of Business
Read More
Matthew T. Phillips
JD, Exxon-Calloway Faculty Fellow; Teaching Professor, Wake Forest University, School of Business
Read More
M. Brett Jensen
Adjunct Lecturer, Economics and Finance, Jon M. Huntsman School of Business - Utah State University and founding member of Ensign Development Group
Read More
Dr. Karen Kunz
Associate Professor Emerita, West Virginia University
Read More
Dr. Desen Lin
Assistant Professor of Finance at California State University, Fullerton
Read More
More Experts
Methodology
In order to determine the states with the highest and lowest property taxes, WalletHub compared the 50 states and the District of Columbia by using U.S. Census Bureau data to determine real-estate property tax rates and applying assumptions based on national auto-sales data to determine vehicle property tax rates.
For real-estate property tax rates, we divided the “median real-estate tax payment” by the “median home price” in each state. We then used the resulting rates to obtain the dollar amount paid as real-estate tax on a house worth $332,700, the median value for a home in the U.S. as of 2024 according to the Census Bureau.
For vehicle property tax rates, we examined data for cities and counties making up at least 50 percent of a given state’s population and extrapolated this to the state level using weighted averages based on population size. For each state, we assumed all residents own the same vehicle: a Toyota Camry LE four-door sedan — 2025’s highest-selling car — valued at $29,100, as of January 2026.
Please note that Georgia formerly imposed vehicle property tax but replaced it in 2013 with a one-time tax imposed on a vehicle’s fair market value (FMV).
Sources: Data used to create this ranking were collected as of January 29, 2026 from the U.S. Census Bureau and each state’s Department of Motor Vehicles.