Open Source Observability
with Traces, Metrics, and Logs
Scalable and affordable OpenTelemetry-based observability platform that helps you monitor, understand, and optimize complex distributed systems. Think of DataDog or NewRelic, but at a fraction of the cost.
App Performance Monitoring
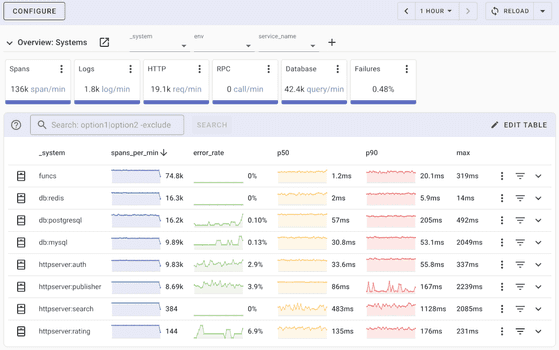
Monitor your entire application stack on one compact and informative dashboard. You get a quick overview for all your services, hosts, and systems.
- Service graph with service relationships.
- RED metrics: rate, errors, and duration.
- Percentiles: p50/p90/p99/max latency.
- Most popular logs and errors.
- Slowest requests.
Checking the status of your app has never been easier.
Trusted by Engineers Worldwide
Since 2020, Uptrace has been the reliable choice for observability and monitoring, helping teams gain insights from their applications with ease and precision.
1000+Active Installations
"Uptrace completely changed how we track and debug our services. We replaced a platform that cost 5x more, and the OpenTelemetry setup took just minutes."
Emily Chen
Engineering Manager at BrightPath
"As we scaled to hundreds of microservices, other tools became too complex and expensive. Uptrace gives us the same capabilities at a fraction of the price."
David Miller
CTO at NovaWorks
"The clarity Uptrace brings to our distributed system is incredible. We uncovered performance issues we didn’t even realize were slowing us down."
Priya Sharma
Head of Platform at SkyForge
Get 1TB free storage and 100,000 timeseries No card required
Choose Your Deployment
Multiple deployment options to fit your organization's needs and infrastructure
Use the Cloud version
Get started immediately with zero infrastructure management using Uptrace Cloud.
No installation required:
Sign up at app.uptrace.dev to get your account set up in minutes.
Key benefits
Zero infrastructure management
Automatic updates and maintenance
Scalable with predictable pricing
Enterprise-grade security and reliability
Why Uptrace?
All-in-one solution
Uptrace offers an integrated experience for traces, metrics, and logs, eliminating the need to manage multiple tools.
Uptrace works at any scale and can accept data from OpenTelemetry, Prometheus, Vector, FluentBit, CloudWatch, and more.
Cloud or Self-hosted
You can download Uptrace from GitHub and host it yourself for free without any limitations.
If you don't want to manage Uptrace yourself, you can use Uptrace Cloud or request an on-premise installation.
Predictable pricing
You pay for the number of ingested gigabytes and active timeseries. There are no hidden fees.
The price is calculated at the end of the month and it will never exceed the budget you set after creating your account.
Cloud Self-hosted Managed
Get started with OpenTelemetry in minutes
Convenience
OpenTelemetry provides high-quality instrumentation libraries that allow you to get started with little to no code changes.
Flexibility
OpenTelemetry is open source and free, which allows you to easily try different vendors without changing the instrumentation.
Efficiency
OpenTelemetry is designed to be lightweight and introduces minimal performance overhead when configured correctly.
Get up to 10x more value with Uptrace
Predictable pricing
No hidden fees
First month is free
Cancel any time
150 Engineers
225 APM Hosts (10TB)
20TB Logs Ingest
350 Infra Hosts (750k timeseries)
Monthly Full-Stack Observability Costs
$0$10K$20K$30K$40K$50K$60K$70K$80K
Same reliability Same performance 80% less cost