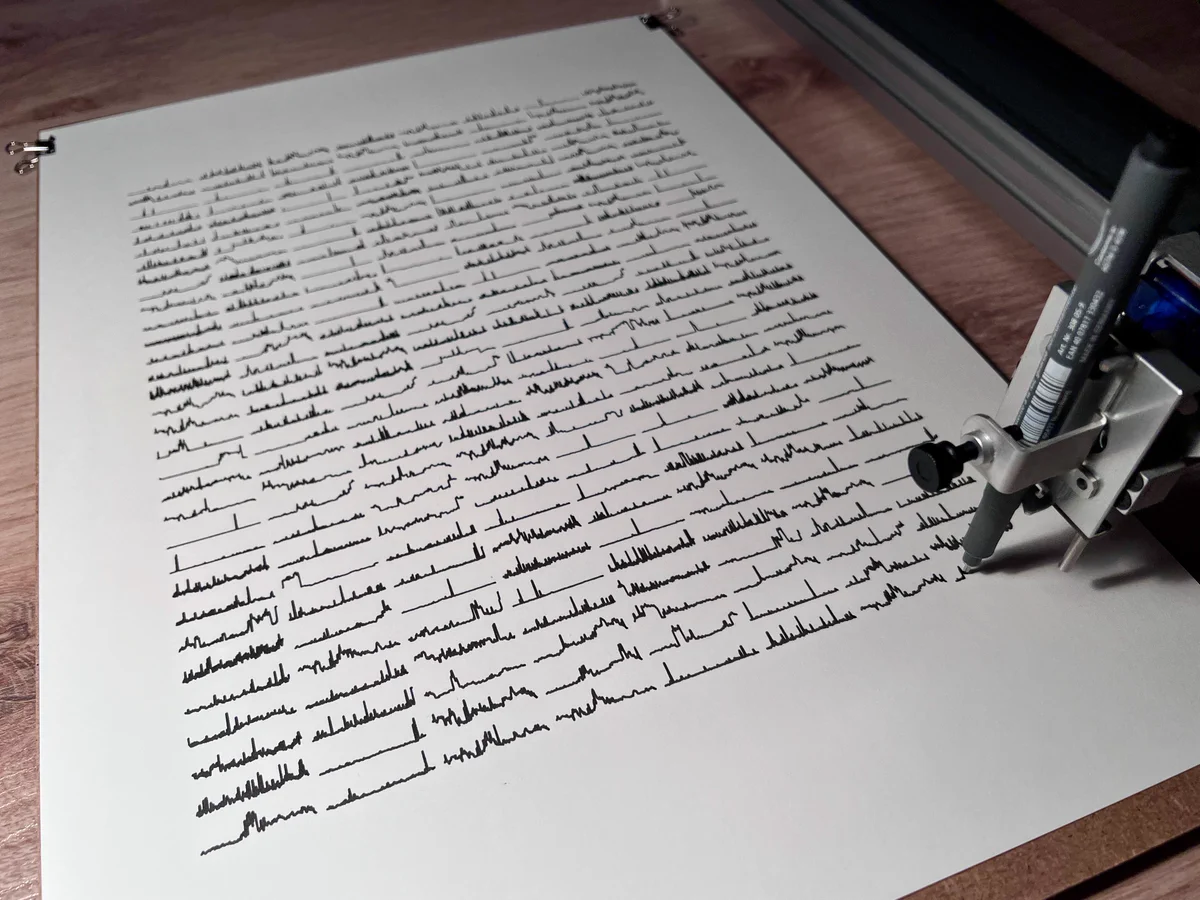
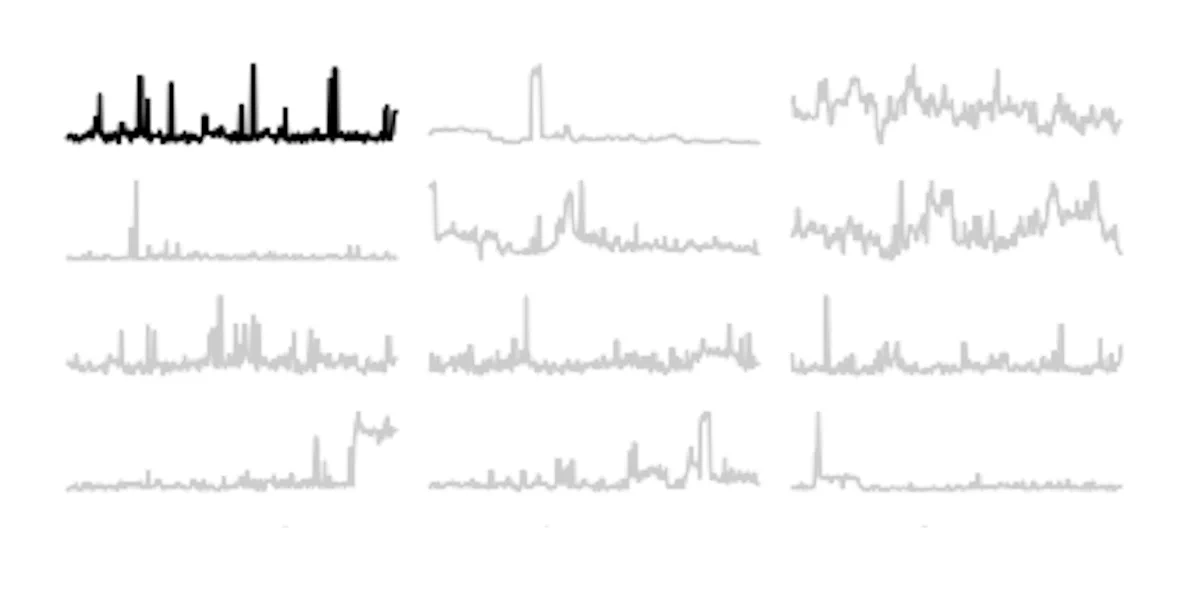
What happened to the Internet in 2021 in one print. The print depicts the number of routing announcements observed by 256 Internet routers throughout the year. (One sparkline per router) Together these routers observed >97 billion (!) BGP announcements. #plottertwitter #YearinBGP
Post
Post
Laurent Vanbever / @[email protected] on X: "What happened to the Internet in 2021 in one print. The print depicts the number of routing announcements observed by 256 Internet routers throughout the year. (One sparkline per router) Together these routers observed >97 billion (!) BGP announcements. #plottertwitter #YearinBGP"
Short video (oddly satisfying, at least to me) on how it is made. (I'm using a #axidraw v3/a3 plotter):

I've uploaded the raw data here polybox.ethz.ch/index.php/s/2S… Each line contains the hourly number of advertisements seen over one BGP session (there are 1948 sessions). The session ID is the first element of each line. I only considered lines with 365 days worth of data and no zeroes.