From a product perspective, today’s self driving cars are essentially premium, driverless taxis. But marketing, publicity, and advocacy have one specific focus - safety. Advocacy is usually based on improved accident rates, and the corresponding potential to reduce traffic fatalities ( 40,000 annual in the United States alone). And the metrics from Waymo are compelling, with about an 80%-90% reduction in crashes vs human drivers. But how should we interpret these numbers to understand the actual impact to transportation safety? Are self-driving cars the key to improvement, and if so, shouldn’t it just be a public service?
Current safety reporting compares the crash rates of self-driving cars vs. human-driven cars. This comparison is necessary to inspire confidence in the product, and does show some movement in a positive direction. But because it focuses only on the “driver” of cars (robot vs human), it is insufficient for understanding if self-driving cars are an efficient path to improved safety.
To demonstrate, I analyze the number of traffic incidents prevented by both Waymo and BART in San Francisco. The point of this exercise is not to compare Waymo and BART as if they are mutually exclusive transit alternatives, but rather to show one example of what is missed by the narrow focus on self-driving car crash statistics.
Traffic incidents must be measured on a per passenger mile traveled basis if analyzing impact to road safety. Waymo metrics are based on vehicle miles traveled, which overstates safety impact by ignoring deadheading.
After adjusting for passenger miles traveled, Waymo has ~65% lower incident rate than human drivers.
Waymo has ~10x higher incident rate than BART.
BART prevents ~30x more moderate injuries than Waymo. Even if Waymo held 100% of the rideshare market, BART would still have a significantly greater impact on safety.
Self-driving cars have a positive impact on safety that will grow over time, and any positive impact is meaningful. But self-driving cars alone are not the most efficient path to minimizing traffic incidents. They should be a piece of the transportation network, but the backbone should be high-capacity public transit (along with non-technical safety measures). But while BART and other transit systems need to be recognized for their safety impact, the unfortunate reality is that they face budget crises and prohibitively expensive expansions.
Developing economically sustainable transit has proven to be as challenging as developing self-driving cars, but if reducing traffic incidents is a true societal priority, advocacy efforts and resources should be more focused on increasing public transit ridership.
Waymo’s core reporting is based on Incidents per Million Miles (IPMM), where the miles measured are Rider-Only, defined as “miles that Waymo has driven without a human driver — in cities where we operate our ride-hailing service”. Waymo’s safety studies indicate Rider-Only miles include both driving to passenger pickup (deadheading), and driving passengers to their destination, so we can think of IPMM as incidents per Vehicle Miles Traveled (VMT).
A more meaningful metric is incidents per Passenger Miles Traveled (PMT), where passenger miles are the total distance that passengers travel. As an example, if a vehicle drives 1 mile to pick up 2 passengers, then drives them 2 miles to their destination, then the vehicle incurs 3 VMT (1 deadhead + 2 occupied), and 4 PMT (2 passengers * 2 miles). There are two reasons to use PMT over VMT:
Incidents per PMT is a better indicator of actual crashes that will occur on the road, and therefore a better measure of overall road safety
Incidents per PMT can be normalized across different vehicle sizes and modes of transportation, enabling comparison across cars, buses, and trains.
Consider a simple example to demonstrate (1). A fictional rideshare company, ZoomRide, completes the same number PMT (10 million) as personally-owned cars in some geographic area. ZoomRide claims that their drivers crash half as frequently as other drivers. But does that make the roads safer?
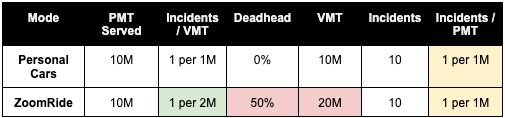
While ZoomRide drivers crash half as frequently than the average driver (once every 2 million VMT), ZoomRide is involved in just as many incidents (10 incidents) due to extra deadheading miles. Incidents per PMT adjusts for deadheading, making it a better indicator of actual crashes that occur in an area. As a pedestrian or driver, that’s the number I care more about.
(Note: If an accident occurs during Waymo deadheading, no passengers in the Waymo vehicle will be injured. However, any incident while deadheading likely involves another car with a passenger, or potentially a pedestrian.)
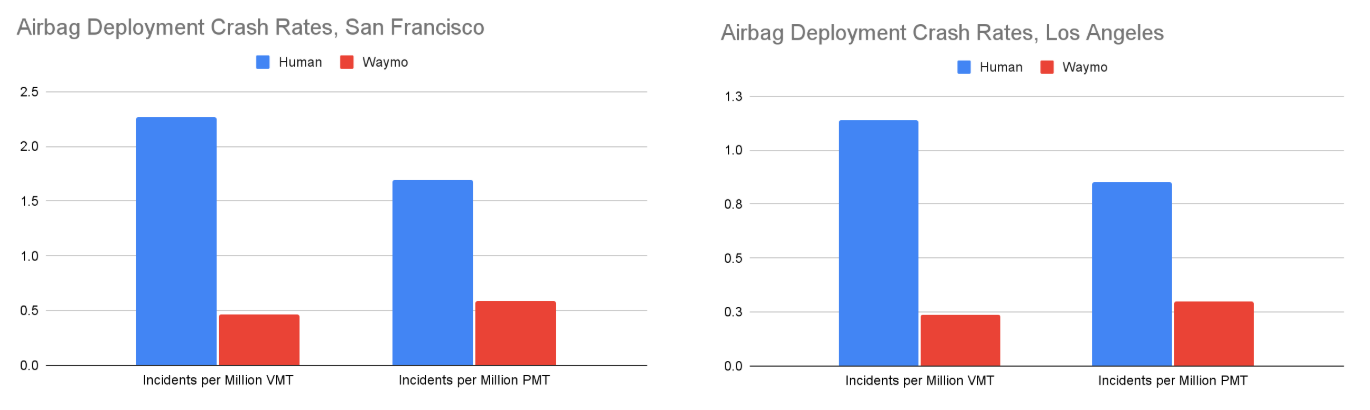
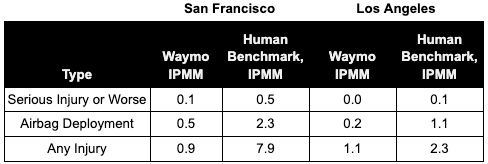
Figures 2 and 3 show the impact of adjusting Waymo’s “Airbag Deployment” incident rate to Incidents per Million PMT (IPMPM). In San Francisco, Waymo has 79% lower IPMM, but 65% lower IPMPM.
Figures 4 - 6 summarize Waymo’s core safety reporting metrics using IPMPM. The incident categories (e.g. “Serious Injury or Worse”) are from Waymo’s safety reporting and defined later in this article.


While the gap between Waymo and humans is narrowed by switching from IPMM to IPMPM, Waymo still performs better than their human benchmarks, especially for more serious incidents. It indicates that replacing human drivers one-for-one with Waymo should improve road safety (increasing car VMT via deadheading has other consequences, but those are not the focus of this analysis).
With the new IPMPM metric calculated, we can compare to public transit.
The following analysis quantifies the safety impact of Waymo and BART by estimating the number of injuries prevented by passengers riding each respective mode, assuming they would have otherwise taken a human-driven car. There are 3 steps:
Incident type comparison: Define which safety incidents to compare between Waymo and BART
Incident rate comparison: Estimate the incident rate between Waymo and BART using the incidents defined in (1)
Injury prevention count comparison: Estimate the number of injuries prevented by Waymo and BART using the rate calculated in (2)
Waymo does not include transit benchmarks (nor should we expect them to), so it is challenging to make a perfect comparison. Using BART safety reporting to the FTA and Waymo safety reporting to NHTSA we can create the following incident categories:
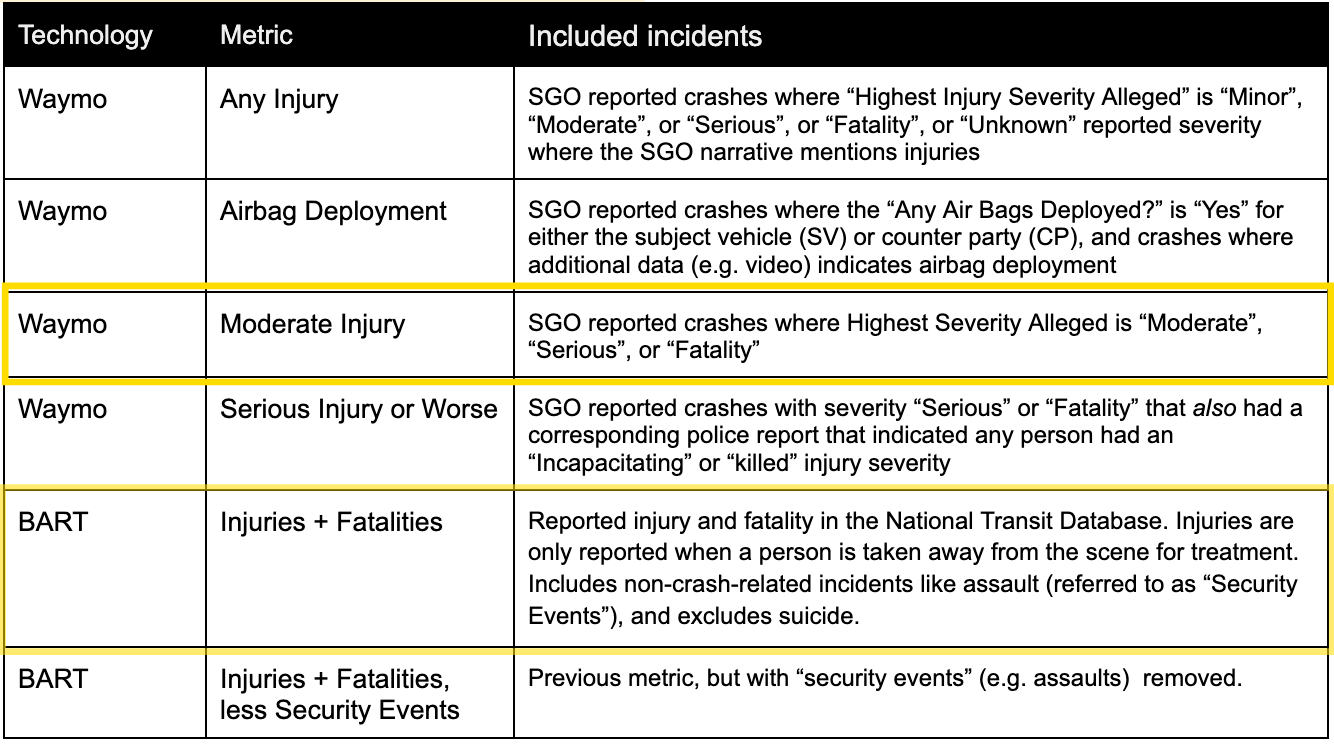
Based on my reading of reporting requirements, the best comparison is Waymo’s “Moderate Injury” rate to BART “Injuries + Fatalities”. BART reports incidents if someone is transported for treatment, and therefore undercounts relative to Waymo’s “Any Injury” and “Airbag Deployed”. However, BART reports more incidents than would be included in the Waymo “Serious Injury or Worse” bucket.
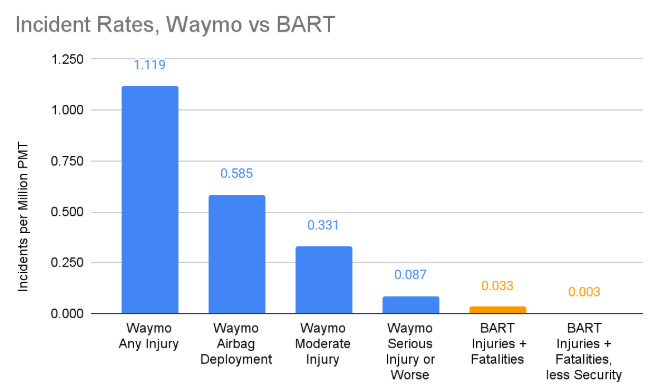
Figure 8 displays the IPMPM for each incident category. Waymo’s Moderate Injury rate (0.331 IPMPM) is ~10x higher than BART’s Injuries + Fatalities (0.033 IPMPM). Even if “serious injury or worse” is compared to BART injuries, the Waymo incident rate is still 2.6x higher. It is also worth noting that the majority of injuries on BART are not related to the transportation of passengers, but instead are “personal security” events like assault.
Rates are useful for performance benchmarking, but how many injuries do Waymo and BART prevent? To measure the actual impact on overall transportation safety, capacity and ridership must be considered.
Figure 9 estimates the safety impact of Waymo and BART, measured by Moderate Injury Prevention. This analysis combines the incident rates calculated previously, with the number of Passenger Miles that Waymo and BART provide in each given scenario. Scenario 1a can be thought of as Waymo’s current impact, and 2a the max potential impact if all of rideshare was driverless. Scenario 2a approximates the injuries prevented by BART in San Francisco, and 2b shows the injuries prevented across the entire BART system
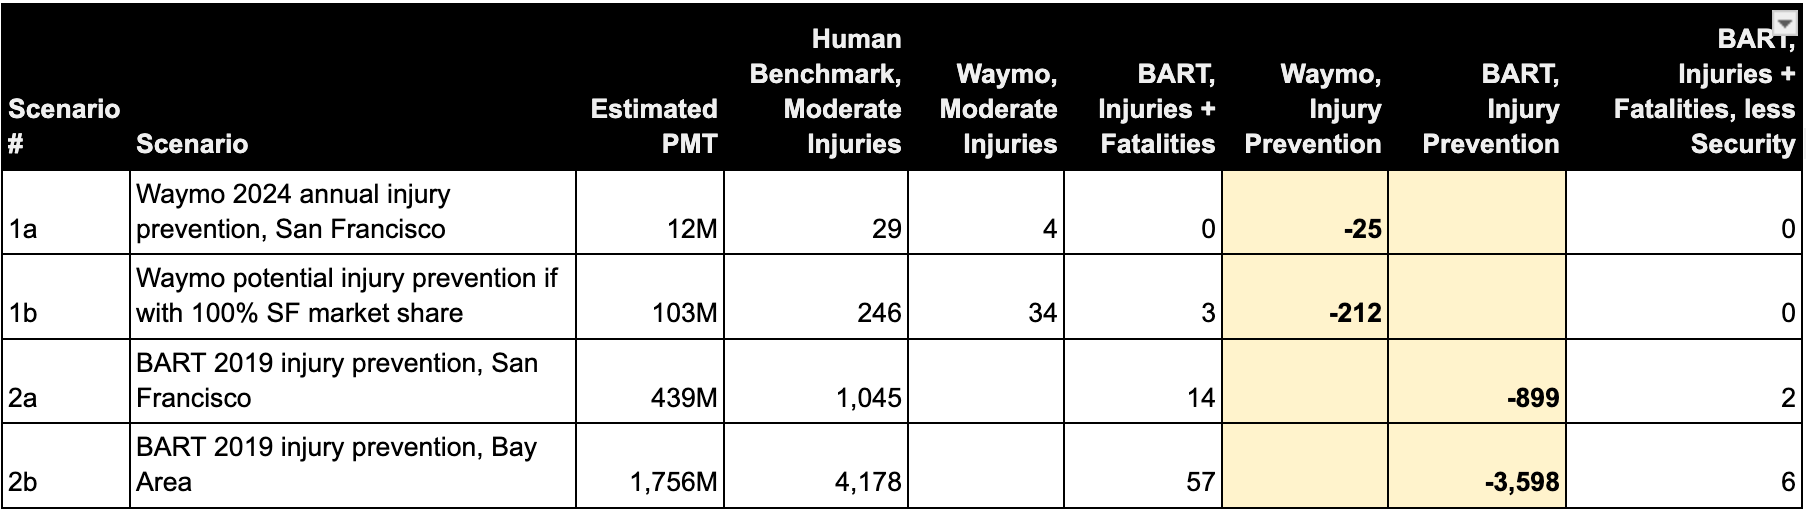
In 2019, BART prevented ~900 moderate injuries in San Francisco, while Waymo prevented ~25 in 2024. Even if Waymo had 100% rideshare market share, it would only have ¼ the safety impact of BART.
There are oversimplifying assumptions in these numbers. Two (non-exhaustive) examples - it assumes that all passengers’ alternative mode would be personal cars instead of things like walking, biking, or bus. It also doesn’t consider the impact of improvements that Waymo may achieve over time. But the difference between Waymo and BART is at least an order of magnitude, and even with more detailed assumptions, the takeaway will remain the same.
Let’s review the key datapoints
Traffic incidents must be measured on a per passenger mile traveled basis if analyzing impact to road safety. Waymo uses vehicle miles traveled, which overstates its positive safety impact by ignoring deadheading.
After adjusting for passenger miles traveled, Waymo has ~65% lower IPMPM than human drivers (“Airbag Deployment” incidents, assuming Waymo reporting and benchmarking are accurate).
Waymo has ~10x higher IPMPM than BART
In 2019, BART prevented ~30x more moderate injuries than Waymo does today. Even if Waymo held 100% of the rideshare market, BART would still prevent far more injuries.
Self-driving crash statistics create a tempting, but over-simplified narrative to transportation safety: Roads are dangerous → drivers are the main problem of dangerous roads → new technology can replace drivers and make roads safer. While this isn’t wrong - self-driving cars can indeed improve road safety - the narrative distracts from a broader view of more impactful strategies. Specifically, how do we get people out of cars without limiting access?
Self-driving cars and public transit aren’t swappable solutions to the same need, and that is sort of the point. They should both play a role in transportation. They both save lives (albeit on different scales) and they both have their limitations and challenges. Self-driving cars may eventually be profitable, which would mean safer roads without public subsidy. But they will always have minimal capacity, and positive impacts offset by deadheading.
To be clear, self-driving cars don’t have to be the answer to our traffic incident problem. They can just be a product that people like, with a happy feature of improved road safety. But if safety improvement is in itself the goal of transportation evolution, self-driving cars should not be the biggest focus of transportation solutioning.
High-capacity public transit already improves safety on a far greater scale, and has immense potential for additional impact. Creating useful and economically sustainable public transit systems is challenging, but if minimizing traffic injuries is truly a societal priority, then safety advocacy and resources should first focus on increasing public transit ridership.
The high level steps for reaching the number of injuries prevented is:
Record the incident rates posted on Waymo’s safety website
Rider-Only Miles: taken from https://waymo.com/safety/impact/ in December 2025. This website has since been updated with additional data
San Francisco RO miles - 29.888M
Los Angeles RO miles - 16.462M
Incident Rates

Calculate Moderate Injury Rate: calculate percent of incidents with “Any Injury” that had a severity of moderate or worse from SGO reporting from 2021 - 2025. This percentage (30%) is then applied to their published “Any Injury” incident rate.
Adjust incident rates for PMT using CPUC reporting data
PMT count assumes 1.34 passengers per vehicle (based on July - Sept 2025 Waymo CPUC reporting), and 40% deadheading (The Rideshare Guy, via Matthew Raifman)
Apply incident rates and PMT assumptions to 2024 CPUC reported mileage
Injury Counts - applies reported injury rates on Waymos website to their reported 2024 annual VMT in CPUC reporting
Other Assumptions
Total Rideshare Market size - assumes that Waymo held ~20% of the market in San Francisco based on estimates from The Rideshare Guy
2019 PMT is used as a representative pre-COVID year
BART Incident Rates: IPMPM is calculated using incidents and PMT from 2014 - 2019 in order to prevent outliers from a single year. This rate is applied to 2019 PMT to calculate expected annual incidents. Suicides are removed.
BART San Francisco Injury Prevention: BART incidents within the FTA are not specific to San Francisco. I assume 25% of BART PMT is within San Francisco.
Note: I am biased because I work in public transportation. All thoughts and opinions expressed here are my own.