
We often assume that in a free market, higher wages inevitably attract talent. If a hospital pays more, doctors should come. However, our analysis of Fiscal Year 2024 H-1B Labor Condition Applications (LCA) reveals that in rural American healthcare, this economic fundamental is broken.
Rural communities, home to 19.3% of the U.S. population¹, are facing a systemic lockout from the H-1B physician pipeline. Despite offering significant wage premiums, these areas are receiving a fraction of the medical talent required to sustain their communities. With a new $100,000 petition fee looming over the immigration landscape, this fragile ecosystem faces an existential threat.
Here is what the data tells us about the geography of healthcare access.
We analyzed 20,225 healthcare H-1B petitions from FY2024, mapping worksite locations to USDA Rural-Urban Continuum Codes². The disparity is stark.
While rural areas comprise 19.3% of the U.S. population (Census 2020), they received only 8.44% (1,709) of all healthcare H-1B petitions. This represents a 10.86 percentage point deficit, meaning rural America gets 56% fewer healthcare workers than its population share would suggest.
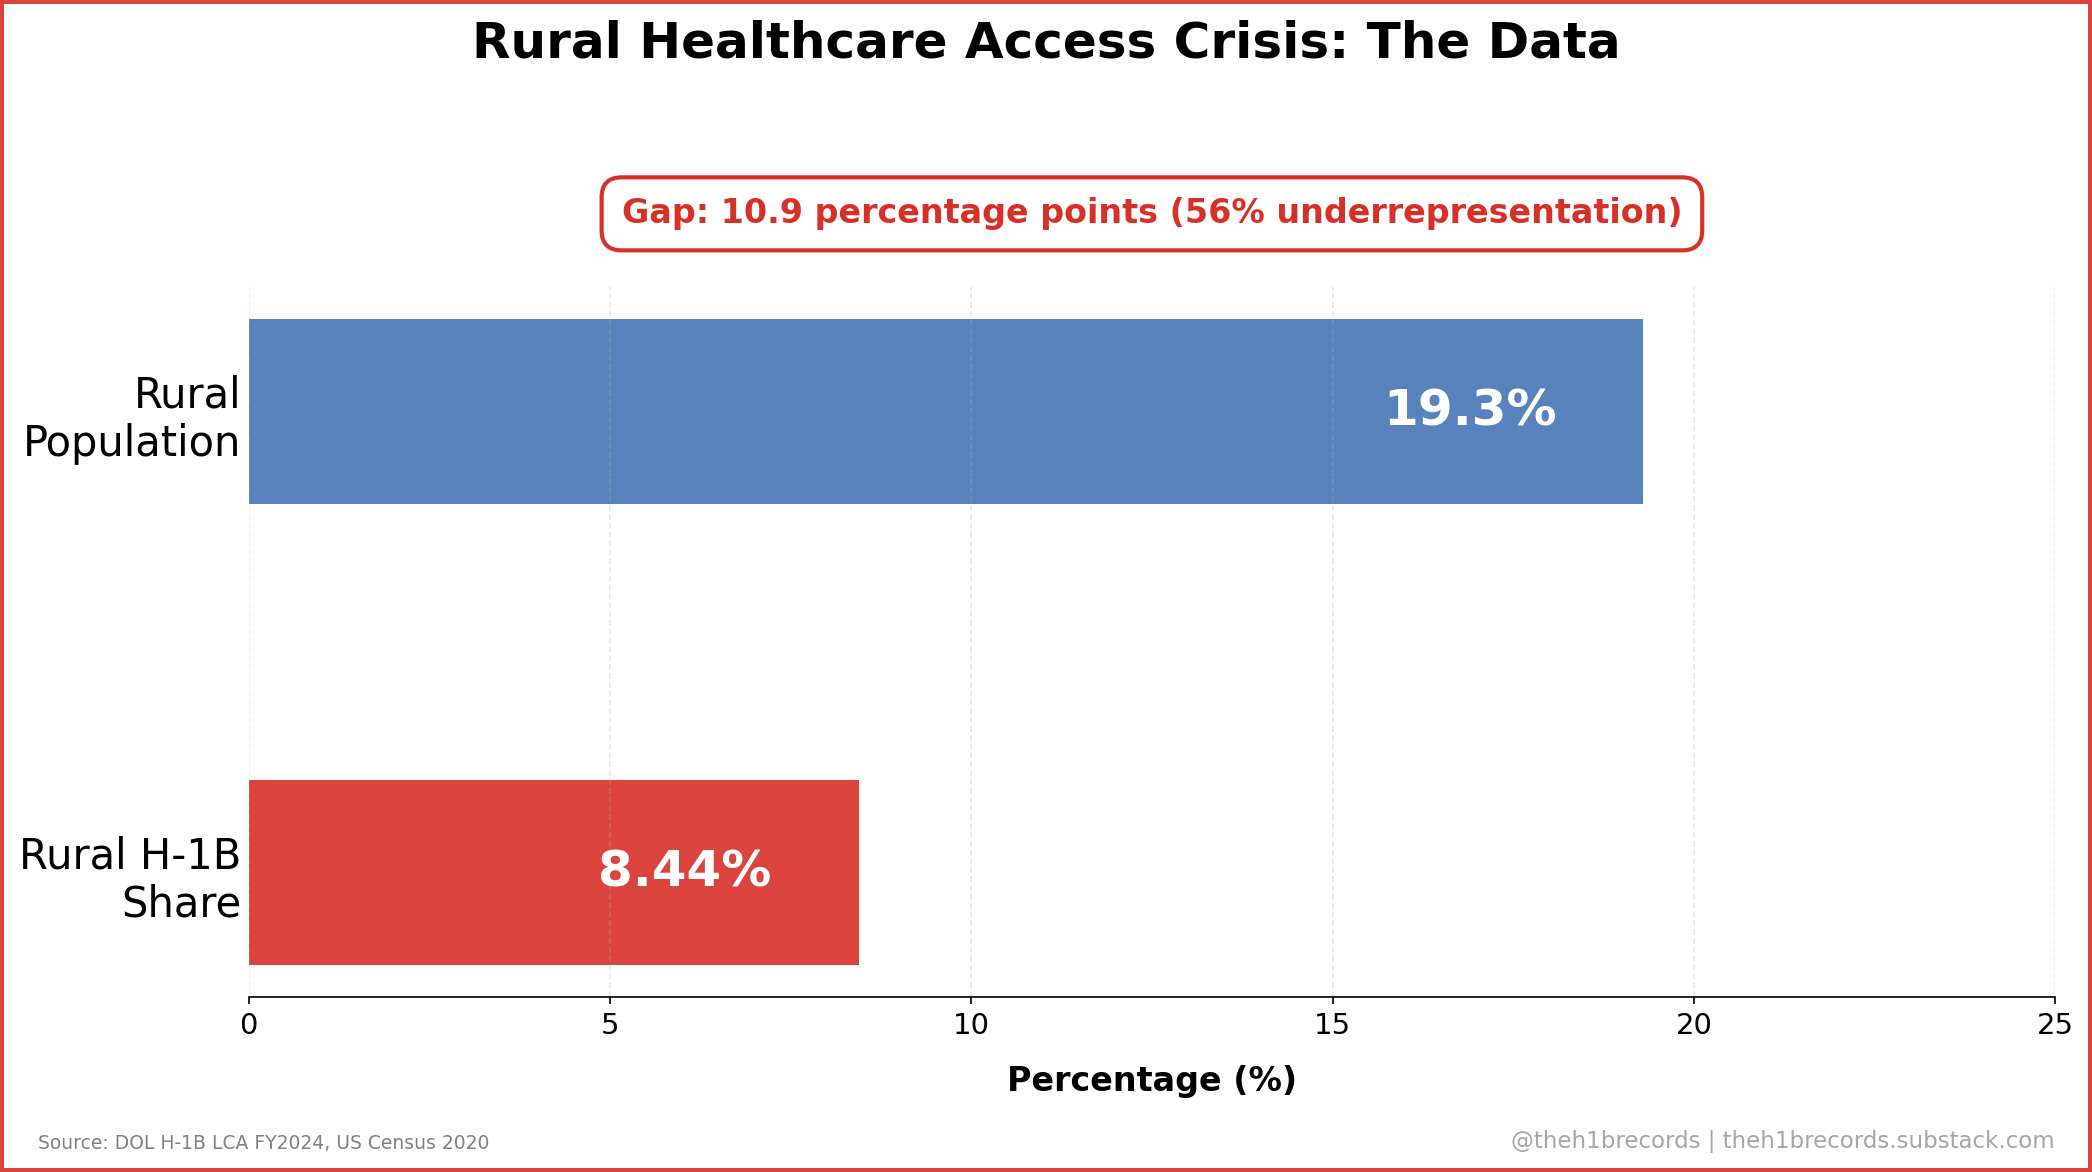
This is not merely a statistical anomaly; it is a coverage crisis. In absolute terms, rural hospitals placed only 1,012 physicians through the H-1B program in FY2024—averaging approximately 20 physicians per rural state³. For the thousands of Medically Underserved Areas (MUAs) across the heartland⁴, this pipeline is effectively dry.
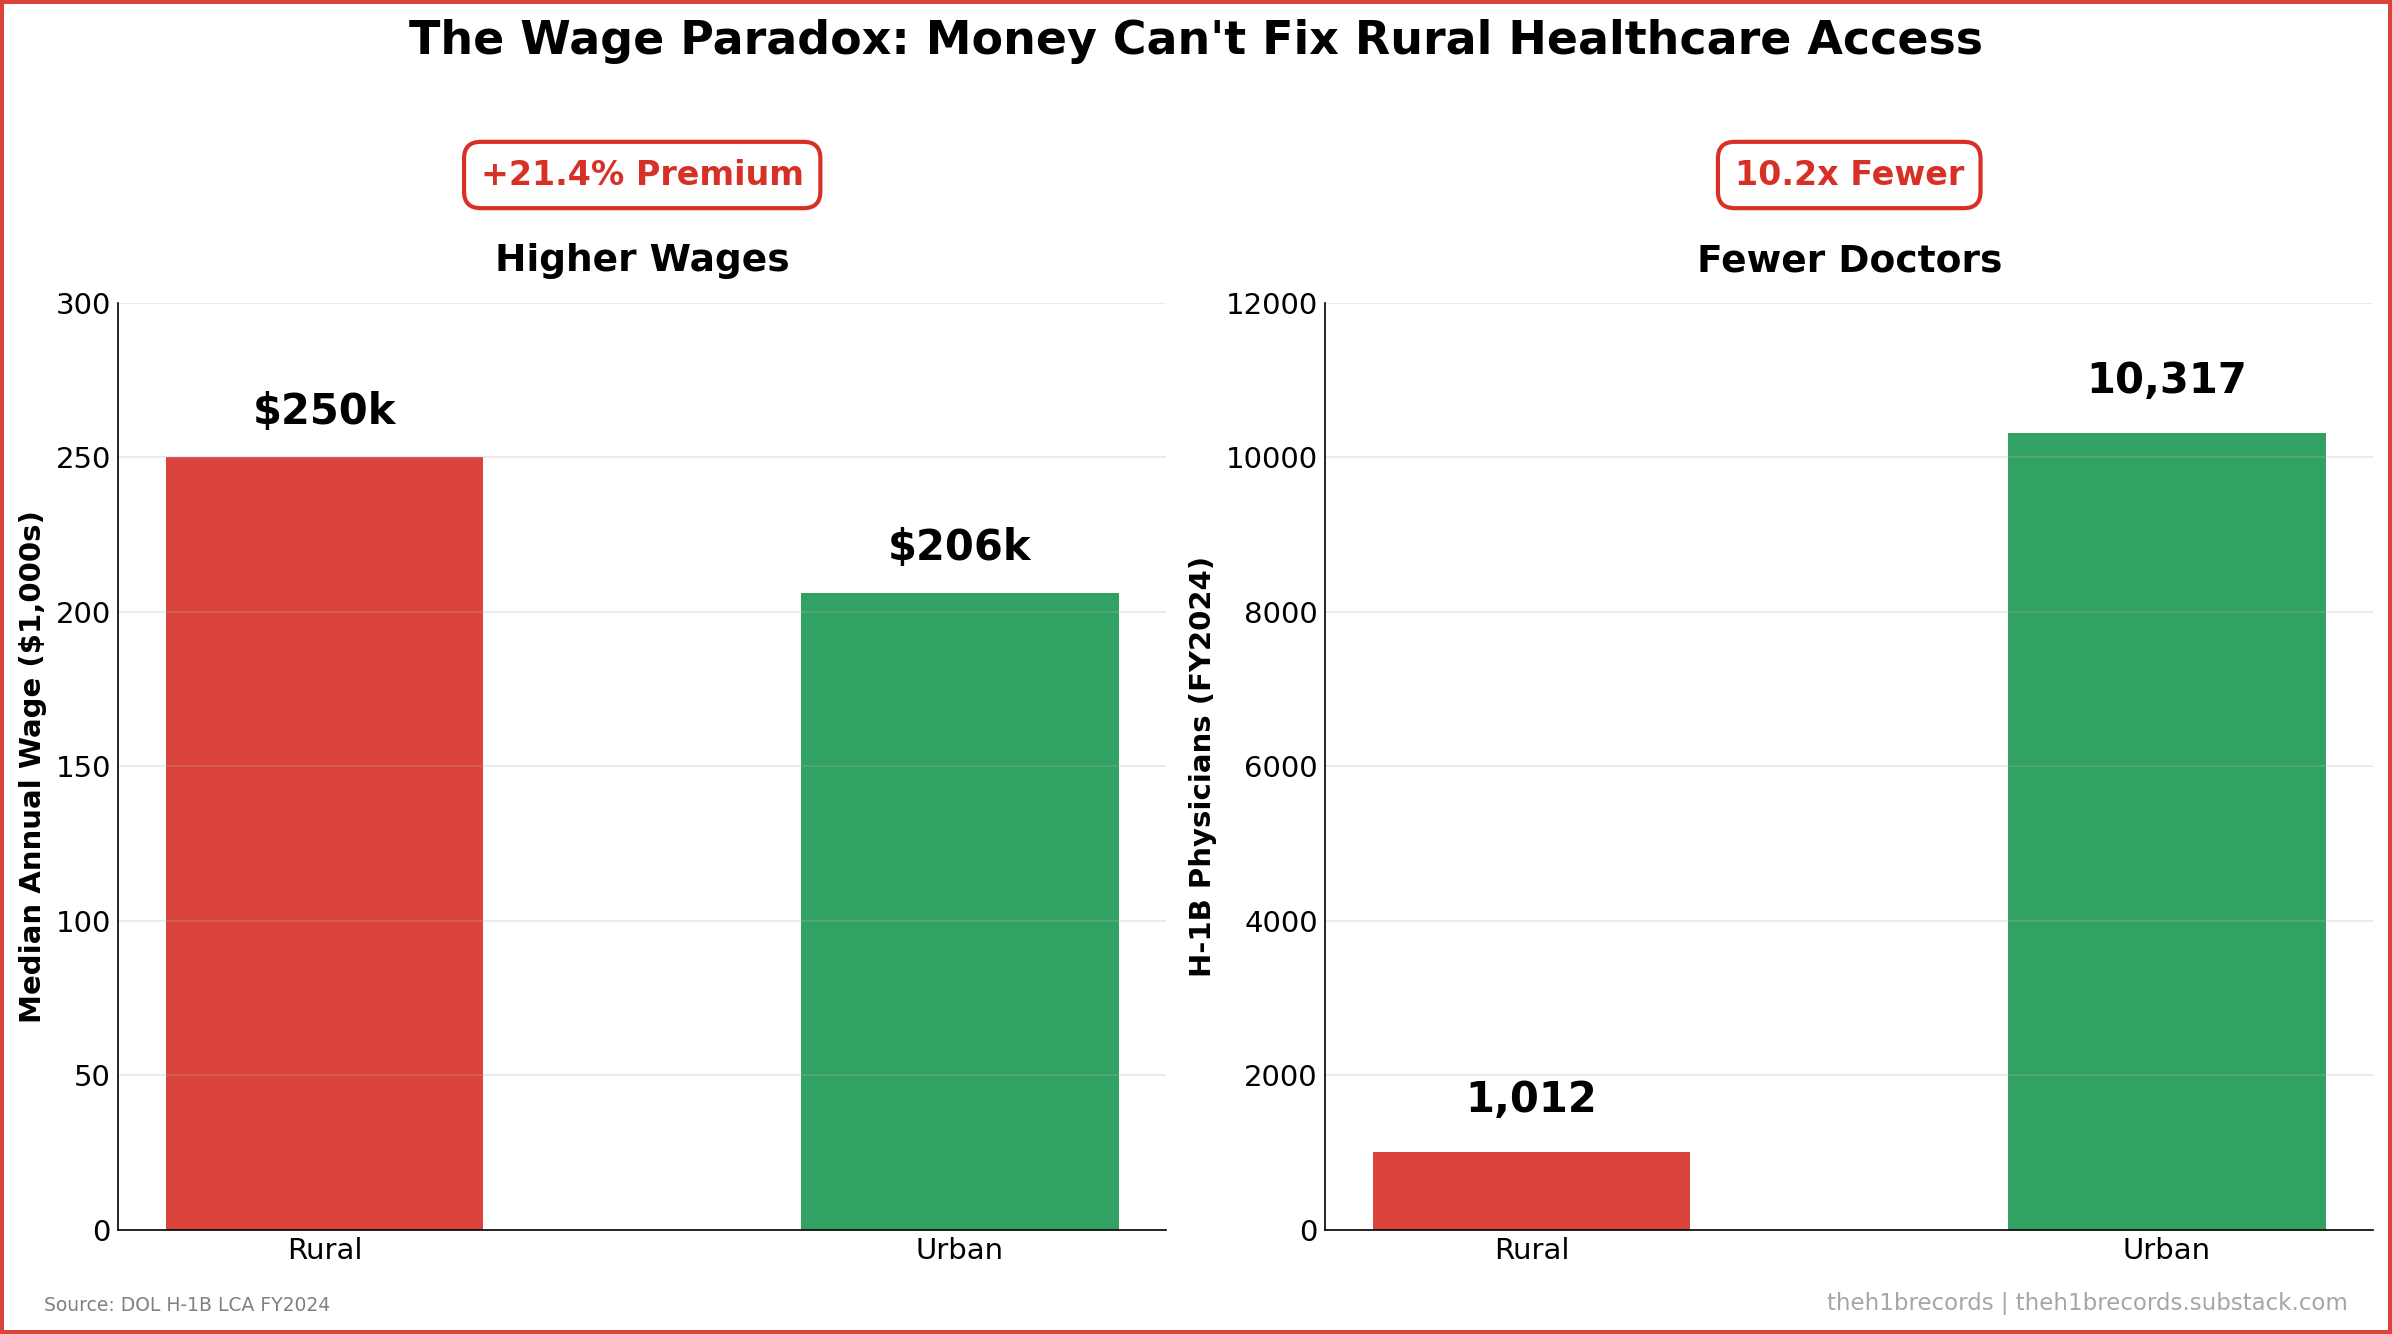
The most counterintuitive finding in our dataset is the “Wage Paradox.” Conventional wisdom suggests rural hospitals cannot afford top talent. The data proves the opposite.
We compared median annual wages for H-1B physicians in rural versus urban settings:
Rural Median Wage: $250,000
Urban Median Wage: $205,920
Rural Premium: +$44,080 (+21.4%)
Rural hospitals are aggressively using their limited budgets to compete, offering a 21.4% wage premium³. Yet, they secured 10.2 times fewer physicians (1,012 vs. 10,317) than their urban counterparts.
This paradox indicates that non-wage barriers—geographic isolation, lack of infrastructure for spousal employment, and regulatory complexity—are insurmountable by salary alone. Money is necessary, but in the current immigration ecosystem, it is insufficient.
The introduction of a $100,000 fee for new H-1B petitions acts as a regressive tax on this already strained system.
While the fee represents a lower percentage of the median rural wage (40.0%) compared to the urban wage (48.6%), this metric is deceptive. Urban health systems often operate with billion-dollar revenues and can amortize recruitment costs across hundreds of beds. Rural Critical Access Hospitals operate on razor-thin margins. A $100,000 upfront cost—on top of a $250,000 salary—creates an absolute barrier to entry that prevents the recruitment process from even beginning.
It is important to address a counter-interpretation of this data. Critics might argue that lower H-1B volumes in rural areas simply reflect lower population density and, consequently, lower aggregate demand for specialists. If there are fewer people, arguably, there should be fewer doctors.
However, this view ignores the Health Resources and Services Administration (HRSA) data, which designates 6,448 Medically Underserved Areas, predominantly in rural regions⁵. The demand for care exists; the supply chain is broken. Furthermore, while lower total numbers are expected, the proportional mismatch (8.44% share vs. 19.3% population) confirms that rural citizens are systematically underserved relative to their urban peers.
For policymakers, this data suggests that a uniform immigration policy penalizes rural healthcare. Without specific carve-outs or National Interest Exceptions for the new fees, the rural wage premium will continue to be wasted on structural friction rather than talent acquisition.
For job seekers, the data highlights a lucrative but difficult market. The jobs exist, and they pay significantly better, but the administrative friction to secure them is higher.
---
To ensure the accuracy of this report, we cross-referenced three primary government datasets. All analysis was performed using Python to map worksites to county-level indicators.
Visa Data: U.S. Department of Labor, Office of Foreign Labor Certification (OFLC). We utilized the H-1B Labor Condition Application (LCA) Disclosure Data for Fiscal Year 2024 (Q1–Q4). This dataset records the intent to hire foreign workers and the prevailing wages offered³.
Geographic Definitions: U.S. Department of Agriculture (USDA) Economic Research Service. We employed the 2013 Rural-Urban Continuum Codes (RUCC)⁶. Counties with codes 1–3 were classified as “Urban” (Metro), and codes 4–9 were classified as “Rural” (Non-metro)⁷.
Population Baseline: U.S. Census Bureau, 2020 Decennial Census. Used to calculate the 19.3% rural population baseline for representation ratios⁸.
Healthcare Context: Health Resources and Services Administration (HRSA). Referenced the Medically Underserved Area (MUA) designations to validate demand⁹.
- LCA vs. Visa Issuance: This analysis tracks certified petitions (intent to hire), not final visa issuances by the State Department. However, LCA data is the standard proxy for labor demand.
- J-1 Visas: This study focuses exclusively on the H-1B pathway. While J-1 waivers are critical for rural access, they are processed differently and are not included in this specific dataset.
---
¹ U.S. Census Bureau. (2020). 2020 Decennial Census. https://www.census.gov/
² U.S. Department of Agriculture Economic Research Service. (2013). Rural-Urban Continuum Codes. https://www.ers.usda.gov/data-products/rural-urban-continuum-codes/
³ U.S. Department of Labor, Office of Foreign Labor Certification (OFLC). (2024). H-1B Labor Condition Application (LCA) Disclosure Data, Fiscal Year 2024.https://www.dol.gov/agencies/eta/foreign-labor/performance
⁴ Health Resources and Services Administration (HRSA). (n.d.). Medically Underserved Area (MUA) Designations. https://data.hrsa.gov/
⁵ Health Resources and Services Administration (HRSA). Data Warehouse. https://data.hrsa.gov/
⁶ U.S. Department of Agriculture Economic Research Service. (2013). Rural-Urban Continuum Codes. https://www.ers.usda.gov/data-products/rural-urban-continuum-codes/
⁷ ZIP–county mappings were derived from the public ZIP–county reference dataset geo-data.csv maintained at https://github.com/scpike/us-state-county-zip, and converted to county FIPS codes for integration with RUCC.
⁸ U.S. Census Bureau. (2020). 2020 Decennial Census. https://www.census.gov/
⁹ Health Resources and Services Administration (HRSA). Data Warehouse. https://data.hrsa.gov/
This analysis represents independent data journalism examining public government records. All errors are our own.
Last updated: Jan 12, 2025
Disclaimer: This is data journalism, not legal advice.