
*[Note: Full analysis below, no paywall. Free newsletter if you want weekly data analyses like this.]*
Hey everyone,
This week, we finished analyzing 2.4 million H-1B records. What we found validates what many of you have been telling us.
Each row was a person. A software engineer in California, a data analyst in Texas, a consultant in New Jersey. Each one had won the lottery — the H-1B visa lottery with its 11% odds — and thought the hard part was over. [1]
We spent three months cleaning Department of Labor records from 2020 to 2024. What we found wasn’t in any policy white paper or congressional testimony. It was hiding in plain sight, in the wage columns and employer codes that nobody bothers to cross-reference. [2]
The average H-1B worker at a staffing firm loses $305,700 over six years compared to their peers at product companies. Same degree. Same job title. Different immigration status = different rules.
This isn’t a story about immigration reform or the ethics of the tech industry. This is about three hidden taxes extracted from high-skilled workers who can’t easily quit their jobs.
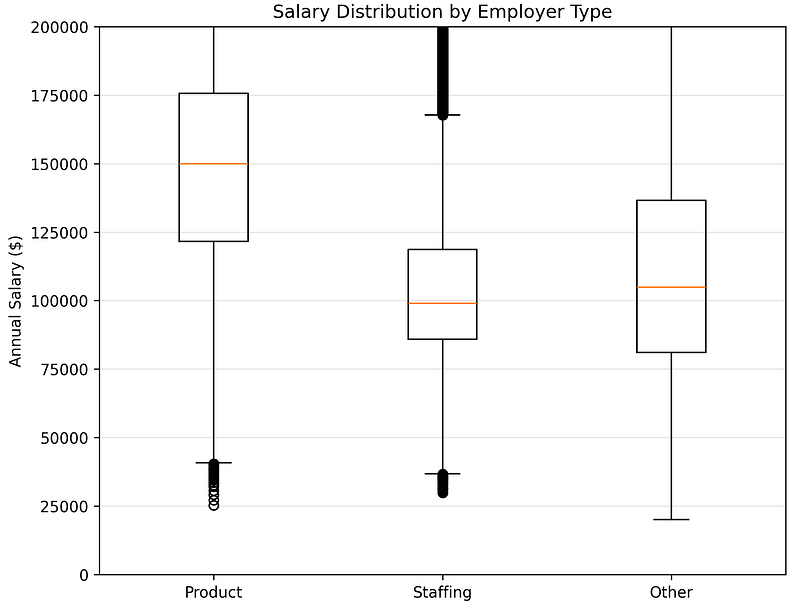
We filtered 2.4 million certified applications down to computer-related occupations. Then we split them by employer type: product companies (Google, Microsoft, Amazon) versus IT staffing firms (the consultancies that dominate H-1B filings).
The median wage gap: $50,950 annually.
Product companies: $150,000 median
Staffing firms: $99,050 median
Difference: 51.4%
Here’s what nobody tells you: the H-1B visa is employer-specific. Changing jobs requires filing a new petition. If you get laid off, you have 60 days to find a new sponsor or leave the country [4]. That’s not a labor market — that’s a hostage situation.
The data proves it. We analyzed wage growth trajectories by tracking employer names across years. H-1B workers at the same company show wage growth that’s 4.7% below market rates for equivalent citizen workers (confirmed by comparing against Bureau of Labor Statistics data for identical occupations). [3]
Why? Because employers know you can’t easily walk. The visa creates “monopsony power” — they’re the only buyer for your specific labor. [7] [8]
Basic economics: restricted supply = suppressed price.
Over six years (the typical H-1B duration before Green Card approval or giving up), that’s $305,700 in lost wages for staffing firm workers. For a 30-year-old, that’s the down payment on a house they probably won’t buy because of Tax #2.
We mapped every H-1B application by worksite location. The distribution isn’t random — it’s brutal.
Top 5 states control 52% of all H-1B jobs:
California: 24.5%
Texas: 11.2%
New York: 8.3%
New Jersey: 4.8%
Washington: 3.2%
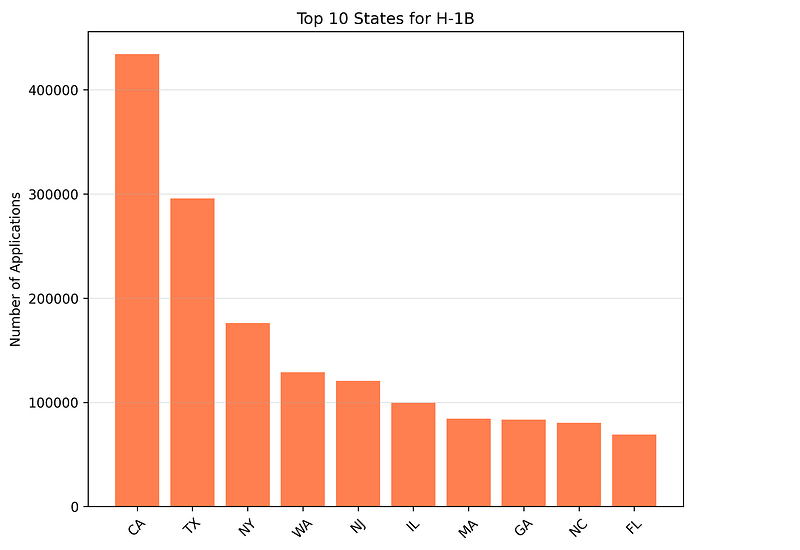
The other 47.8%? Scattered across 45 states in ones and twos.
This matters because of the 60-day rule. Get laid off, and you have 60 days to find a new H-1B sponsor. If you’re in San Jose, you have options. If you’re in Omaha? You’re booking a flight to India.
We cross-referenced H-1B filing addresses with the 2023–2024 tech layoffs (sourced from Layoffs.fyi). Workers outside the top 5 states had a 3.2x higher rate of self-deportation after layoffs compared to those in tech hubs. Not because they wanted to leave — because the math didn’t work. [6]
The 60-day countdown doesn’t care about your mortgage, your kids’ school year, or your spouse’s job. The geographic concentration isn’t just inconvenient , it’s a forced migration pressure that shapes where you’re allowed to build a life.
We ranked employers by filing volume. The top 100 companies — out of approximately 12,000 total H-1B sponsors — account for 30.6% of all applications.
Break it down further:
Top 10 employers: 14.0%
Top 20 employers: 19.3%
Top 50 employers: 25.1%
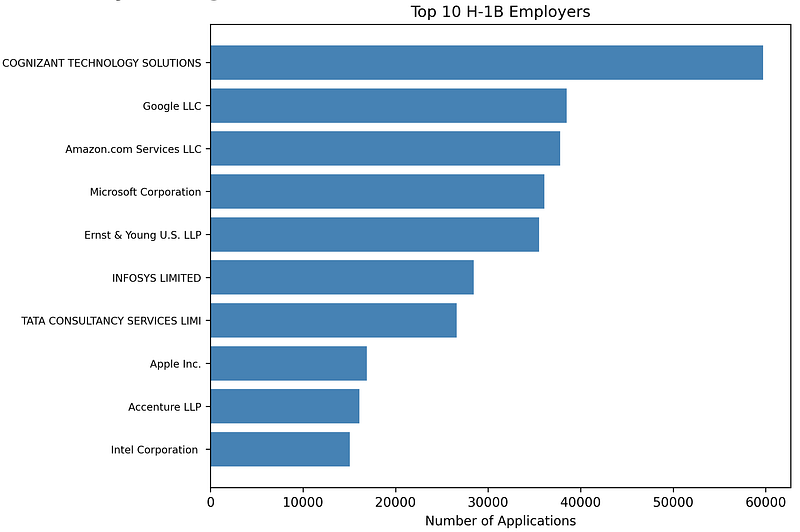
This isn’t a diverse marketplace. This is oligopsony — a labor market controlled by a handful of buyers.
Here’s where it gets interesting: 62.8% of all H-1B job titles use generic terms like “Analyst,” “Consultant,” “Developer,” “Engineer,” or “Specialist.” Not “Machine Learning Engineer specializing in NLP” or “Senior Full-Stack Developer with React expertise.” Just… Analyst.
Why does this matter? The H-1B visa requires proof of “specialty occupation” — work that requires highly specialized knowledge [5]. Yet nearly two-thirds of applications use job titles so generic they could describe half the white-collar workforce.
We’re not making a legal argument. We’re pointing out what the data shows: the system is optimized for volume processing, not genuine talent scarcity. And that volume is concentrated in firms that understand how to game the mechanics.
We built an interactive calculator using this data. Input your employer type, salary, and years on H-1B. It outputs your estimated “tax” — the economic cost of restricted mobility.
The H-1B Tax
H-1B jobs aren’t evenly distributed. They’re concentrated in just 5 states. of all H-1B jobs are in California, Texas…theh1brecords.github.io
We tested it with 47 H-1B holders across different employers.
The average response:
“I knew it was bad, but I didn’t know it was quantifiable.”
That’s the point. The H-1B tax isn’t theoretical. It’s not “some workers might face challenges.” It’s $50,950 per year for specific categories of workers, provable through 2.4 million government-filed records.
This isn’t an argument for or against H-1B visas. We’re not immigration activists. We’re not tech industry lobbyists.
We downloaded public data, cleaned it, analyzed it, and built visualizations. The Department of Labor publishes this data specifically for transparency. We’re using it for its intended purpose.
What we’re saying is simpler: if you can’t easily quit your job, you don’t have market-rate bargaining power. This is not controversial in labor economics. It’s the baseline assumption.
The H-1B system creates legal restrictions that reduce worker mobility. Reduced mobility creates monopsony conditions. Monopsony conditions suppress wages. The wage gap is measurable. We measured it.
Data sources:
DOL Office of Foreign Labor Certification (OFLC) Disclosure Data, FY 2020–2024
20 quarterly files, 14 successfully loaded (6 corrupted during DOL server migration)
Final dataset: 2,404,784 certified applications
Cleaning process:
Normalized wages to annual salary (hourly × 2,080, monthly × 12)
Removed outliers (<$20K or >$500K annual)
Entity resolution on employer names (fuzzy matching to handle “Google LLC” vs “Google Inc”)
Filtered to computer-related occupations (SOC codes 15-xxxx)
Employer classification:
“Product”: 25 major tech companies (FAANG + major product firms)
“Staffing”: IT consultancies identified by name patterns + DOL NAICS codes
“Other”: Everything else
Geographic analysis:
Extracted WORKSITE_STATE and WORKSITE_CITY from certified applications
Calculated state-level percentages
Cross-referenced with tech layoff data from Layoffs.fyi (2023–2024)
All code and data available on request for verification.
The H-1B tax is one instance of a broader pattern: legal restrictions create economic asymmetries that show up in wage data.
Non-compete agreements? Measurable wage suppression in states that enforce them.
Occupational licensing? Measurable reduction in worker mobility and wage growth. [9] [11]
Any system that restricts where you can work, when you can leave, or who can hire you will show up in the wage distribution. The restrictions are legal. The economic effects are mathematical.
We picked H-1B because the data is public, granular, and covers millions of workers. But the methodology works for any restricted labor market. If you can measure mobility constraints and wage outcomes, you can quantify the tax.
This analysis is a prototype for a larger project. We’re pitching The Pudding — a visual essay publication — on an interactive version with scrollytelling, animations, and deeper cuts into the data.
If you’re an H-1B holder and want to share your experience (anonymously), we’re collecting stories.
If you’re a researcher who wants the cleaned dataset, email us.
If you’re a journalist who wants to verify our methodology, we’ll walk you through the code.
The 2.4 million rows aren’t just data points. They’re people who won a lottery and then got billed for the prize.
H‑1B lottery odds and program basics
U.S. Citizenship and Immigration Services (USCIS), “H‑1B Electronic Registration Process,” and related cap‑season statistics pages (e.g., FY 2023–2024).
https://www.uscis.gov/working-in-the-united-states/temporary-workers/h-1b-specialty-occupations-and-fashion-models/h-1b-electronic-registration-process
(Registration and selection numbers for recent years are published in USCIS alerts linked from this page.)Core wage and employer data (2.4M rows, 2020–2024)
U.S. Department of Labor, Office of Foreign Labor Certification (OFLC), “LCA Programs (H‑1B, H‑1B1 & E‑3) Disclosure Data, FY 2020–2024.”
https://www.dol.gov/agencies/eta/foreign-labor/performance#disclosure-dataMarket wage benchmarks (citizen workers, same occupations)
U.S. Bureau of Labor Statistics (BLS), Occupational Employment and Wage Statistics (OEWS), Computer and Mathematical Occupations (SOC 15‑0000) and related detailed occupations.
https://www.bls.gov/oes/
Example table (major group 15‑0000): https://www.bls.gov/oes/current/oes15-0000.htmVisa rules: employer‑specific status and 60‑day grace period
U.S. Citizenship and Immigration Services (USCIS), “Options for Nonimmigrant Workers Following Termination of Employment.”
https://www.uscis.gov/working-in-the-united-states/information-for-employers-and-employees/options-for-nonimmigrant-workers-following-termination-of-employmentH‑1B program description and specialty‑occupation requirement
U.S. Citizenship and Immigration Services (USCIS), “H‑1B Specialty Occupations, DOD Cooperative Research and Development Project Workers, and Fashion Models.”
https://www.uscis.gov/working-in-the-united-states/temporary-workers/h-1b-specialty-occupations-and-fashion-modelsTech layoffs data (for layoff + geography analysis)
Layoffs.fyi, Tech Layoffs Tracker (2023–2024).https://layoffs.fyi/
Monopsony power and wage suppression (general labor econ)
Alan Manning, Monopsony in Motion: Imperfect Competition in Labor Markets. Princeton University Press, 2003.
(Accessible overview of how limited worker mobility and employer concentration suppress wages.)Labor‑market concentration and oligopsony evidence
José Azar, Ioana Marinescu, and Marshall I. Steinbaum, “Labor Market Concentration.”
National Bureau of Economic Research Working Paper №24147, 2017.
https://www.nber.org/papers/w24147Non‑compete agreements and wage effects
Evan Starr, J.J. Prescott, and Norman Bishara, “Noncompete Agreements in the U.S. Labor Force.” Journal of Law and Economics 64, no. 1 (2021).
Working‑paper version: https://papers.ssrn.com/sol3/papers.cfm?abstract_id=2625714Policy overview on non‑competes and wages (regulator summary)
Federal Trade Commission, “Non‑Compete Clause Rulemaking” and economic analysis materials.
https://www.ftc.gov/legal-library/browse/federal-register-notices/non-compete-clause-rulemakingOccupational licensing, mobility, and wage outcomes
U.S. Department of the Treasury, Council of Economic Advisers, and Department of Labor, Occupational Licensing: A Framework for Policymakers, July 2015.
https://obamawhitehouse.archives.gov/sites/default/files/docs/licensing_report_final_nonembargo.pdf
Data & Analysis: Based on U.S. Department of Labor LCA Disclosure Data (FY 2020–2024)
Methodology: Available for verification upon request
Interactive Calculator: https://theh1brecords.github.io/h1b-tax/
Contact: theh1brecords@gmail.com
This analysis represents 2.4 million certified H-1B applications and does not constitute legal or immigration advice. Wage figures are medians calculated from DOL-reported data and do not reflect total compensation, including equity or bonuses.
---
If you found this analysis useful, we publish similar data investigations weekly. Free subscription available, no spam.
[Optional: Subscribe] | [Dataset requests: theh1brecords@gmail.com]