We’re heading into the end of high season for one of the brands I own right now — it’s gardening related, and folks have their plants in the ground by now. The end of high season is the best time for any brand, because it means I’ve got cash to distribute! The big question, though, is exactly how much.
Since I treat each brand independently from a cash perspective, and I don’t use any kind of inventory financing, I need to make sure that between cash on hand and what I expect to come in from future sales, there’s enough to place future orders. This requires projecting revenue, costs and the timing of orders. It’s one of those tasks that’s not really hard to do with a spreadsheet, but now that I own a dozen brands, the time required across all of them really adds up. So naturally, it’s time to get AI to do this for me.
The good news is that the projection piece is something I’ve already spent a lot of time on, first all the way back when GPT-5-codex-high was SOTA, and a bit more recently by developing a Claude skill. Initially, the Claude skill had my projection methodology well-defined, but it was too long for Claude to reliably follow. It would do mostly the right thing but then miss some steps or do them in ways that weren’t quite correct. That would usually give me projections that were in the ballpark, but given how critical this is to my business, not good enough to rely on.
Since then I’ve tinkered with the skill a bit, mostly updating it to spin up subagents for individual tasks within the skill in order to minimize the amount of information in the main skill’s context window. If it needs to retrieve sales data from Amazon, for example, it’ll have a subagent make the API calls and return only the specific numbers needed, thus keeping those calls out of the main agent’s context.
That helped, but it still wasn’t fully reliable until Opus 4.7. When I tested it with max reasoning, it went a perfect 5/5 on testing that included all of my thorniest cases. (I haven’t tried it with sub-max reasoning; very possible max is overkill.)
With that working, Claude should be able to make me a cashflow projection dashboard.
First, Claude needs requirements. As engineering is now approximately free and iterations take minutes, I have become extremely lazy on the initial spec.
I need a cashflow projection dashboard. The main purpose of this is to show me how much money I can safely distribute from each brand while ensuring I retain enough to place future orders. The main dashboard should have one card for each brand that shows how much is available to distribute. When I click on the card, it should go to a more detailed view that shows a graph of cashflow by month along with a table that breaks down revenue and expenses for each month.
The dashboard should start with my current cash balance, then determine changes in cashflow each month based on projected sales and expenses. It should use the /inventory skill to project sales as well as when it will be necessary to place orders, and it should include the deposit, balance and freight payments in expenses. Let me know what other information you need to build this.
It came up with the right list of info (always a good sign), which I gave it:
Cash on Hand
Every brand within a single legal entity shares a bank account, so I track each one on a ledger in Google Sheets. The dashboard just needs to retrieve the current balance from there. Amazon also holds cash from sales temporarily before making transfers into my bank account every two weeks, so we need to retrieve that via an API call.
COGS and Payment Terms
The /inventory skill projects unit sales and reorder dates, but it doesn’t have any information about costs. For each product, Claude needs to know the unit cost, a rough estimate of shipping, and payment terms. For most brands, I put down a 30% deposit when I place an order and pay the remaining 70% on completion, though a few are 50/50.
Current Inventory
The /inventory skill knew how to retrieve inventory stored at Amazon via API, but there are some edge cases where I have inventory either at a 3PL in the US or with the manufacturer in China. In the former, it is fully paid for and the only cost I need to account for is a relatively small freight cost from the 3PL to Amazon warehouses. In the latter, when the goods are shipped I need to pay the balance of what I owe the manufacturer as well as the cost of shipping to the US.
For the initial version of the dashboard, I just gave Claude the number of units of any product outside of Amazon, as well as the location where they’re stored. For timing purposes, I told it to assume it would take 10 days to get product from my 3PL to Amazon and 40 from China.
Fees
Claude initially just made a simple estimation of fees, but after that went poorly (a bit more on that below), I came back and had it model them in more granular fashion.
Amazon takes out all of its fees before disbursing money to me, with the exception of ad charges, which are paid on a credit card.
Some of the Amazon fees are straightforward to model:
Referral fee is 15% of revenue
Fulfillment is a flat fee per unit (based on size/weight)
Then there are charges that can vary a fair bit:
Storage is a flat cost per unit (based on size), but the cost varies depending on:
Whether units are in FBA or AWD (the latter being Amazon’s upstream storage; it’s cheaper but units must be shipped from there to FBA before they can be sold to customers)
What time of the year it is (in Q4 storage costs triple)
Whether units have been sitting for >180 days, in which case they incur a long-term storage fee
Returns
I need to account for the fact that when a unit is returned:
The referral fee gets refunded to me but the fulfillment fee does not
For some brands, I allow Amazon to determine if the returned unit is in sellable condition. If it is, it goes back into inventory, and if not they dispose of it (for a fee, naturally).
For some brands with lower-volume, higher-cost products, especially those where I don’t trust Amazon to evaluate condition, I have them shipped back to my house. I evaluate the quality, and if anything’s missing I file a case with Amazon and get reimbursed. When I need more stock at FBA or my garage is getting too full, I ship the sellable units back.
Promotions
Amazon charges you to do things like put a coupon on your listing or run a sale during Prime Day.
Coupons are a fun example of crazy Amazon fees that surprise most people:
To run a coupon, you pay $5, then you also pay 2.5% of the revenue generated by any sales for which the customer used the coupon. (If you’re not familiar with coupons on Amazon, they literally just involve the user checking a box. A lot of sellers are infuriated by this fee structure, but I’m just awed at Amazon’s ability to wield capitalism to the fullest!)

Also, when someone uses a coupon, instead of taking the price that the customer paid as the revenue from the sale, Amazon credits you with revenue of the non-discounted price then deducts the discount plus their 2.5% as a fee.
In all of these cases, I went back and forth and landed on some simplified models, since I can just leave some buffer cash in each brand’s account and thus don’t need to be perfect to the dollar.
For storage, I had Claude assume I’m never paying long-term storage fees and make some straightforward assumptions about FBA vs. AWD costs for brands that use both. Returns are modeled based on historical data, and we mostly ignore cases where they’re shipped back to my house, since the numbers aren’t huge and the fees are eventually offset by revenue generated from reselling them. Promotions are accounted for by just using historical averages of promotion costs.
With all of that done, we get to the fun part of actually getting my dashboard built. This went through the standard cycle of working with Claude. First, I get a beautiful UI:
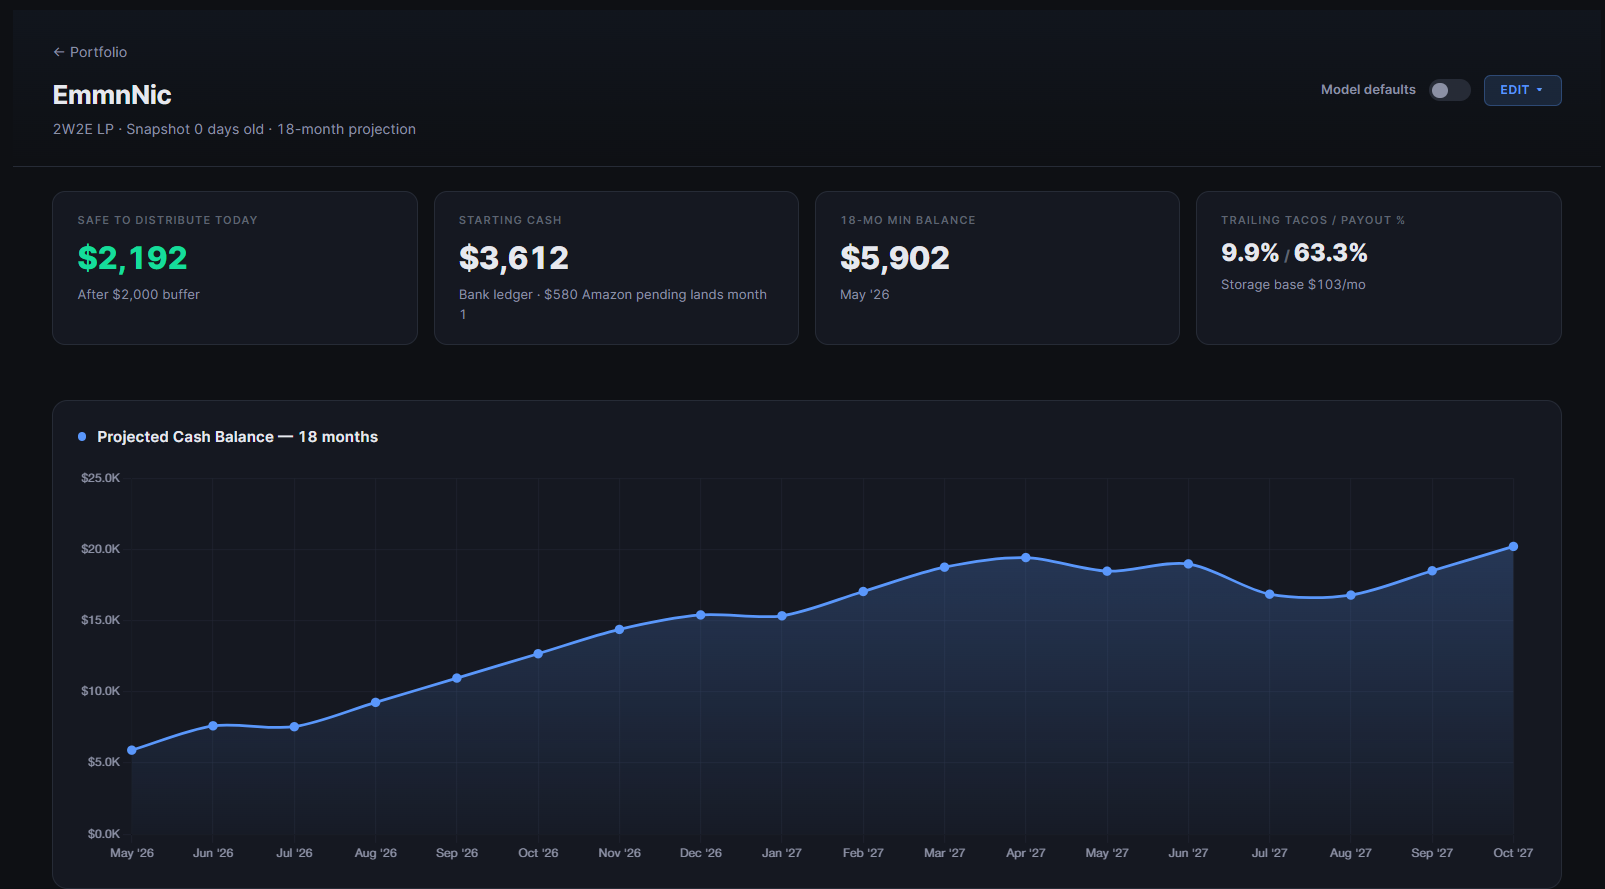
Then I start digging and finding issues, which leads me to add more output on the dashboard screen in order to check Claude’s numbers.
A few I ran into here:
Starting cash was wrong. It was pulling from the wrong column on my Google Sheet. Claude did not find an issue with the fact that most of my brands had very large negative amounts of cash. C’mon, Claude, I’m better at business than that.
Projections were clearly off. I had it add charts of sales history and projected 18-month sales, as well as a card showing the method it was using to make projections, so I could find the source of the issue. Turns out it was not using the /inventory projection skill despite my very specific instructions. I chastised, Claude fixed.
Amazon fees were double counted. Initially, Claude just took the historical % of revenue that was paid out to me as cash for each brand and used that to estimate cashflow. The problem was that it also found the historical average storage and promotion fees, which it subtracted from the expected cash coming from Amazon, even though those were already included in its initial calculation. After that, I went through the more detailed process described above for modeling fees.
Once I was satisfied that everything was accurate, I distributed myself some money.

Then I started adding features, because why not?
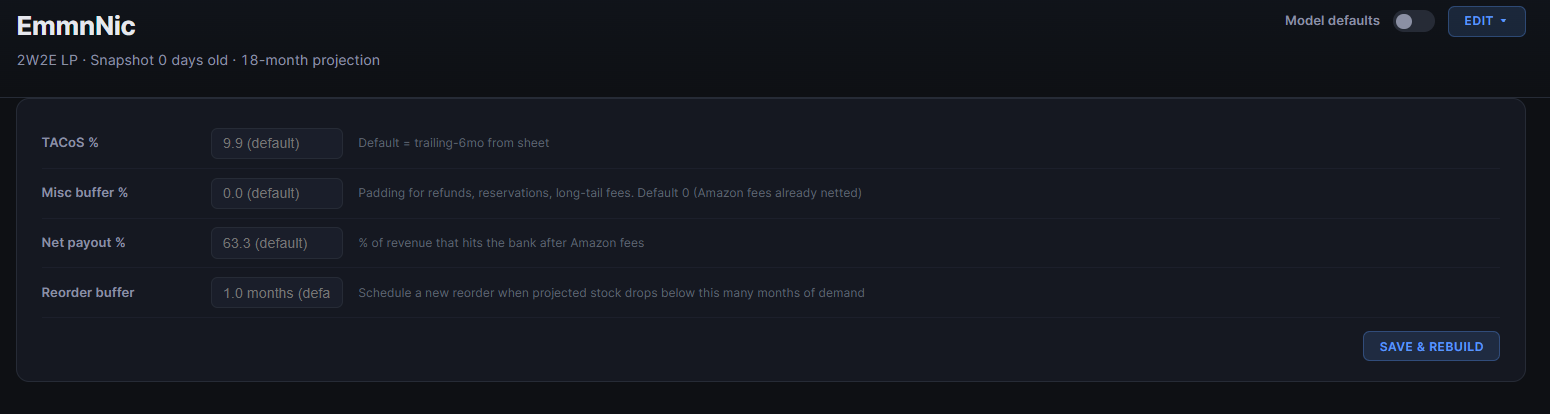
First, the ability to adjust the assumptions baked into the model:
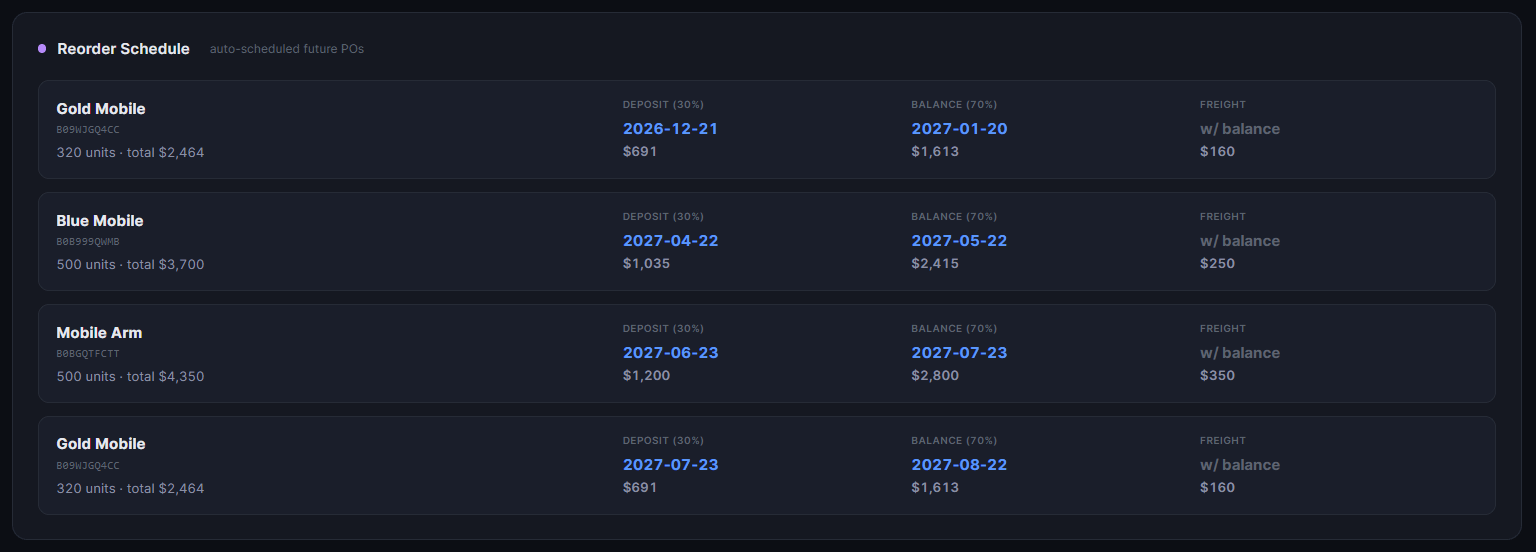
Next, a list of cards with projected reorders for easy tracking.
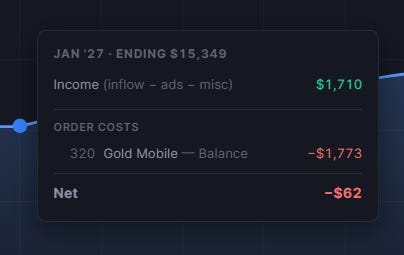
After that, a nice little tooltip when you hover over a dot on the chart that shows what’s happening that month.
Now, in about half a day (which, to be fair, excludes much more than half a day spent on the /inventory skill), I’ve got a dashboard that lets me keep myself paid without pulling too much out of the business or monkeying around with spreadsheets a couple dozen times a year.
One final thing worth noting was that after the dashboard was built, I had to figure out how often to update it. During development, Claude just pulled numbers and ran /inventory as needed, but I don’t want to have to ask it whenever I need it refreshed.
The limiting factor was that the /inventory skill takes a fair bit of time and is pretty token-intensive, so I don’t want to overdo it there. I ended up landing on weekly updates of each brand, staggered over the course of the week. Each day, it runs /inventory for one or two brands then updates the dashboard with the results. That is frequent enough given how often I place orders, but back-of-the-napkin math said it wouldn’t blow through so many tokens that I’d have to upgrade my Claude plan.
Now that this is up and running, the next steps are to integrate it with my supplier dashboard to track orders that are in flight and to start notifying me when I need to place new orders. Tune in next week for that!