Loading data...
Insights
A new kind of presidency
President Trump dominated The New York Times headlines like no previous president, even when he was not in office.
Cyclical coverage
The New York Times coverage of Iowa follows a tried and true cycle, driven by presidential primary politics.
A global paper, albeit with blind spots
Conflict reliably draws The New York Times' attention, but large swaths of the globe rarely get covered.
An enduring gender divide
The New York Times has made an effort to elevate more women in its obituary notices, but even in recent years men have outnumbered women in obituaries two to one.
Fewer, longer articles
Over the last decade, the number of articles published by The New York Times has diminished and the median word count per article has increased.
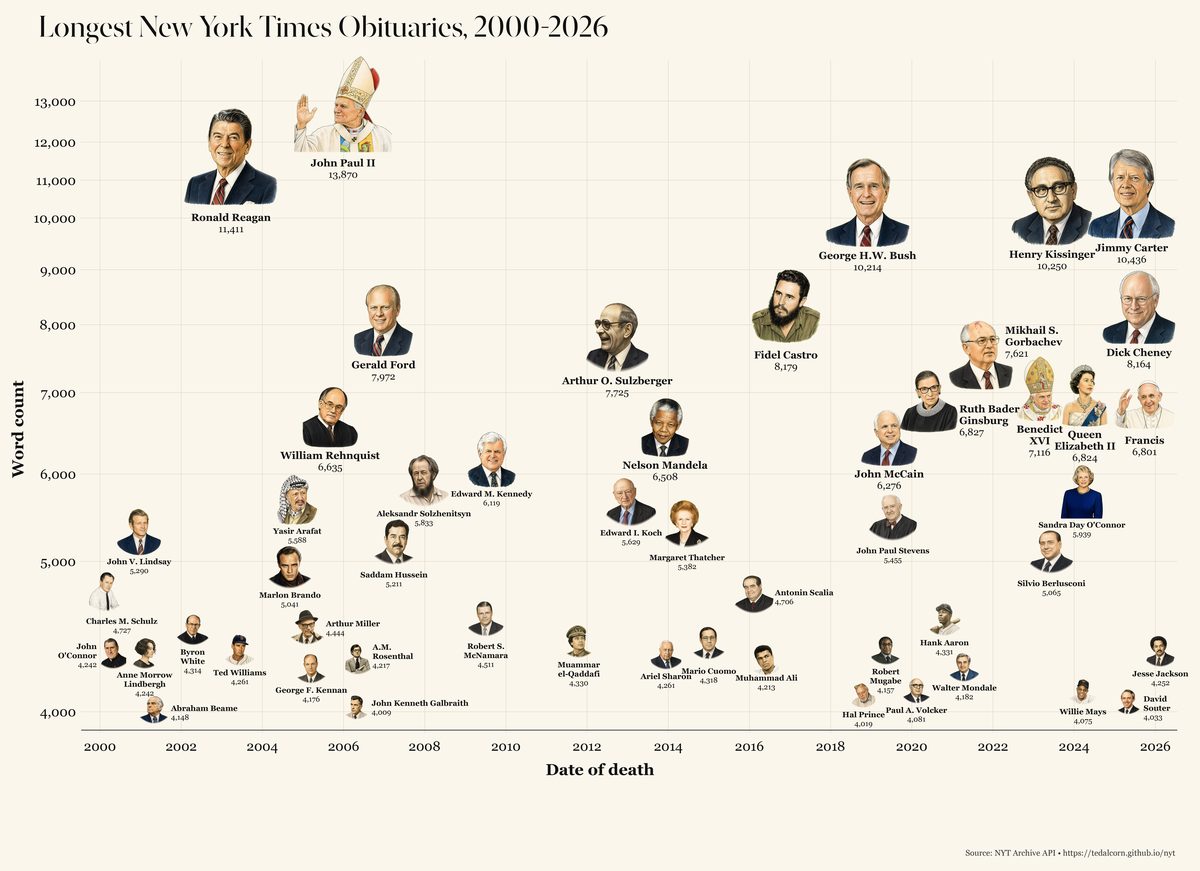
Who makes history?
Of more than 29,000 obituaries since 2000, only 52 exceeded 4,000 words.
Data source
The New York Times Archive API indexes all document types published on nytimes.com — news, opinion, reviews, obituaries, and interactives — and this dashboard includes all of them.
Articles and words per month
That includes both standard articles and blog content, like those hosted at subdomains blogs.nytimes.com, dealbook.nytimes.com, and krugman.blogs.nytimes.com. Blog posts were typically much shorter (averaging 100–460 words vs. 600–900 for non-blog articles), published in higher volume, often without an author name attached. The posts from blogs (ArtsBeat, CityRoom, The Caucus, The Lede, Economix, Bits, Wheels, Fifth Down, Straight Sets, and more) peaked at nearly 56% of all indexed articles in 2009. Blog indexing then declined steadily as the NYT wound down its blog properties between 2013 and 2018; by 2019, essentially no content is published at blog subdomains.
Content from The Athletic is not available in the Archive API and is therefore absent, which is why Sports coverage appears to decline sharply after the NYT's 2022 acquisition of that publication.
Authors
Author name variants are merged when they likely refer to the same person. For example, "Jonah E. Bromwich" and "Jonah Bromwich" are treated as one byline when first and last names match and middle names are compatible. Cases where the same reporter has many articles under both a shorter and a fuller form are reconciled manually after cross-checking beats, sections, and year ranges.
Institutional bylines — The Associated Press, The Editorial Board, Reuters, and similar non-person attributions — are excluded from author rankings, because they don't represent individual reporting output.
Staff versus freelance status and role (reporter, editor, photographer, critic, etc.) are drawn from each reporter's NYT bio page where available. For reporters who lack a custom bio page, no classification is given.
Words
The API includes a word count of each article, but has some anomalies. Interactive and multimedia pieces including data visualizations and photo essays are typically indexed with a word count of zero, even when they contain substantial reporting. Interactives make up roughly 10% of New York Times Magazine items in the API and a growing share of digital-native journalism. Word-count statistics for sections with heavy interactive output (Magazine, Upshot, Visual Investigations) and for individual authors who shifted toward multimedia formats therefore understate actual editorial output. Articles with a word count of 0 are excluded from average word count calculations per reporter and per section, on the assumption that they represent missing data rather than genuinely empty articles.
In reporter profiles, three short-form content types are tracked separately, shown in light yellow on the Articles per Year chart, and excluded from average word count: blog posts (hosted at *.blogs.nytimes.com subdomains, DealBook, and the 2014–2016 First Draft political blog); /live/ news-blog updates — short real-time entries contributed to breaking-news live streams, averaging ~500 words; and briefs — identified by the API's type_of_material="Brief" tag, used 2006–2018 for World Briefing, Arts Briefly, National Briefing, and similar short dispatches averaging ~130 words.
The NYT has also indexed podcasts inconsistently over time and across shows: some episodes are entered with a full transcript as the article body, while others appear only as short landing pages. The same show can switch policies — The Ezra Klein Show, for example, was indexed as ~400-word descriptions through 2023 and then as full transcripts beginning in 2024, while The Daily has remained short summaries throughout. Word-count trends for podcast contributors are therefore often not comparable between reporters or across years. For purposes of the reporter profiles in this dashboard, a podcast episode is identified by any of: the article's section being "Podcasts," a URL path containing /podcasts/ or /audio/, or the article's kicker matching a known NYT show title — separating true episodes from news articles that merely reference a podcast.
Beats
The beat topics shown on reporter profiles are derived from the NYT's own subject tags. When a reporter covers a subject twice as frequently (as a share of their overall coverage) as the newspaper as a whole, and has written a minimum of two articles about the subject, it is classified as a beat. Authors with few articles, or few articles carrying subject tags, may have no beats listed.
Sections
The NYT has renamed, merged, and discontinued sections over the years. To preserve thematic continuity, this dashboard applies the following merges:
- "Week in Review" → Sunday Review
- "Fashion & Style" / "Fashion" → Style
- "Business Day" → Business
- "Guides" → Guide
- "Book Review" → Books
- "Gameplay" → Crosswords & Games
- "Great Homes & Destinations" → Real Estate
- "At Home" → Style
- "Critic's Choice" → Arts
Technical categories, product sections, branded-content labels, and small stubs — newsletter and podcast aggregators, discontinued apps, TV tie-ins, blogs without a clear section home — are excluded entirely from the Sections tab. This includes "Archives" (predominantly paid death notices), "Booming" (a 2012–2014 baby-boomer lifestyle blog), "UrbanEye" (a NYC events newsletter), and "Guide" (a going-out listings service).
Authors are assigned a primary section based on where they have published the most articles over their full career in the dataset; this is used to sort and filter the Reporters table. Author profiles also list every section in which the author has published, reflecting the full range of their work. Primary section is a rough proxy for desk assignment and may be inaccurate for reporters whose focus shifts across years.
Geography
Analysis of national coverage draws from articles in the "U.S." section and the "New York" section. Many articles in the latter section lack geographic tags, however, and are not included in the analysis. Locations internal to states (e.g., "Chicago") are mapped to their parent states.
Analysis of international coverage draws from articles in the "World" section. Articles with geographic tags that appear in other sections (Opinion, Business, etc.) are not included.
Population data for per-capita calculations come from the 2020 U.S. Census. Country populations come from the Natural Earth 110m Cultural Vectors dataset (the POP_EST field, which aggregates UN and World Bank figures).
For each state, the popup lists the subjects that appear disproportionately in that state's coverage compared to the paper as a whole. Generic items every state has — election machinery (Elections, Senate, Elections, Governors, etc.), local government (Mayors, Governors (US), District Attorneys), and broad federal-government tags (Federal-State Relations (US)) — are excluded, since their presence in a state's coverage is more often driven by an occasional standout race than by anything genuinely recurring. Each remaining tag is then scored by how much more frequently it appears in the state's articles than in the corpus overall. The top ten by score are split into two columns. Headline events are subjects whose tag names refer to a specific dated incident (e.g. Hurricane Sandy (2012), Newtown, Conn, Shooting (2012), Storming of the US Capitol (Jan, 2021)). Recurring themes is everything else, capped at seven. The classification is based on tag-name structure rather than on when coverage clusters — a topic that became prominent in a single year (such as In Vitro Fertilization in 2024 after the Alabama Supreme Court ruling) is still a recurring theme, not a headline event.
Obituaries
A number of steps were taken to identify all obituaries. Records were included if the API tagged them type_of_material as Obituary (in any of its variants), filed them under the Obits desk or Obituaries section, or assigned them to the 9/11 Portraits of Grief series. Year-end roundups, paid memorial notices, and multi-subject features were excluded.
Obituaries that appear to have run at distinct URLs within a few days of each other were then merged into a single canonical entry.
Each obituary was parsed for name, age, gender, and profession from the headline and abstract, relying on honorifics (Mr./Mrs./Sir/Dame) and pronouns (he/his vs. she/her) the paper used. Special series including Overlooked No More (retroactive obituaries for historically overlooked figures), historical obituaries republished for special occasions like Women's History Month, and the 9/11 Portraits of Grief feature were also tagged.
The Portraits of Grief series ran from September 2001 through 2002 and ultimately included roughly 1,910 individual portraits of 9/11 victims. Only ~400 are individually URL-addressable in the Archive API; the remainder were either bundled into daily compilation articles or are not separately indexed, so this dashboard surfaces only the subset the API exposes as standalone records.
Corrections
The Times publishes a digest of its corrections each day at a stable URL under pageoneplus, and this dashboard scrapes every such digest the Archive API has tagged as a Correction since 2014. Each individual correction blurb is pulled out of the digest page, and where the correction itself links to the article it concerns, that link is followed; otherwise the matcher uses topic-keyword overlap and the correction's date phrase to find the most likely article within a few days of when it ran. About 99 percent of the roughly 17,700 corrections in the dataset are linked back to a specific article.
Each correction is also tagged with a few quality signals. The day of the week the correction cites ("An article on Friday about…") is converted into a likely print date and compared to the matched article's online pub date, which lets the dashboard flag matches where the two dates disagree by more than a few days. The word count of the correction blurb itself is recorded as a way to spot truncated or unusually long entries. These flags surface candidates for manual review and feed back into the matching pipeline.
The per-100-articles view divides correction counts by the total number of articles published by that section or reporter in the same year, drawn from the same Archive API used elsewhere on this dashboard.
API anomalies
Known quirks in the Archive API data, in chronological order. Where this dashboard applies a correction, it's noted explicitly.
- 2001–2003 — D.C. tag inflation. In the aftermath of September 11, the NYT's metadata system appears to have applied a Washington, D.C. geographic tag as a proxy for national-significance stories — stories that would not normally carry a geographic tag at all. D.C.'s share of World and U.S. section articles spiked from roughly 0.1% in 2000 to over 6% in 2001, then gradually returned to normal by 2003. The original metadata has been retained rather than corrected, as any automated fix would be speculative.
- 2005 — Science section drop. Section "Science" falls from ~900 articles a year (2000–2003) to 159 in 2005, then rebounds to 839+ in 2006. The articles didn't disappear — the metadata transitioned. In 2003, all 904 Science Desk articles carried
section_name = "Science". By 2005, the same desk's output was being filed as "Health" (411 articles), "Opinion" (331), or left untagged, with only 102 still tagged "Science". A new "Health" section was being broken out at this point. The dashboard shows the unedited tag. - 2006–2009 — URL duplication. Beginning around May 2006, the NYT introduced a slug-based URL format alongside its old date-coded URLs, causing the API to index many articles twice. Blog posts and DealBook articles cross-posted to the main site in 2008–2009 were also frequently indexed under two or three URLs simultaneously. This dashboard removes duplicates that share the same headline, publication date, and word count (within ±10%), keeping the shortest URL — about 62,000 entries in total, concentrated in 2006 and the 2008–2009 period of peak blog activity.
- 2007 — short-item indexing. Particularly prior to 2007, but in some cases after, the API indexed short-form items (letters to the editor, Metro briefs, calendar listings, bulleted business news), then abruptly stopped. During earlier eras, many sections had a large share of 0–400 word articles: Business 2000–2010 (47–62%); New York 2000–2006 (~45%); Magazine 2000–2003 and 2011 (45–51%); Theater 2007–2010 (38–47%); Education 2010–2016 (58–66%); Automobiles 2007–2012 (39–54%); Your Money 2010–2013 (37–53%). Median article word count jumps from about 550 to 660 words at the January 2007 breakpoint, consistent with many short items being dropped from the index after that point.
- 2008–2010 — Arts blog burst. ArtsBeat and adjacent Arts-desk blogs were briefly indexed under
section_name = "Arts", producing a sharp 2008–2010 spike of sub-200-word entries (40% in 2009 vs. ~10% in adjacent years). Most are short blog posts linking out to other coverage. Same root cause as the 2009 blog-labeling shift, with a wider time window for Arts specifically. - 2009 — blog labeling shift. A mid-year spike and abrupt drop in November reflect the API briefly assigning a generic "Blogs" section tag to posts that had been filed under their parent sections (Sports, Arts, etc.).
- 2005 — Movies section dip. Only ~60 articles, compared to 1,400–2,200 in other years. Film coverage that year appears to have been filed under Arts rather than Movies in the API's metadata. This dashboard estimates approximately 795 additional movie reviews that year by identifying Arts-section articles written by core movie reviewers (A.O. Scott, Manohla Dargis, Stephen Holden, and others who published 20+ film reviews in 2004 or 2006) that carry motion-pictures subject tags. These inferred articles appear as a hatched bar in the Movies section detail chart.
- 2001–2015 — obituary section tagging. Throughout this stretch the NYT filed most obituaries under subject sections (Arts, Sports, Business, etc.) rather than tagging them "Obituaries" by section. In 2001–2010 the desk relied on type_of_material "Obituary; Biography" (or "Obituary"); in 2011–2015 it switched to "Obituary (Obit)". This dashboard overrides the section tag for all four obit-tom variants and counts those articles under Obituaries, producing a continuous series rather than a gap. The 2018–2019 spike reflects the launch of the "Overlooked" project — retroactive obituaries for historically overlooked figures, begun on International Women's Day 2018.
Coverage Over Time
Coverage by Subject
Persons and organizations drawn from NYT keyword metadata. Check names to compare coverage over time; click a name to see details.
Type:
Find Reporters by Beat
Search NYT subject tags to find which journalists cover a topic. Tags are drawn from the NYT's own metadata.
Compare Sections
Major editorial sections; some renamed or merged sections are combined.
Hold Cmd/Ctrl to select multiple sections
Coverage by Section
Features
Recurring columns and special coverage that span sections or don't fit neatly into the section taxonomy.
Compare Country Coverage
Hold Cmd/Ctrl to select multiple countries.
Coverage by Country
Draws on geographic tags from NYT metadata exclusively in articles from the "World" section. Tagging coverage appears to have been less consistent in 2000–2003.
Compare State Coverage
Hold Cmd/Ctrl to select multiple states
Coverage by State
Draws on geographic tags from NYT metadata in the "U.S." section and, optionally, "New York" section to encompass local coverage.
Obituaries
Every Times obituary since 2001, with name, age, gender, and role parsed from the API.
Loading obituary data…
Corrections
Every correction the Times printed since 2017, linked to the underlying article.
Loading corrections data…