Please note that text below has been translated from the spanish version by using AI
Hello everyone and welcome back to Solarletter. My name is Imanol Matanza, and I aim to share with you the latest news, technological advancements, and trends in the field of photovoltaic energy. Through Solarletter, I hope to provide you with valuable information, market analysis, state-of-the-art updates, and practical tips that will help you stay informed about the latest developments in the photovoltaic industry.
I am late publishing the Solarletter again. But this year has been pretty busy. I got married this summer, we bought a house, and the projects are constantly on the rise. After this vacation, we will have something new, so if you do not want to miss it, do not forget to subscribe.
I am always open to suggestions, questions, and comments, so please feel free to contact me. If you like it, don't hesitate to subscribe and share!
Alright, let us go with a couple of interesting pieces of news!
The other day I was shared an interesting LinkedIn post by Zach Williams in which he discusses and compares the cannibalization of solar photovoltaic energy in the electricity markets of Spain and Germany, two countries that I follow very closely. For those who do not know me yet, I am from Bilbao, but I have been living in Germany for 7 years, currently in Frankfurt.
The post summarizes an article published in Modo Energy. It states that installed solar capacity in Germany has surpassed 100 GW. However, summer peak demand rarely exceeds 60 GW. On sunny days, solar floods the market and pushes prices down.
The impact is already visible on the economics of projects that operate under merchant conditions (without guaranteed tariffs). However, they are saved by the fact that 90% of projects in Germany rely on subsidies similar to feed-in tariffs, and those payments are covered by the federal budget.
The solar capture rate fell from 98% to 54% in less than three years. The solar capture rate measures the average price that solar generators receive in relation to the average market price.
Let me make a brief note here. For those reading from Spain, the term apuntamiento fotovoltaico might sound more familiar. Both indicators are used to show the same thing: the cannibalization of solar energy prices. In Solarletter #22, we already discussed these terms for the first time.
So far in 2025, that value has been around 54%, far below the 98% registered in 2022.
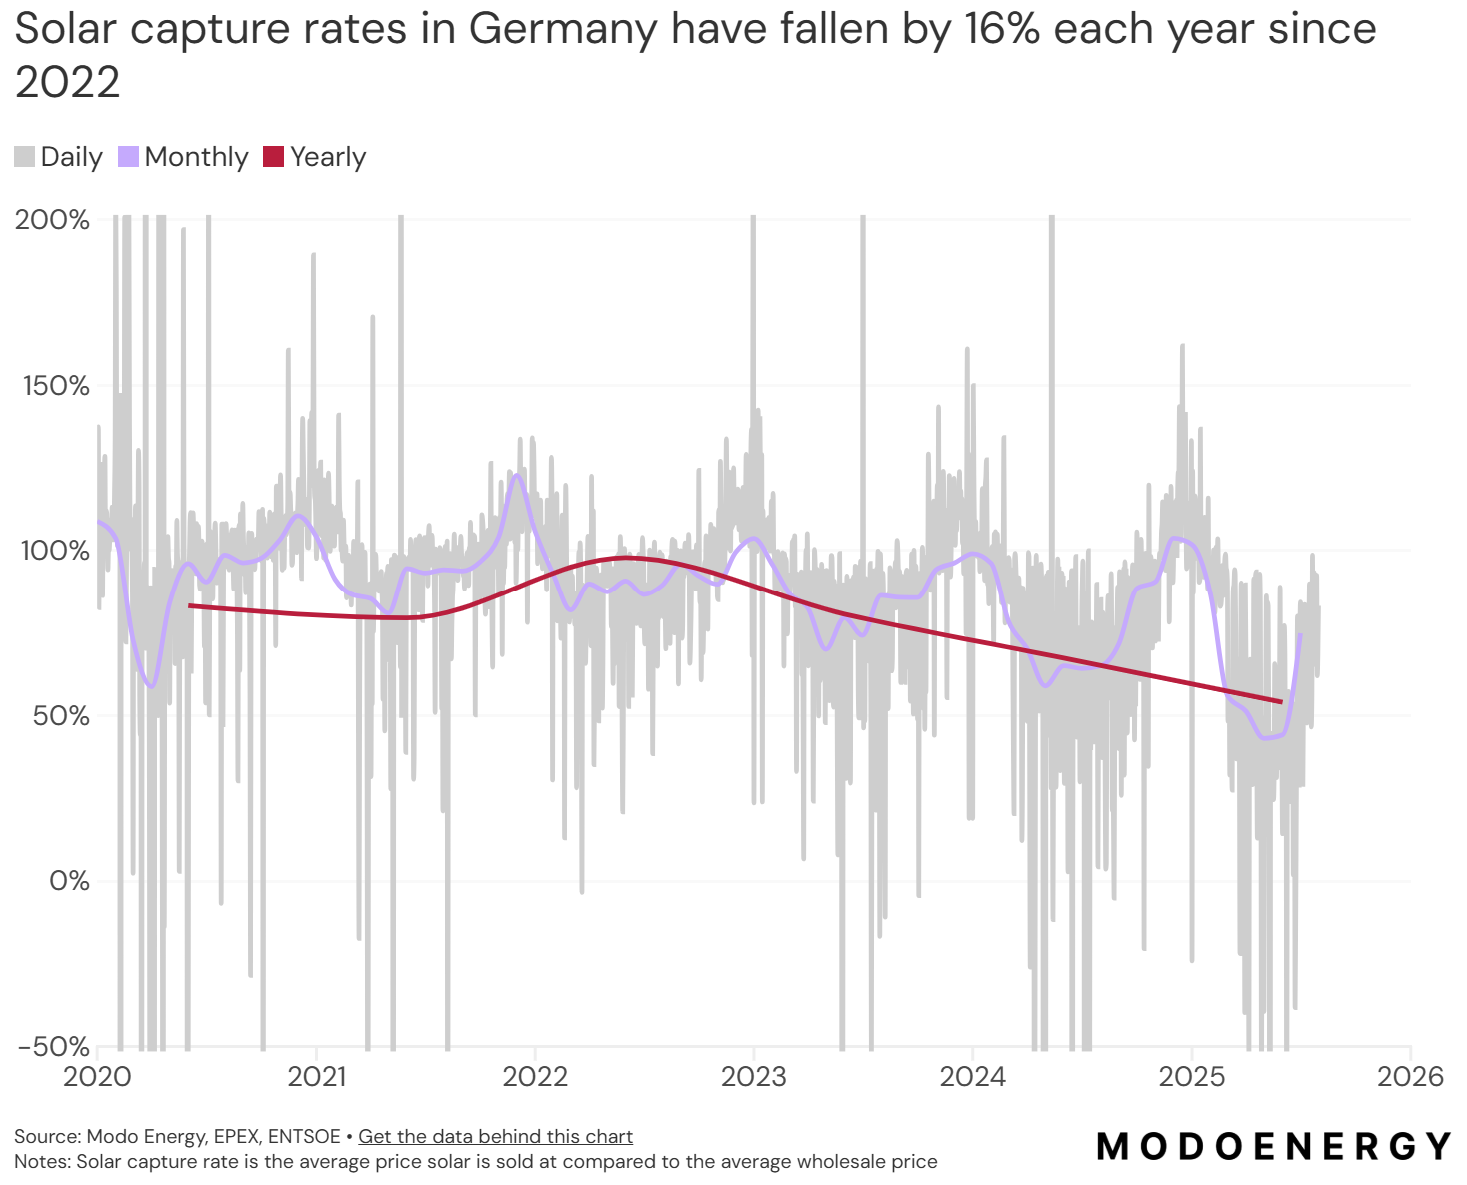
A clear seasonal pattern can be observed: in May and June, monthly capture rates fell as low as 0.43 and 0.44.
Part of the problem lies in Germany’s geographical situation. Its latitude means that most of the generation is concentrated in the summer months. Last year, 43% of solar production was concentrated in just three months: June, July, and August. Given the design of south-oriented solar panels and Germany’s latitude, each gigawatt installed produces much more during summer.
Additionally, midday demand has been falling by about 1 GW per year, while solar production has been increasing by nearly 3 GW.
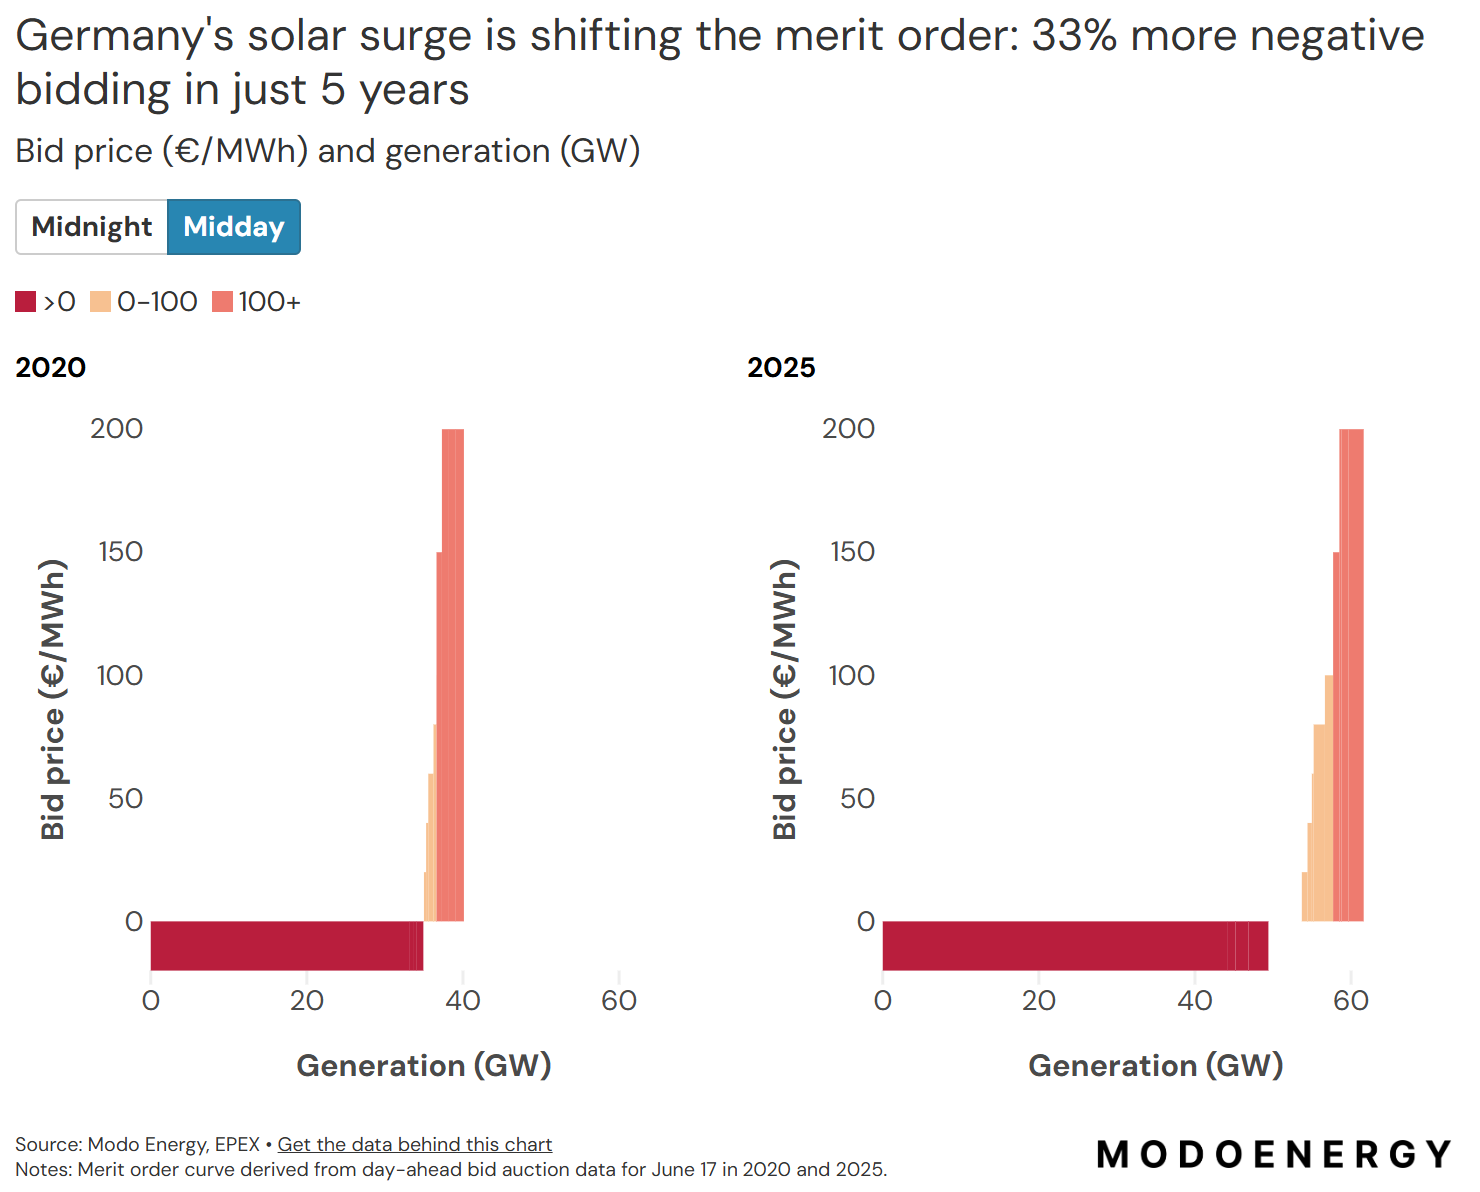
The German day-ahead market functions through a pay-as-cleared auction, meaning it is a marginal market just like the Spanish one. Generators bid based on their costs, and the cheapest are accepted until demand is covered. In the end, all generators receive the same price as the last accepted bid that met demand.
The market floor price can fall as low as -€500/MWh. Yes, you read that correctly, bids can be submitted with negative prices. Subsidized renewables and must-run assets (such as nuclear) usually bid at that price to ensure their production.
What is incredible is that in the last five years, around 11 GW of additional capacity has been added that bids at negative prices during the day.
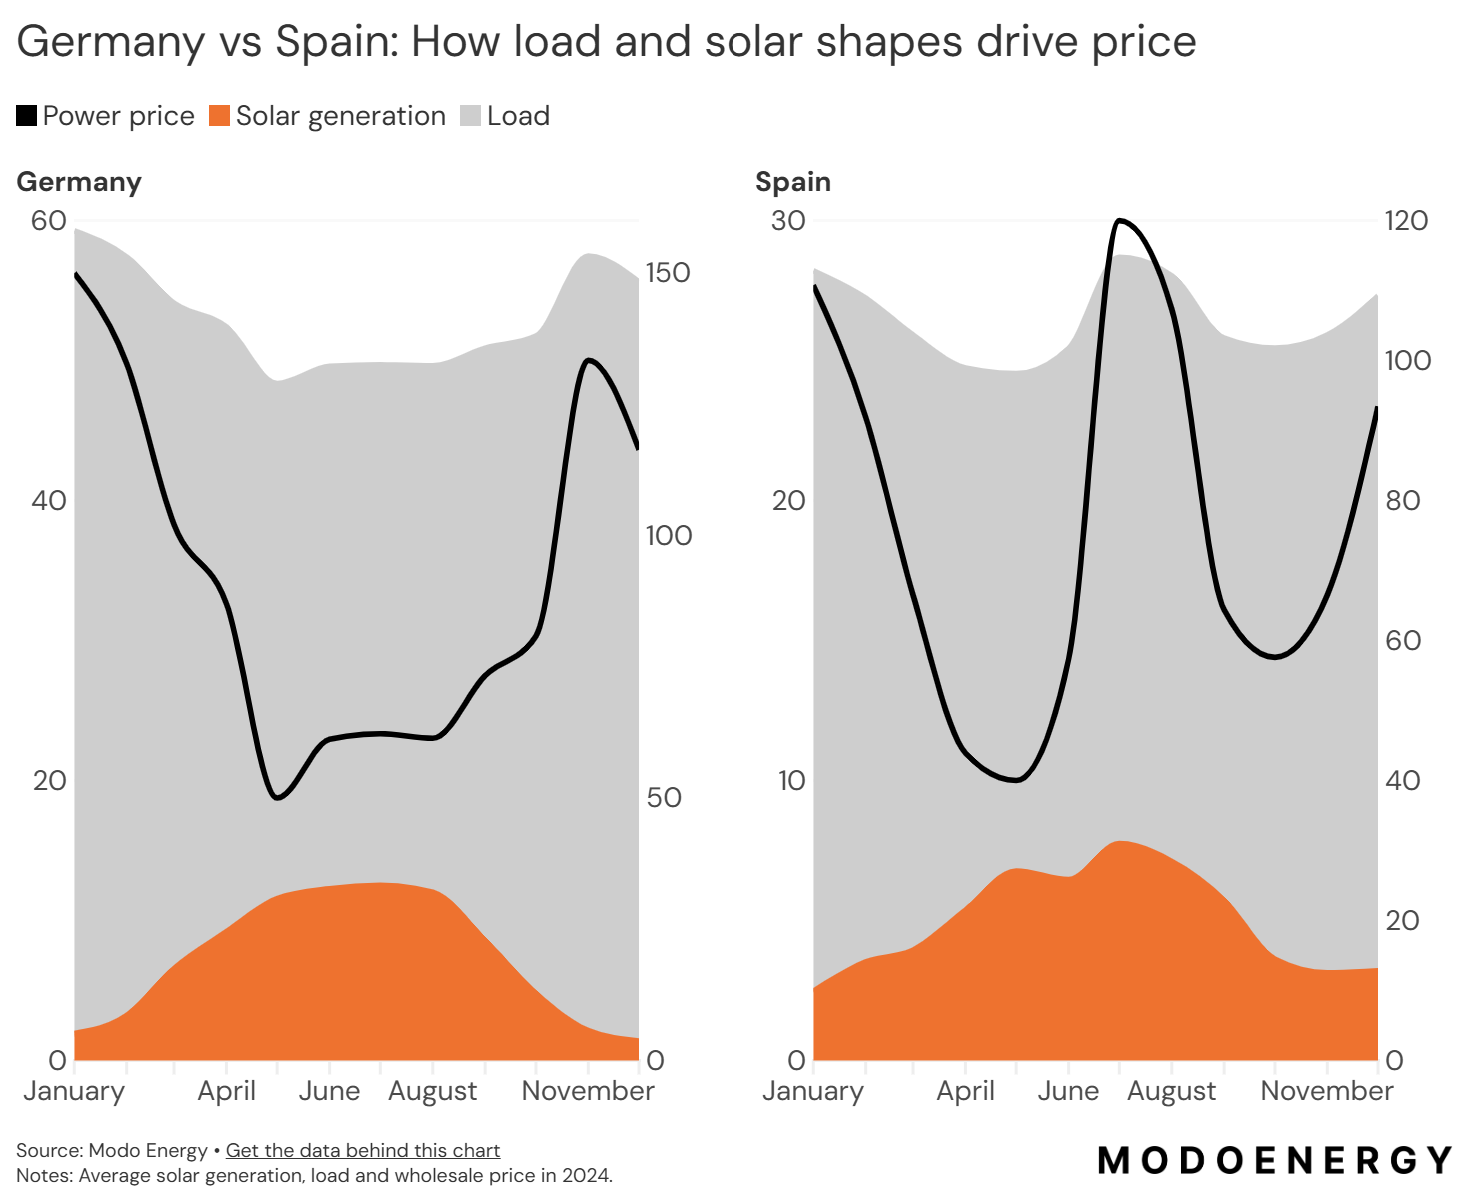
Spain covers 18% of its demand with solar energy, while Germany only 10%. Even so, capture rates are almost identical. The difference lies in seasonality and demand patterns:
In Spain, the production profile is flatter and demand grows in summer due to the need for air conditioning.
In Germany, peak production falls in summer months, when demand also falls.

Why does Germany continue to build solar projects even though returns are shrinking? As mentioned above, more than 90% of plants operate with feed-in tariffs or guaranteed market premiums, ensuring revenue even when prices collapse.
Furthermore, since 2017, new capacity has come through auctions or PPAs. (In Solarletter #13 we showed how in 2023, Germany was already the second EU country for this type of agreement) However, as capture rates decline, the gap between actual project revenues and what subsidies cover grows. This creates pressure to reform subsidies and positions storage as a central piece for future viability.
Germany’s 2030 target is to reach 215 GW of installed solar capacity. In other words, this can only get worse. Batteries appear to be the inevitable answer: storing cheap midday energy to deliver it at times of high demand.
For consumers, storage can mean lower costs if done properly. For investors, it provides the security that the market no longer guarantees.
CITE25 Congress – The meeting point for the renewable energy industry
Pamplona will host the 4th International Congress of the Industry for the Energy Transition (CITE25), organised by Enercluster, on 23 October.
The congress will focus on key technologies such as wind energy, solar, storage, and green hydrogen, and will address topics like the challenges facing Europe’s renewable industry in a global context, new national and European legislation, technology trends, and the relationship between renewables and society.
You can check out the list of speakers here and the full agenda here. All the latest updates about the event are also being shared via the CITE Congress LinkedIn page.
🎟️ You can get your ticket by clicking on the banner just below.

_
ib Vogt in Spain has reached a new milestone with the signing of the PAC (Provisional Acceptance Certificate) for three of its projects within the Segovia Cluster (shared on LinkedIn), the largest solar complex developed by the company in the country to date. These projects include Castaño Solar (133 MWp), Baobab Solar (95 MWp), and Pato Solar (110 MWp), which together contribute more than 330 MWp of capacity to the electricity system. This reinforces ib Vogt’s position as one of the major players in the Iberian market.

This success is complemented by news that highlights the importance of Operation and Maintenance (O&M) and preventive management in renewable projects. During the recent devastating wildfires that have swept across Spain, flames reached the boundaries of the Bienvenida plant, a 49 MW facility located in the province of Badajoz. Thanks to the coordinated work of the O&M team and preventive measures such as perimeter firebreaks, land clearing through the grazing of 700 sheep, and on-site firefighting equipment, the plant not only withstood the flames without damage, but also acted as a barrier, preventing the fire from spreading to nearby infrastructure. A video of this has been shared on LinkedIn.
This underscores the importance of integrating sustainability, prevention, and safety into every phase of a solar or renewable energy project. Many of you may have heard the myth of wildfires being linked to renewable energy development. For further reading, here is an article by Sergio in Windletter #118.
_
A few days ago, while browsing LinkedIn, I came across a post by Gang Wang, which was shared with me by Sergio Fernández, that included a video about an alleged “2 GW intertidal solar PV project in Pingyang, Wenzhou (Zhejiang).” Intrigued, I began to investigate further in order to confirm the information.
What I found is that indeed, there is a photovoltaic project in the tidal zone in Pingyang (Zhejiang), as reported by the local press In Zhejiang. It is an innovative installation due to its location, where the solar panels are surrounded by water when the tide rises. However, the capacity of the project is far more modest than the 2 GW mentioned on LinkedIn. Based on the information available, it is closer to one tenth of that capacity.

The Pingyang plant is relevant due to its pioneering nature, but it does not appear to reach the scale that was claimed.
Following the trail, I was led to a completely different development: the 2 GW offshore project announced in 2024 by the China National Nuclear Corporation (CNNC), also located in Zhejiang. This project does match the scale of a megaproject and is designed to be installed offshore, with the potential to become the largest marine photovoltaic plant in the world.
Nevertheless, the most solid reports (from Power Technology, Global Times) date back to mid-2024, and I have not found updates regarding its construction status or commissioning. My impression is that the LinkedIn video conflated two different realities: the existing intertidal project in Pingyang, which is smaller in scale, and the 2 GW offshore project in Zhejiang, which remains in the development stage.

Beyond this specific case, what is clear is China’s ambition for marine solar energy. The province of Jiangsu launched a plan in early 2025 to develop 27.3 GW of offshore photovoltaics, becoming the first region in the world to establish such a large-scale strategy for a type of solar project that remains relatively unexplored but holds significant potential (PV-magazin).
_
Let us take a look at a ranking of the largest maritime shipments of photovoltaic modules, created by SolarBe Global. In the first half of 2025, Jinko Solar remains the undisputed leader in the global photovoltaic market, with more than 41 GW of module shipments, consolidating its established position in the industry. The same occurred when we shared the equivalent ranking back in 2023 in Solarletter #5.
LONGi follows closely, having capitalised on the momentum of its BC modules in the distributed market and its strong capacity in tenders to strengthen its market share. Meanwhile, JA Solar and Trina Solar are in extremely close competition, to the point that they have been jointly classified in the third position, pending mid-year financial reports to determine who ultimately secures a place on the podium.
The dominance of these giants is clear: the top four companies account for more than 46.5% of global sales in the first half of the year. If Tongwei and Astronergy are included, the group of the top six surpasses 60%, a level that ensures sufficient capacity to meet global demand. By contrast, the companies ranked between 16 and 30 barely reach 11.2% of the total.
An interesting trend is that several of the highest-ranking companies have begun to reduce their shipment targets, prioritising profitability over volume. This reflects a shift in mindset within the industry, which is beginning to place greater emphasis on long-term development. Ultimately, the real competitiveness of Chinese photovoltaics is not measured solely in gigawatts, but in the ability to sustain solid and balanced growth over time.
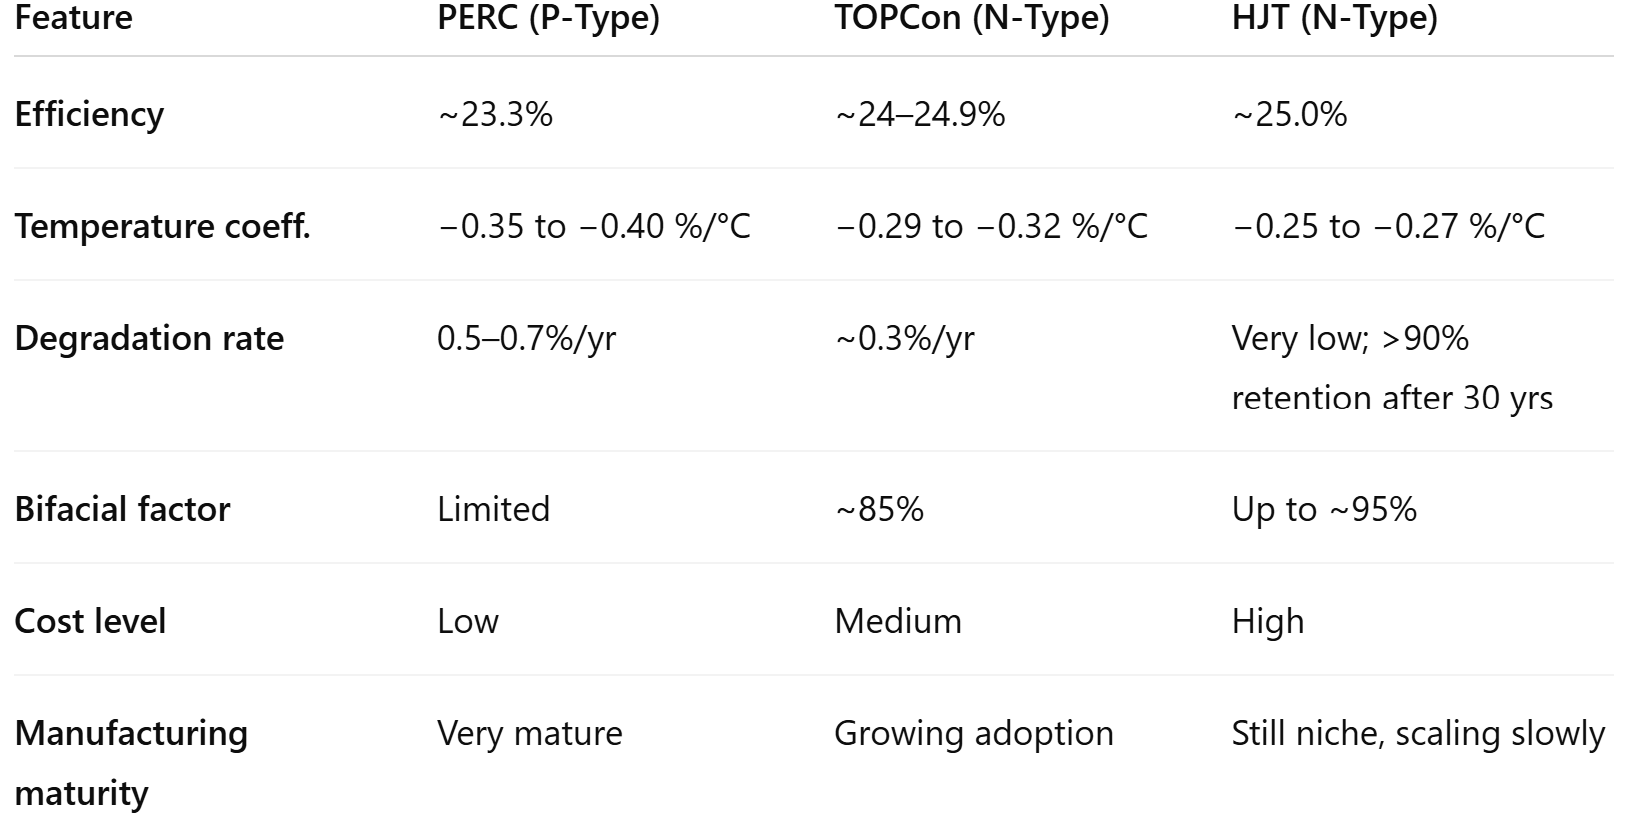
The photovoltaic market is undergoing a clear transition: moving away from P-Type cells, which dominated the past decade, and giving way to N-Type cells, which are more efficient and durable. But what does this mean in practice, and what are the differences between technologies such as PERC, TOPCon, and HJT?
P-Type cells are manufactured with boron-doped silicon and form the basis of the well-known PERC technology. They are characterised by low cost and mass production, but they face issues of light-induced degradation (LID) and lower resistance in warm climates.
N-Type cells, doped with phosphorus, do not suffer from these problems and offer better temperature coefficients, lower annual degradation, and higher efficiency. They form the basis of the most advanced technologies such as TOPCon and HJT.
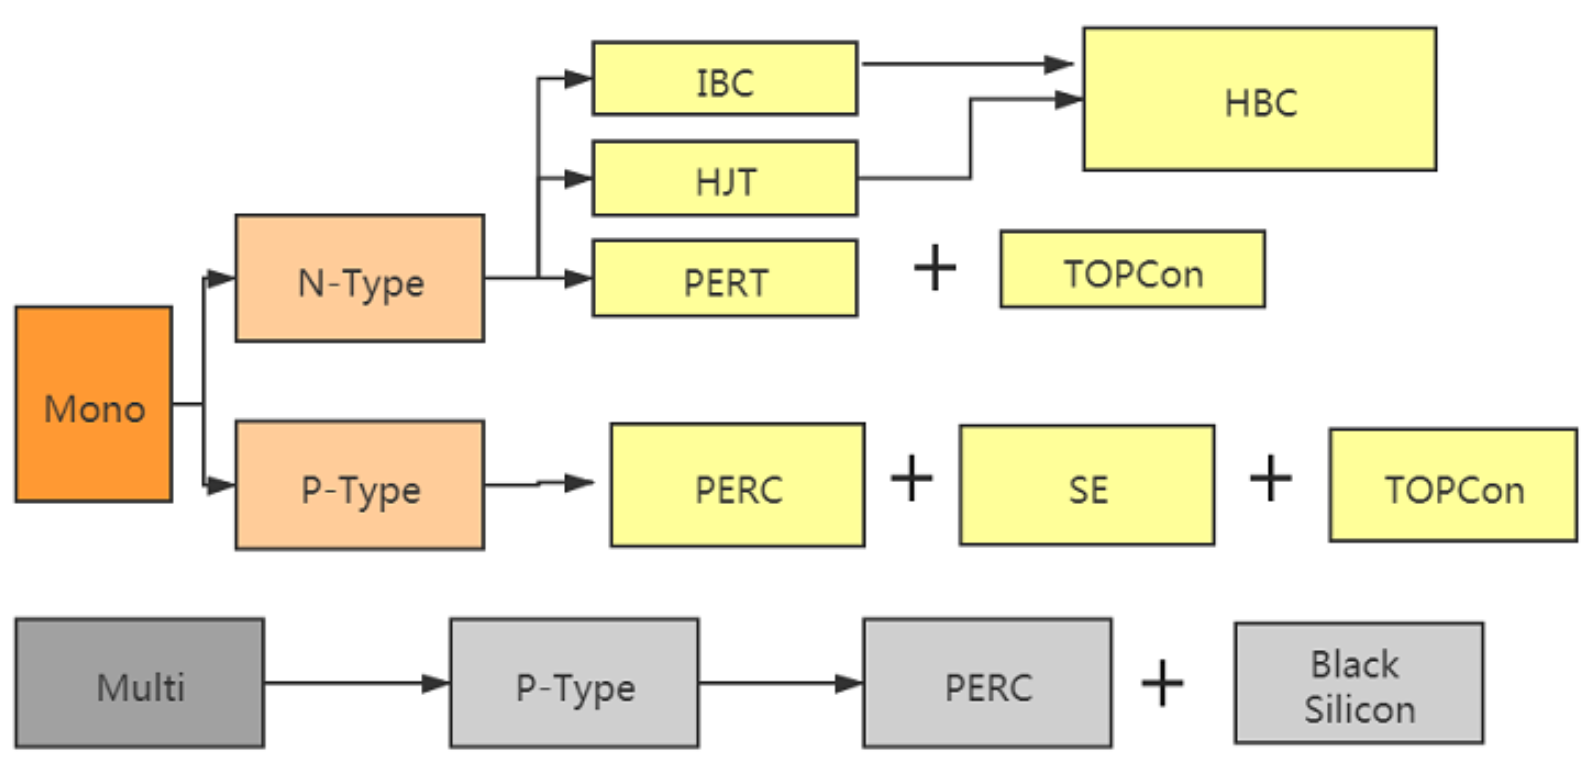
Here are the main technologies in the market:
PERC: the economical option, widely adopted in the market. Good performance, but higher degradation and shorter lifetime.
TOPCon: the “middle ground” solution. High efficiency (24–25%), low degradation, and lower costs compared to HJT.
HJT: the technological benchmark. Efficiency up to 25%, excellent temperature coefficient, and a lifetime of more than 30 years with over 90% capacity retained. Its challenge lies in manufacturing cost.

That concludes the edition. I hope you enjoyed and it made your coffee break, public transportation ride, or nap more enjoyable. If you have any suggestions, recommendations, or comments, feel free to reply to this email.
If you liked it, help me give it a boost by sharing it on your social media, with your friends, or coworkers. And if you did not like it, I apologize, but returns are not accepted.
Thank you for reading Solarletter. This post is public so feel free to share it.
Sunny Regards!