The Gender Development Index (GDI), along with its more famous sibling Human Development Index (HDI) is an index published annually by UN’s agency, the United Nations Development Programme (UNDP).
How do you measure human development? Whatever you do, you will never capture all the nuances of the real world - you will have to simplify. The UNDP puts it this way:
The Human Development Index (HDI) was created to emphasize that people and their capabilities should be the ultimate criteria for assessing the development of a country, not economic growth alone.
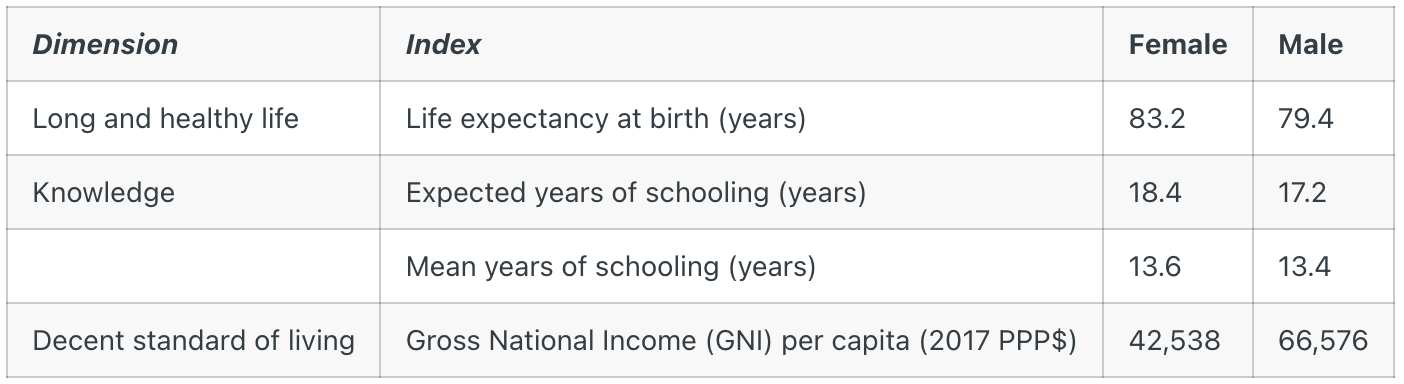
So the UNDP defines the Human Development Index as a geometric mean of three dimensions represented by four indices:
The Long and healthy life dimension is represented by Life expectancy at birth.
The Knowledge dimension is represented by Expected years of schooling and Mean years of schooling.
The Standard of living dimension is represented by Gross national income per capita.
EDIT: The Standard of living dimension is sometimes rebranded as Command over economic resources, but both terms are used interchangeably.
So far, so good. Next, the Gender Development Index (GDI) is defined simply as, I quote, “ratio of female to male HDI values.“ Let’s look, for instance, at the Gender Development Index of the United Kingdom. The value 0.979 tells us that despite living longer lives and having more education, women in the UK are less developed than men.
Source: https://hdr.undp.org/system/files/documents/global-report-document/hdr2025reporten.pdf
Wait, what? What does it mean that women in the UK have a standard of living of Poland (GNI 42,218) while men in the UK have a standard of living of Sweden (GNI 66,102)?
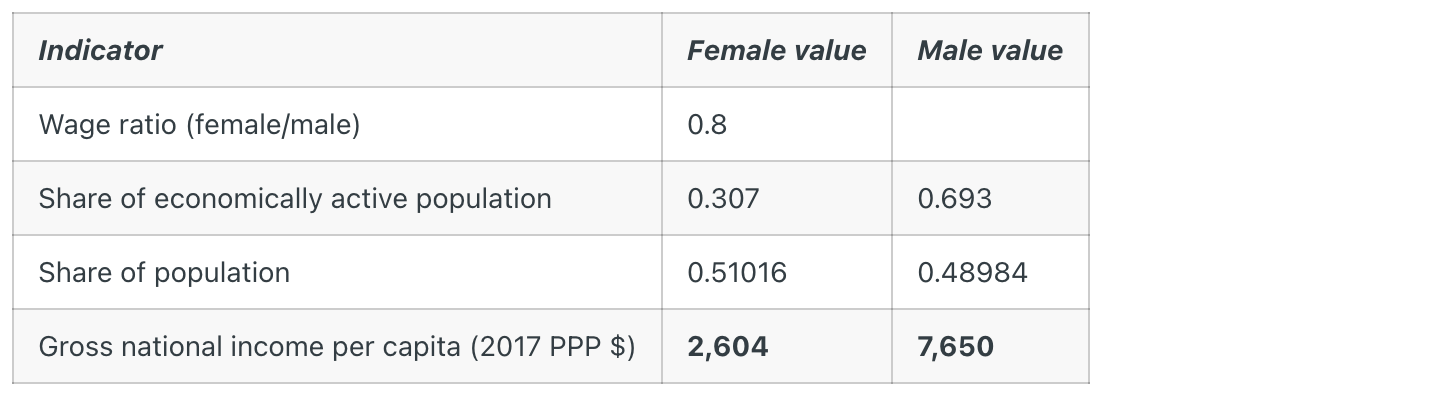
After consulting the Technical Notes PDF, we learn that UNDP calculates separate standards of living for men and women as a product of the actual Gross National Income (GNI) and two indices: female and male shares of the economically active population (the unadjusted employment gap) and the ratio of the female to male wage in all sectors (the unadjusted wage gap). Without further explanation, UNDP shifts the language from measuring the “standard of living” to calculating the “share of the wage bill for each gender”.
The UNDP provides this simple example about Mauritania from 2022:
Source: https://hdr.undp.org/sites/default/files/2021-22_HDR/hdr2021-22_technical_notes.pdf
According to this index, men in Mauritania enjoyed the standard of living of the tiger economy of Vietnam (GNI 7,867) while women in Mauritania suffered the standard of living of the failed state of Haiti (GNI 2,847).
There are two problems with using the raw employment gap and the raw wage gap for calculating the standard of living.
1) Breadwinners share income with their families
This is a no-brainer. All over the world, wives are expected to fulfill their gender role as caregivers, while husbands are expected to fulfill their gender role as breadwinners. Why these expectations exist and what to do about them is a topic for another discussion (2019 Gallup poll shows that 50% of women with children in the US would prefer to “stay at home and take care of the house and family” if they were free to choose). The point is that husbands typically don’t keep their paycheck for themselves while their wives and children starve to death. Imagine this scenario: a father from India labours in Qatar in slave-like conditions, so that his family can escape poverty. According to UNDP, the father became more prosperous, while the standard of living of his wife is equal to exactly zero.
Meanwhile: Families of Indian migrants who died in Qatar seek answers – DW – 12/15/2022
2) Governments redistribute wealth
This is a no-brainer, too. One’s standard of living is not equal to one's paycheck. There are social programs, pensions, public services. Even if you have never received a paycheck in your life, you can take public transport on a public road to the next public hospital. Judging by the Tax Freedom Day, states around the world redistribute 30% to 50% of all income. All over the world, men pay most of the taxes, and women receive most of the transfers. But according to the UNDP, women in India (female GNI 4,543) suffer in schools and hospitals of the least developed countries in the world, Senegal, while men in India (male GNI 13,273) enjoy the infrastructure and pensions of the much richer Indonesia.
There is even a bigger problem: the UNDP’s numbers on the Long and Healthy Life dimension don’t add up. I mean, literally. What you will not find mentioned anywhere in the report or anywhere on the UNDP website is that the value for male life expectancy at birth was “adjusted” upwards by five years. The only evidence is this half-sentence buried in the Technical Notes PDF:
[…], except life expectancy at birth, which is adjusted for the average five-year biological advantage that women have over men.
That is it, that is the only mention.
But wait, what five-year biological advantage? While we know the Life Expectancy Gender Gap (LEGG) around the world is approximately 5 years in favour of women, we also know that it is not caused by biology. To be precise:
50–60 % of the gap is explained by behavioral factors,
20–30 % of the gap is explained by social factors and
only about 10–20 % of the gap is explained by biological factors.
Sources: Gender differences in survival across the ages of life: an introduction | Genus, Gender Equality and the Global Gender Gap in Life Expectancy: An Exploratory Analysis of 152 Countries, Social, Behavioral, and Biological Factors, and Sex Differences in Mortality - PMC
The Life Expectancy Gender Gap has favoured women roughly since doctors started to wash their hands before childbirth. It widened dramatically with the mass popularity of tobacco among men, and has been closing down very slowly since. Yet, if a country narrows this gap down to less than five years, the GDI penalizes it for discriminating against women.
How relevant is the unadjusted employment gap and pay gap for the standard of living and human development calculation? Pensions and social security schemes do not always respect the shared family income, and as a result, women often receive lower pensions and insurance benefits. The partner doing most of the unpaid work could also be disadvantaged in the case of divorce. Statistics tell us that women are a slight majority of those affected by poverty.
But we must not jump to conclusions: the poverty gap mostly disappears when adjusting for women’s longer life expectancy. Old women are poor, old men are dead: the female poverty gap is mostly a statistical artefact. Meanwhile, single women own more houses than single men, who are an overwhelming majority of the homeless. Men do most of the paid work and suffer over 90% of all workplace-related fatalities, yet marketing agencies swear that women make three-quarters of all spending decisions. Long story short, the claim that a person’s wage bill alone defines their standard of living is indefensible. UNDP misrepresented the construct they claim to measure by operationalizing it with variables that do not validly capture that construct.
Likewise, presenting the Life Expectancy Gender Gap as something natural, caused by biology, when we have ample evidence to the contrary, is a clear instance of outcome-biased operationalization. What’s more, material “adjustment” like this must be disclosed where readers reasonably expect it, not buried in a footnote. Failing to do so is an ethical transparency violation.
Taken together, UNDP’s continued disregard of substantive criticism and its repeated use of these methodological manipulations year after year meet the criteria for methodological misconduct.
The information that young women outperform young men in education will probably not surprise anyone. Indeed, looking at the Expected Years of Schooling indicator, we can see that women lead in 71 of the top 74 countries considered Very Highly Developed by HDI. When older generations are included through the Mean Years of Schooling indicator and the full Knowledge dimension is examined, women continue to outperform men in 61 of the top 74 countries.
If women consistently outperform men in two of the three dimensions, how large is the true gender development gap? Fortunately, UNDP publishes the raw input data used to calculate the 2025 Gender Development Index. This makes it possible to apply its stated formula directly and compute the GDI simply as the ratio of female to male HDI, without dubious “adjustments.”
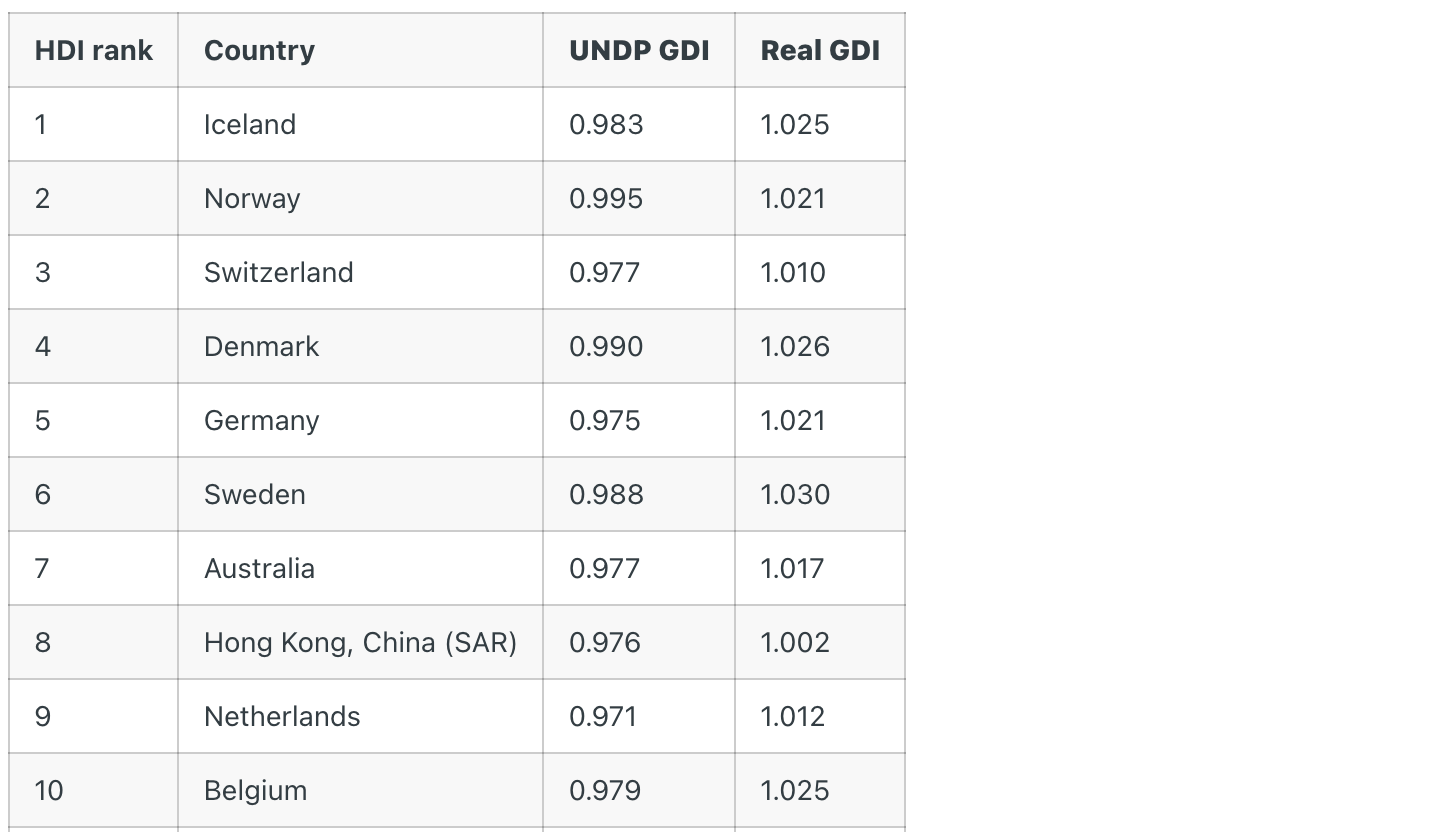
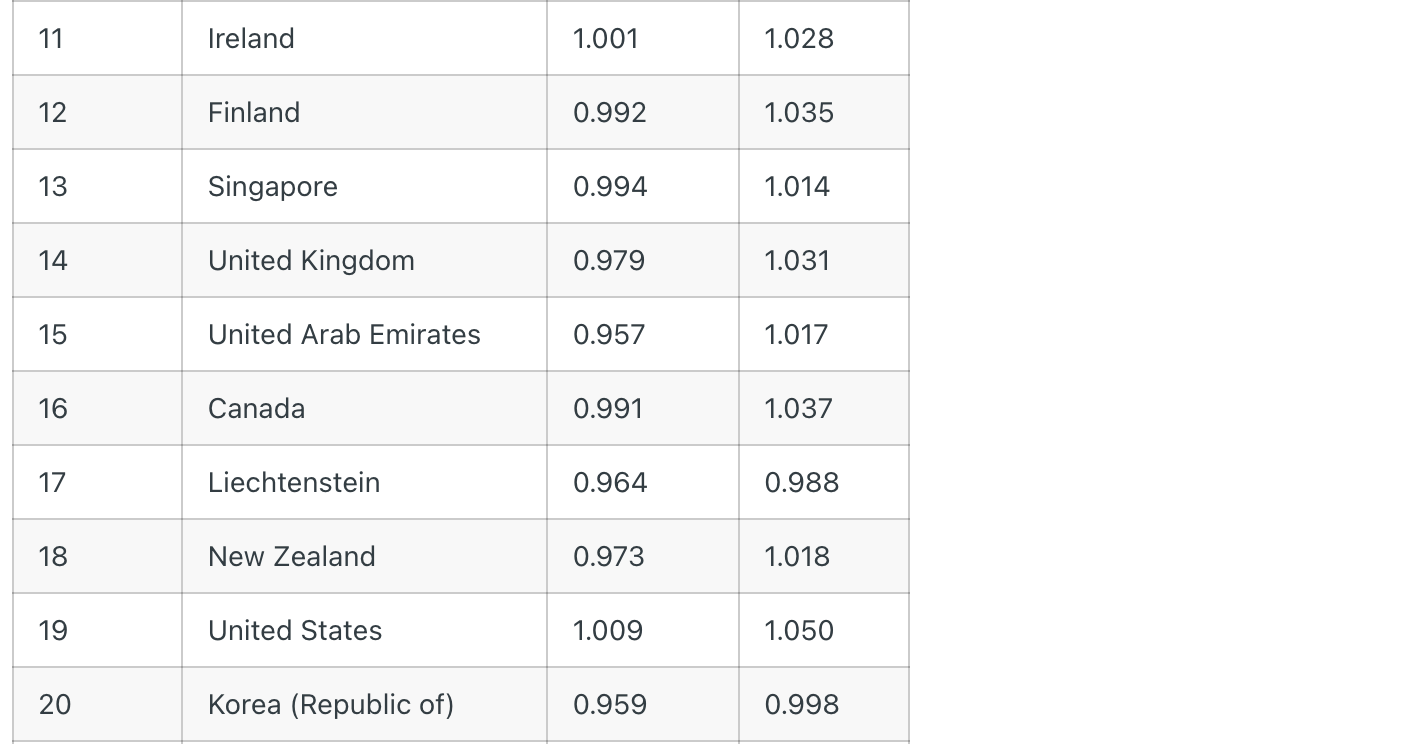
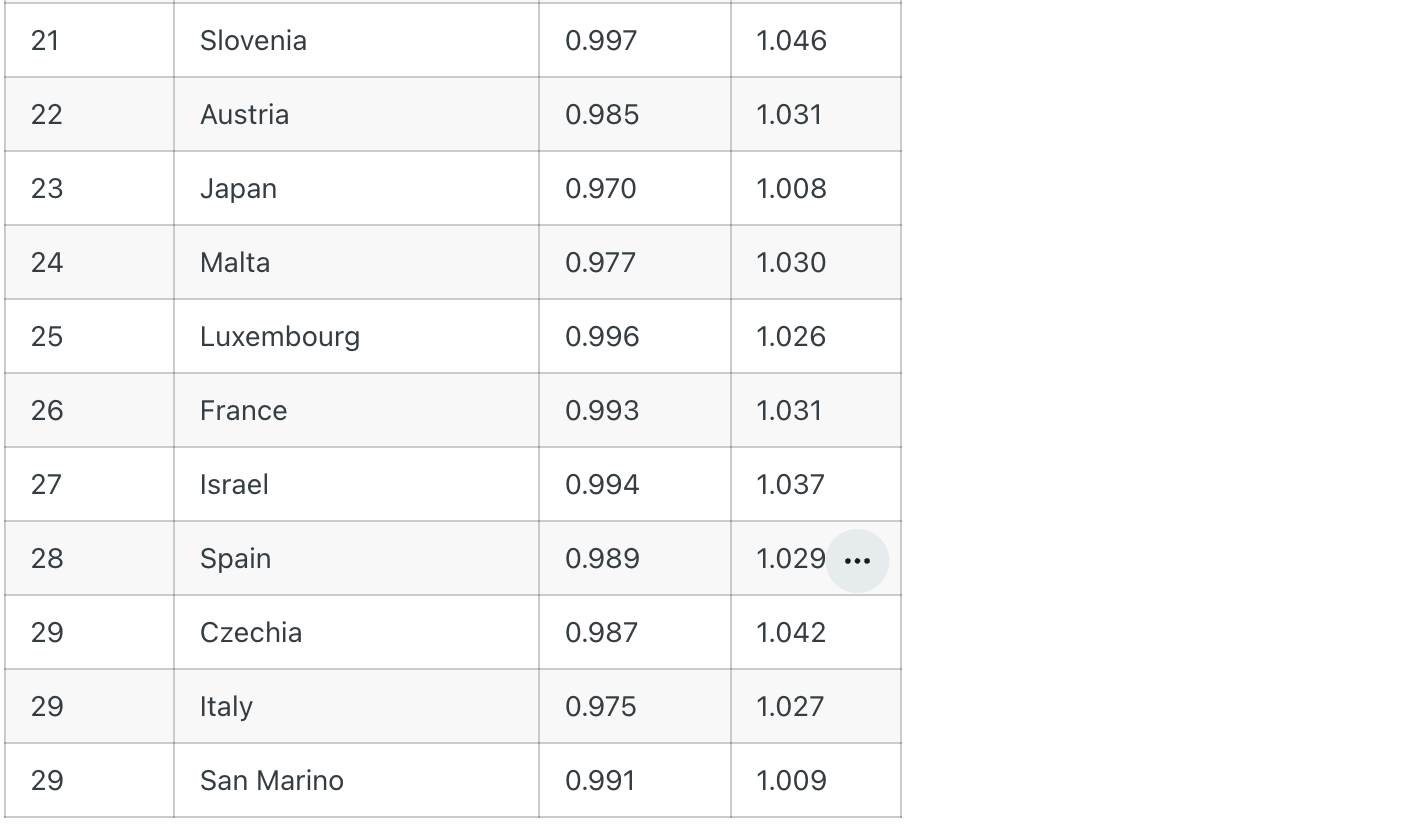
The fact that the index is greater than 1 across all developed countries points to an uncomfortable implication: that according to the UN’s own measure of Human Development, men, not women, are the less developed gender.