A tiny JSON spec in → a finished, retina-quality chart out. Native SVG in milliseconds, no headless browser, deterministic — same spec, same chart, every time — and 100% local via MCP.
Free with your agent — the MCP is free forever, unlimited. Plans only exist for hosted chart URLs.
New — Live Charts
Embed once, update forever.
A live chart is a permanent image URL whose numbers update on their own. Create it once, embed it anywhere an image works — README, dashboard, email — then push new data whenever it changes. Every copy, everywhere, updates.

This image is live. These are our real numbers, right now — npm downloads, CI, commits — refreshed automatically by a 20-line script. Nobody re-uploads this image. Yours can do this.
The whole trick, in three lines:
1 · Create — one call stores your chart and returns its permanent URL.
2 · Push — your script (or your AI agent) sends fresh numbers whenever they change.
3 · Done — every embed of that URL shows the latest data within seconds of a
push. Viewers need no key, and views are never metered — unlimited audience on every plan.
The agent is the sensor. Tell Claude — or any agent — "watch our signups and keep the chart current." No integrations, no connectors, no Zapier: the agent reads any source it can reach and pushes the numbers. If an agent can see it, your chart can show it, live.

The Pulse Deck. Every needle moves every 3 seconds — latency probes, Wikipedia's live edit stream, the ISS, markets. One image URL doing all of it.
Dashboards are dynamic tiling. Every board on this page is one JSON spec — a list of tiles, each tile a chart, each chart a span. Just tell your agent what you want on the board; it writes the spec, SlickFast renders one image.
What SlickFast is
A pure rendering primitive.
JSON spec → SVG → PNG in milliseconds. No browser, no Puppeteer, no heavy dependencies. Deterministic by design — same spec, same image, every time.
Most chart-to-image tools secretly spin up a full headless browser — hundreds of MB, slow cold starts, flaky screenshots. SlickFast renders pure in-memory: no Chromium, no GPU, no DOM, no randomness, no drift. That one decision is why it's fast enough for agents, cheap enough to cache by spec-hash, and reproducible enough to test against.
47 chart and information-design types (bar, line, pie, KPI, cards, funnel, gauge, heatmap, calendar, gantt, waterfall…), plus entire multi-chart dashboards tiled into one image in a single call. It runs as an MCP tool, so an agent hands it a spec and gets back a finished PNG (or SVG) — 100% local, nothing leaves your machine. A spec is ~40 output tokens; hand-writing chart code costs 2,000+, plus the retries when it doesn't render.
Gallery
All 47 types. Every image is engine output.
Nothing below is a mockup — each board is a single SlickFast render:
one spec, one call, many charts tiled into one image. Tiles span columns and rows
(wide, tall, hero-sized), so a board mixes big charts with small stats. Any shape, too —
one ratio field turns the same spec into a share card, a phone-portrait board,
an ultra-wide banner, or an A4 print. Click any image to view it full size.
One field changes the whole look: palette
Single charts, straight out of the engine. 6 flat palettes and 12 nested themes are built in — name one in the spec and the chart restyles itself, background to legend.
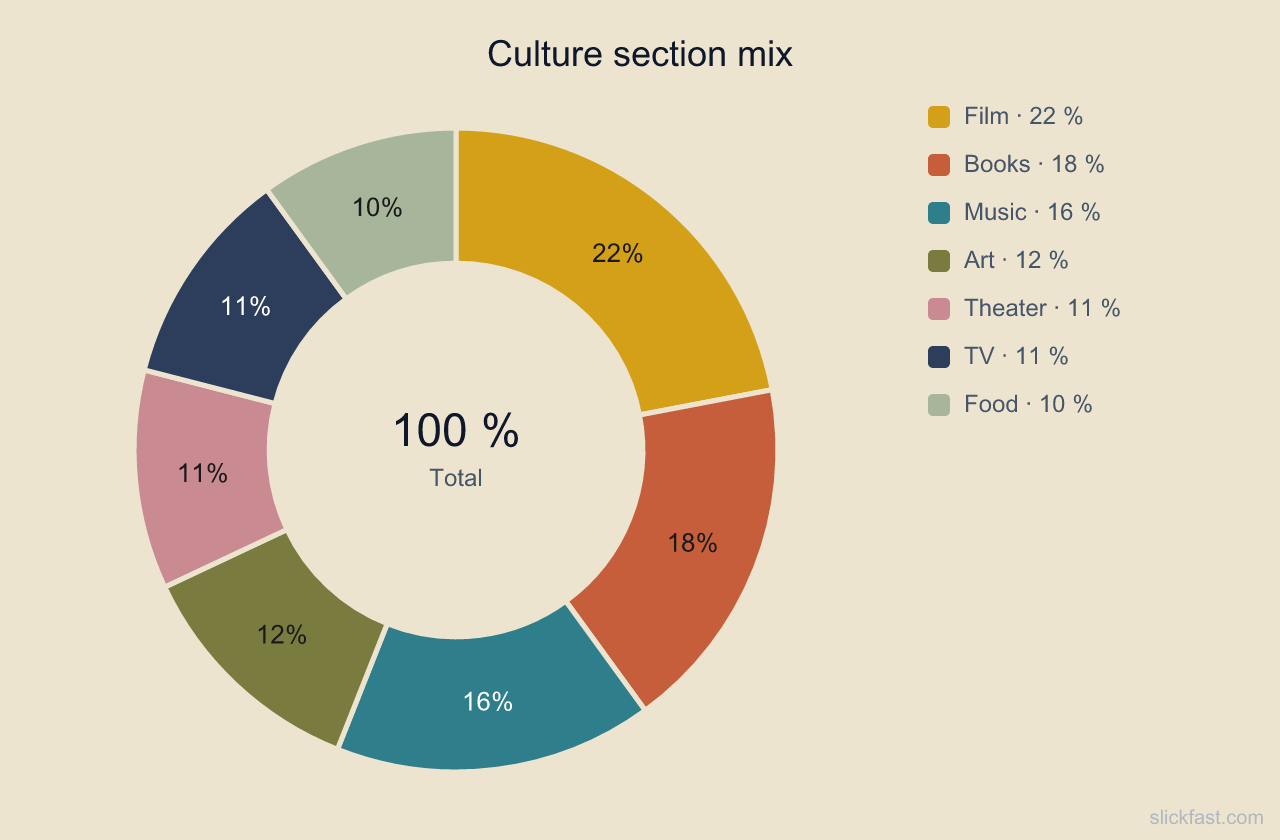
Retro Editorial — donut
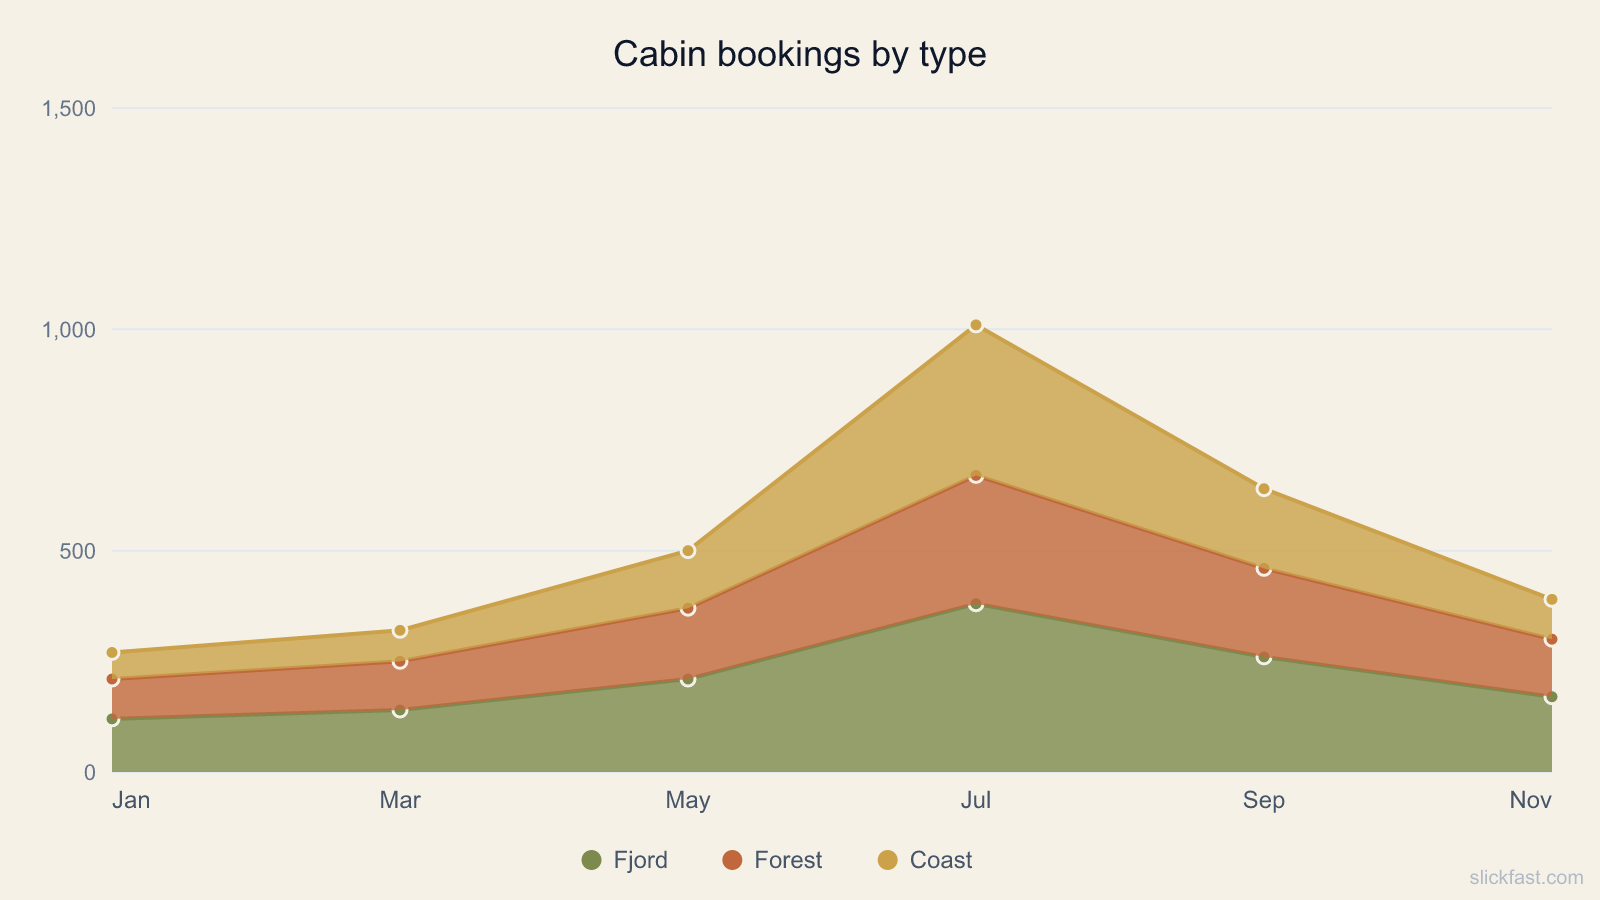
Nordic Earth — stacked area
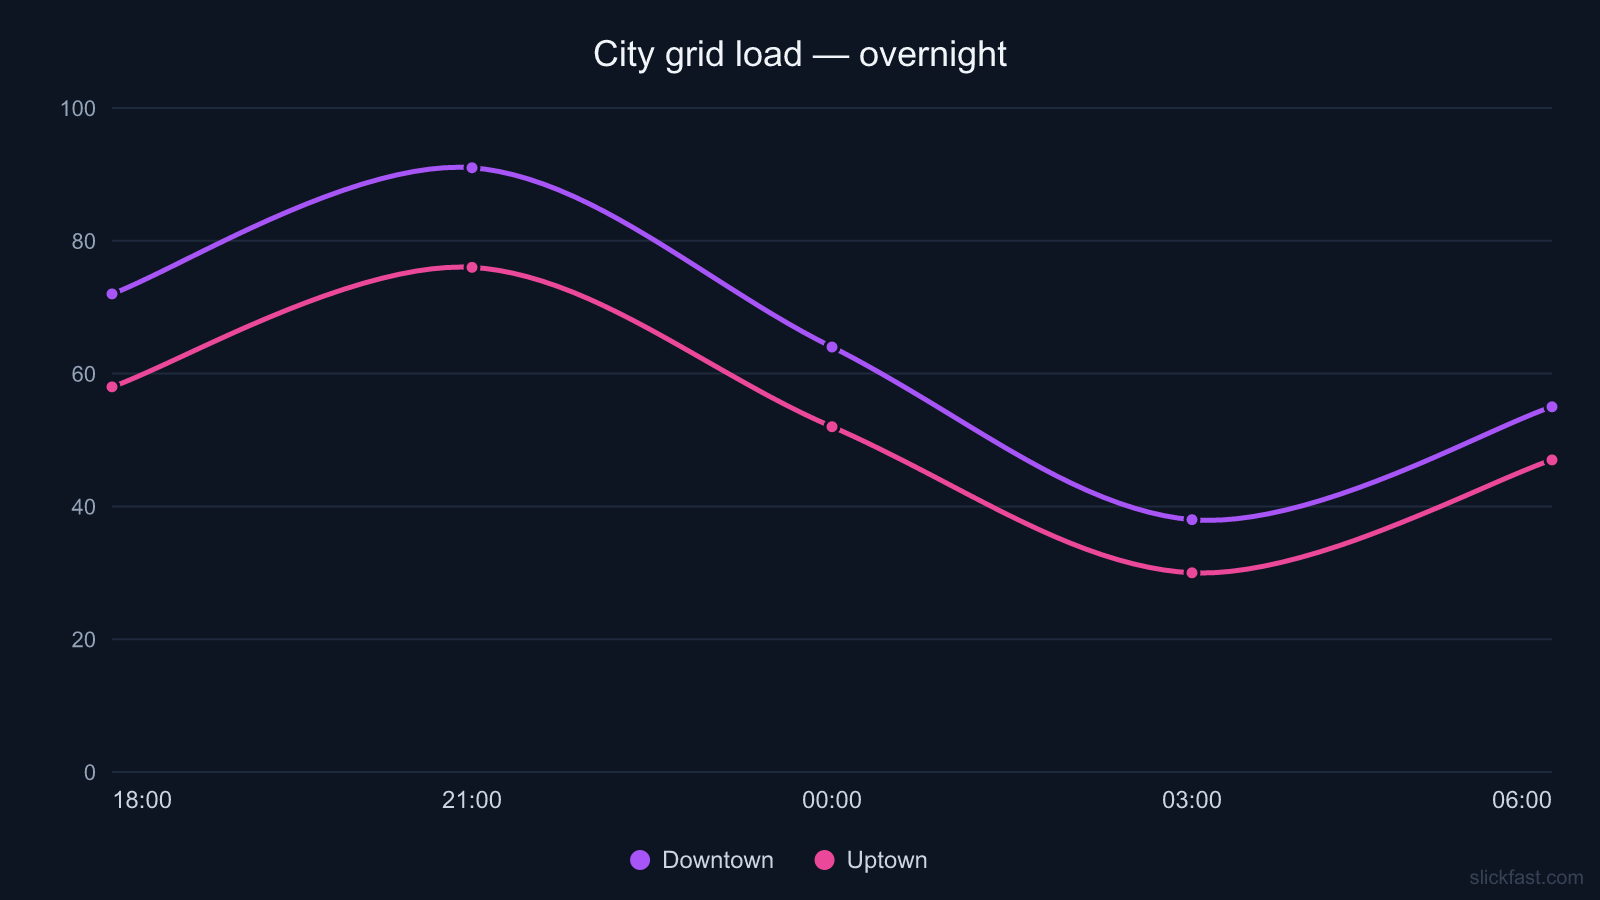
Cyberpunk Glow — smooth line
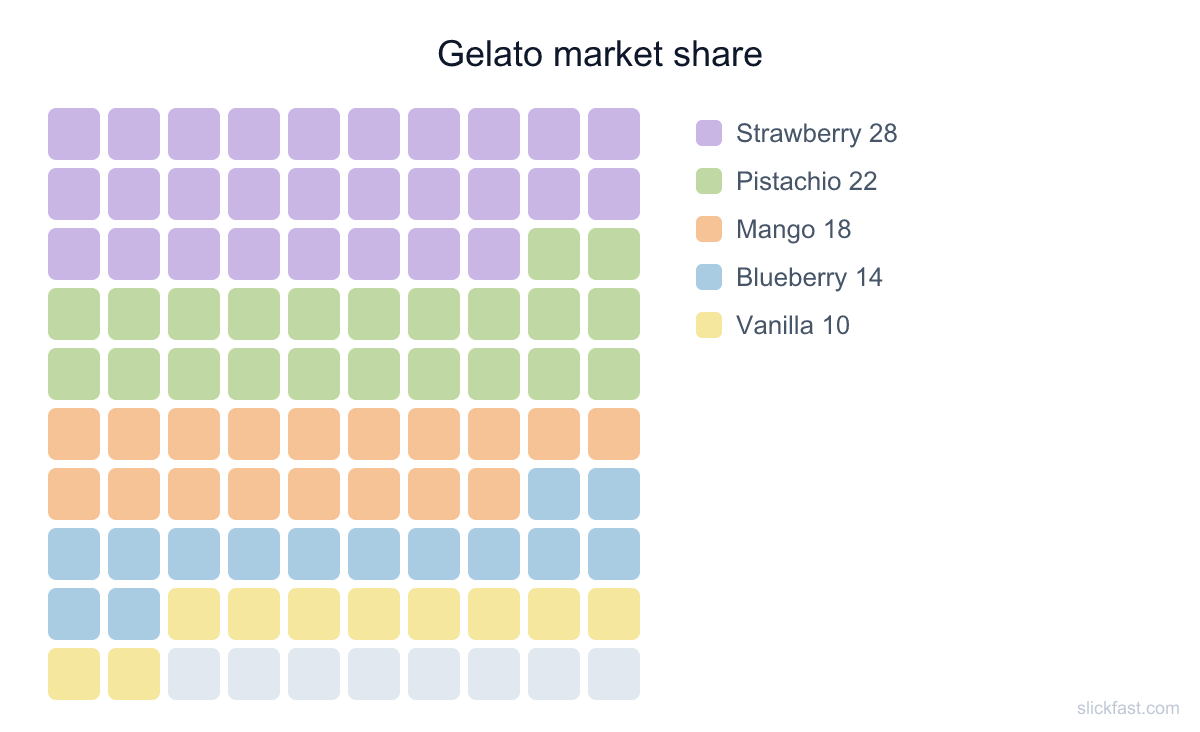
Sorbet Pastel — waffle
Whole dashboards — one spec, one call, one image
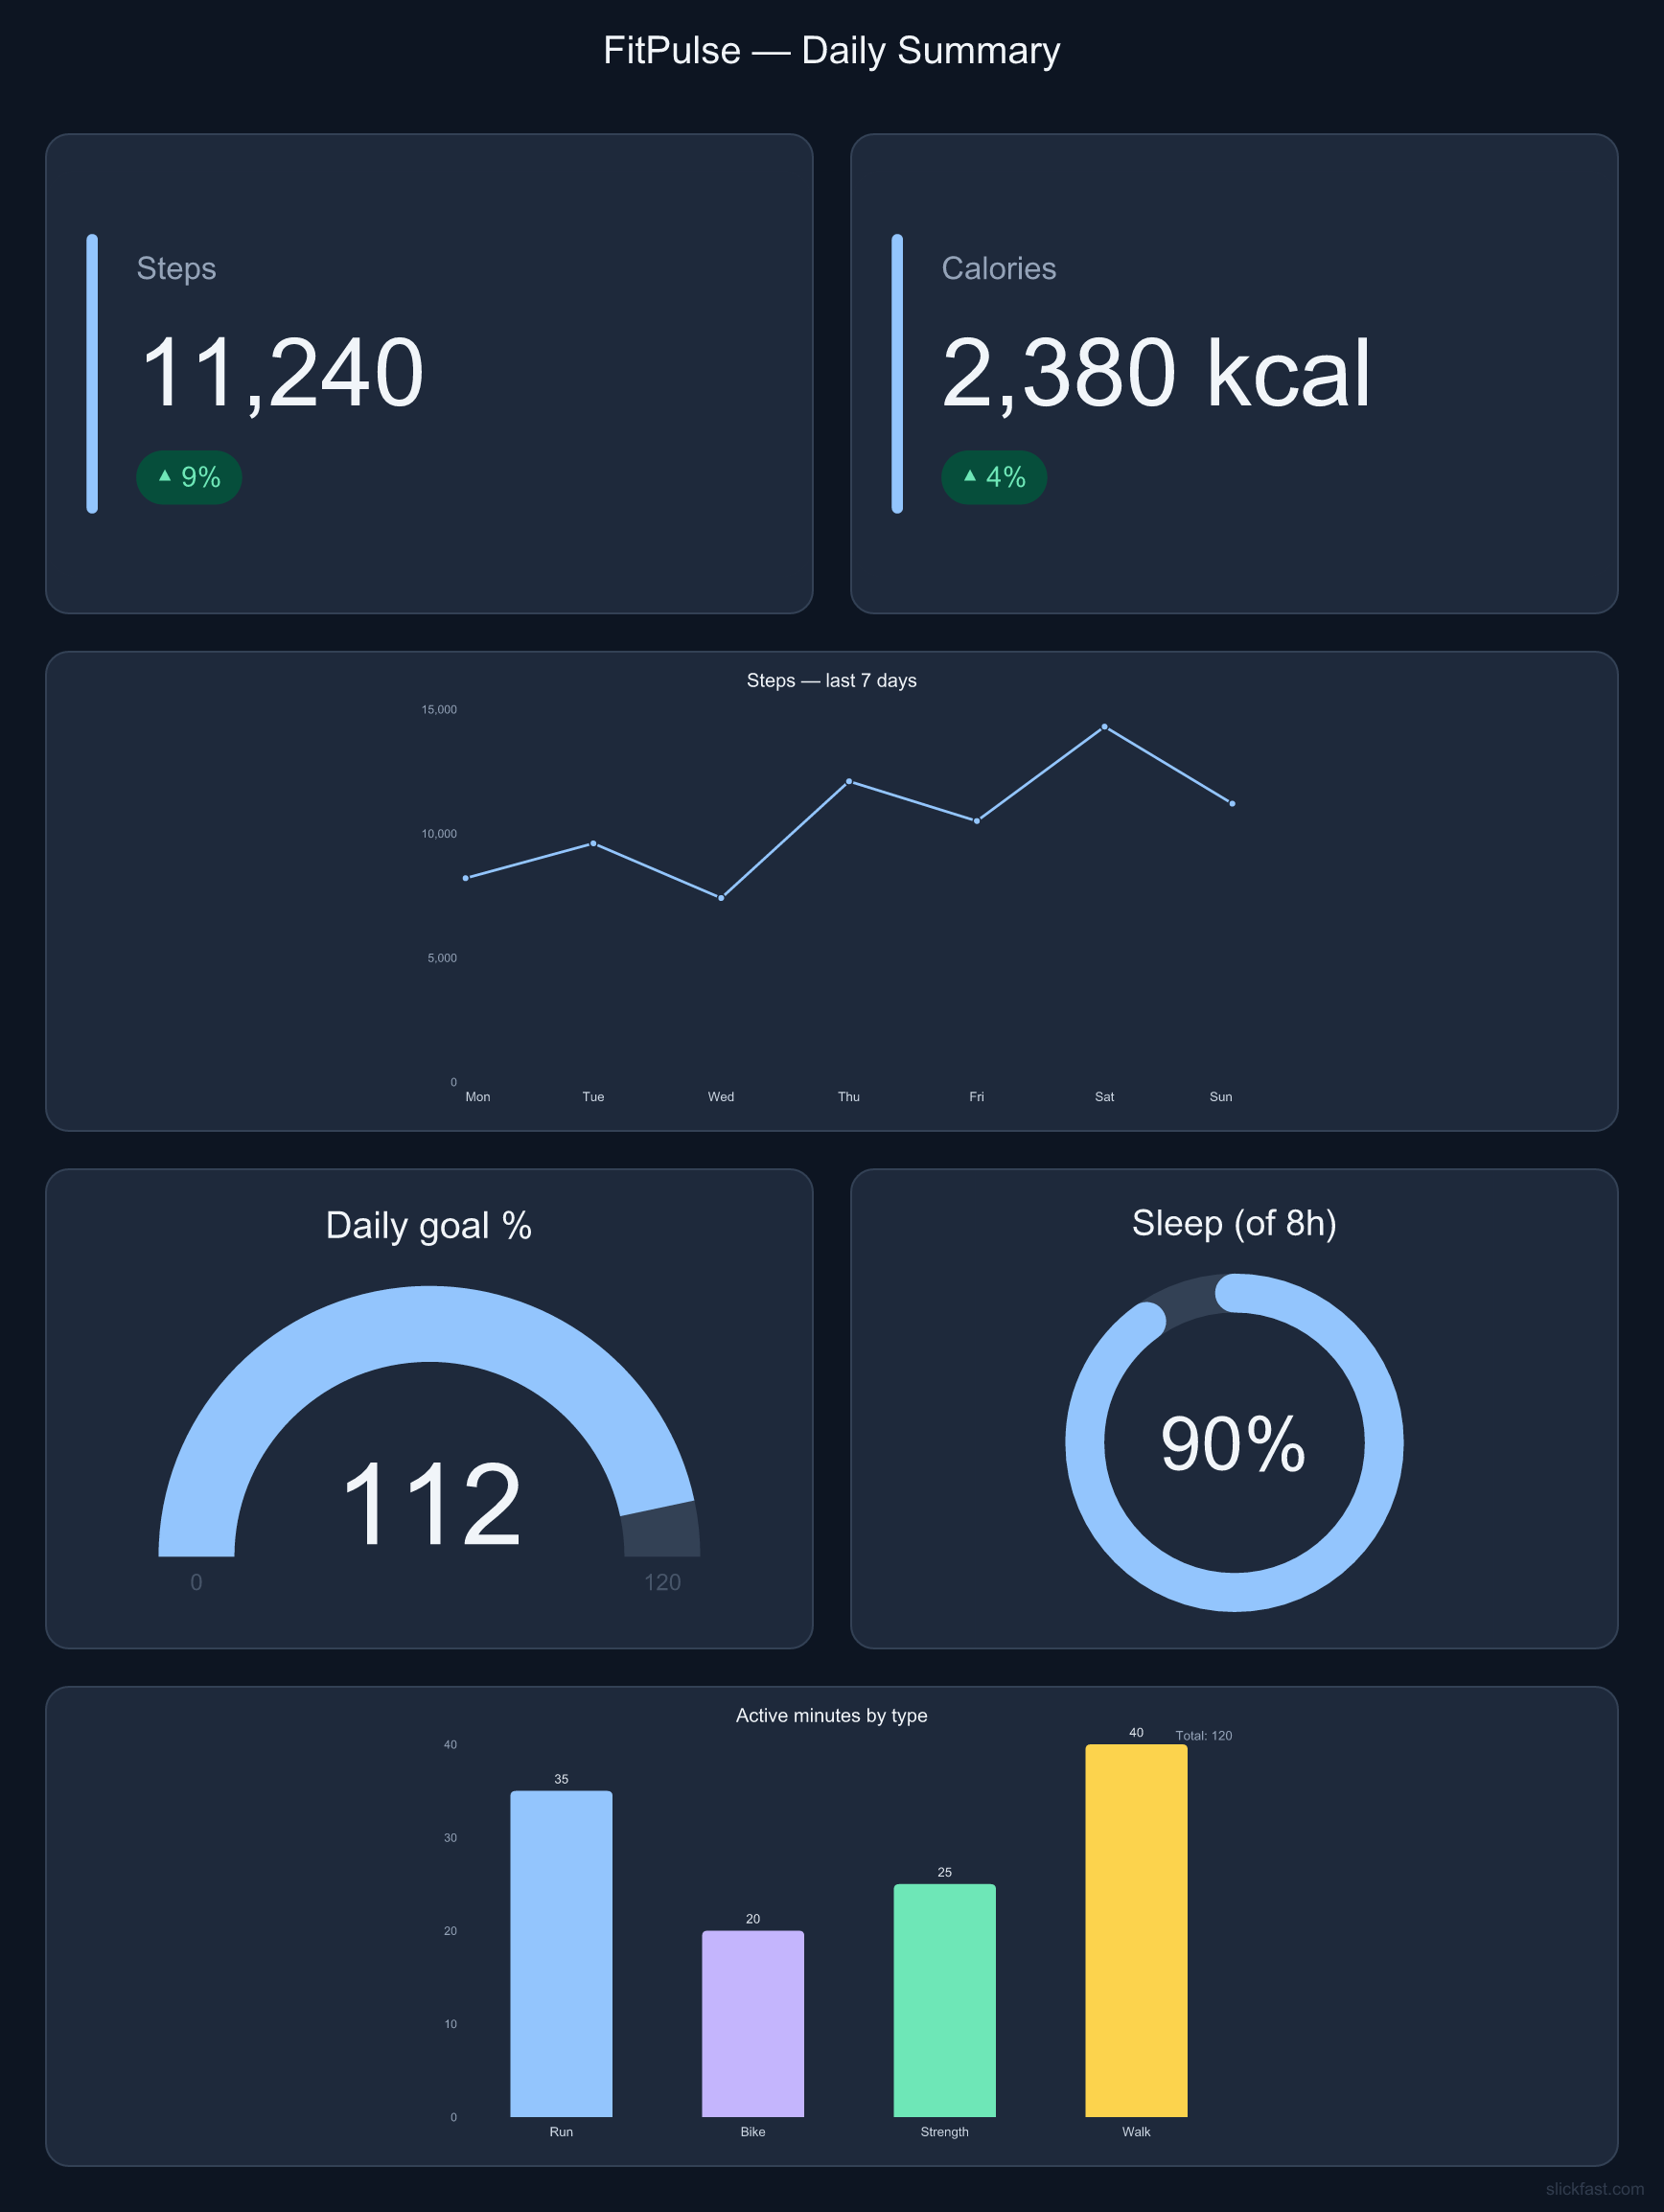
Portrait board — phone-shaped daily summary
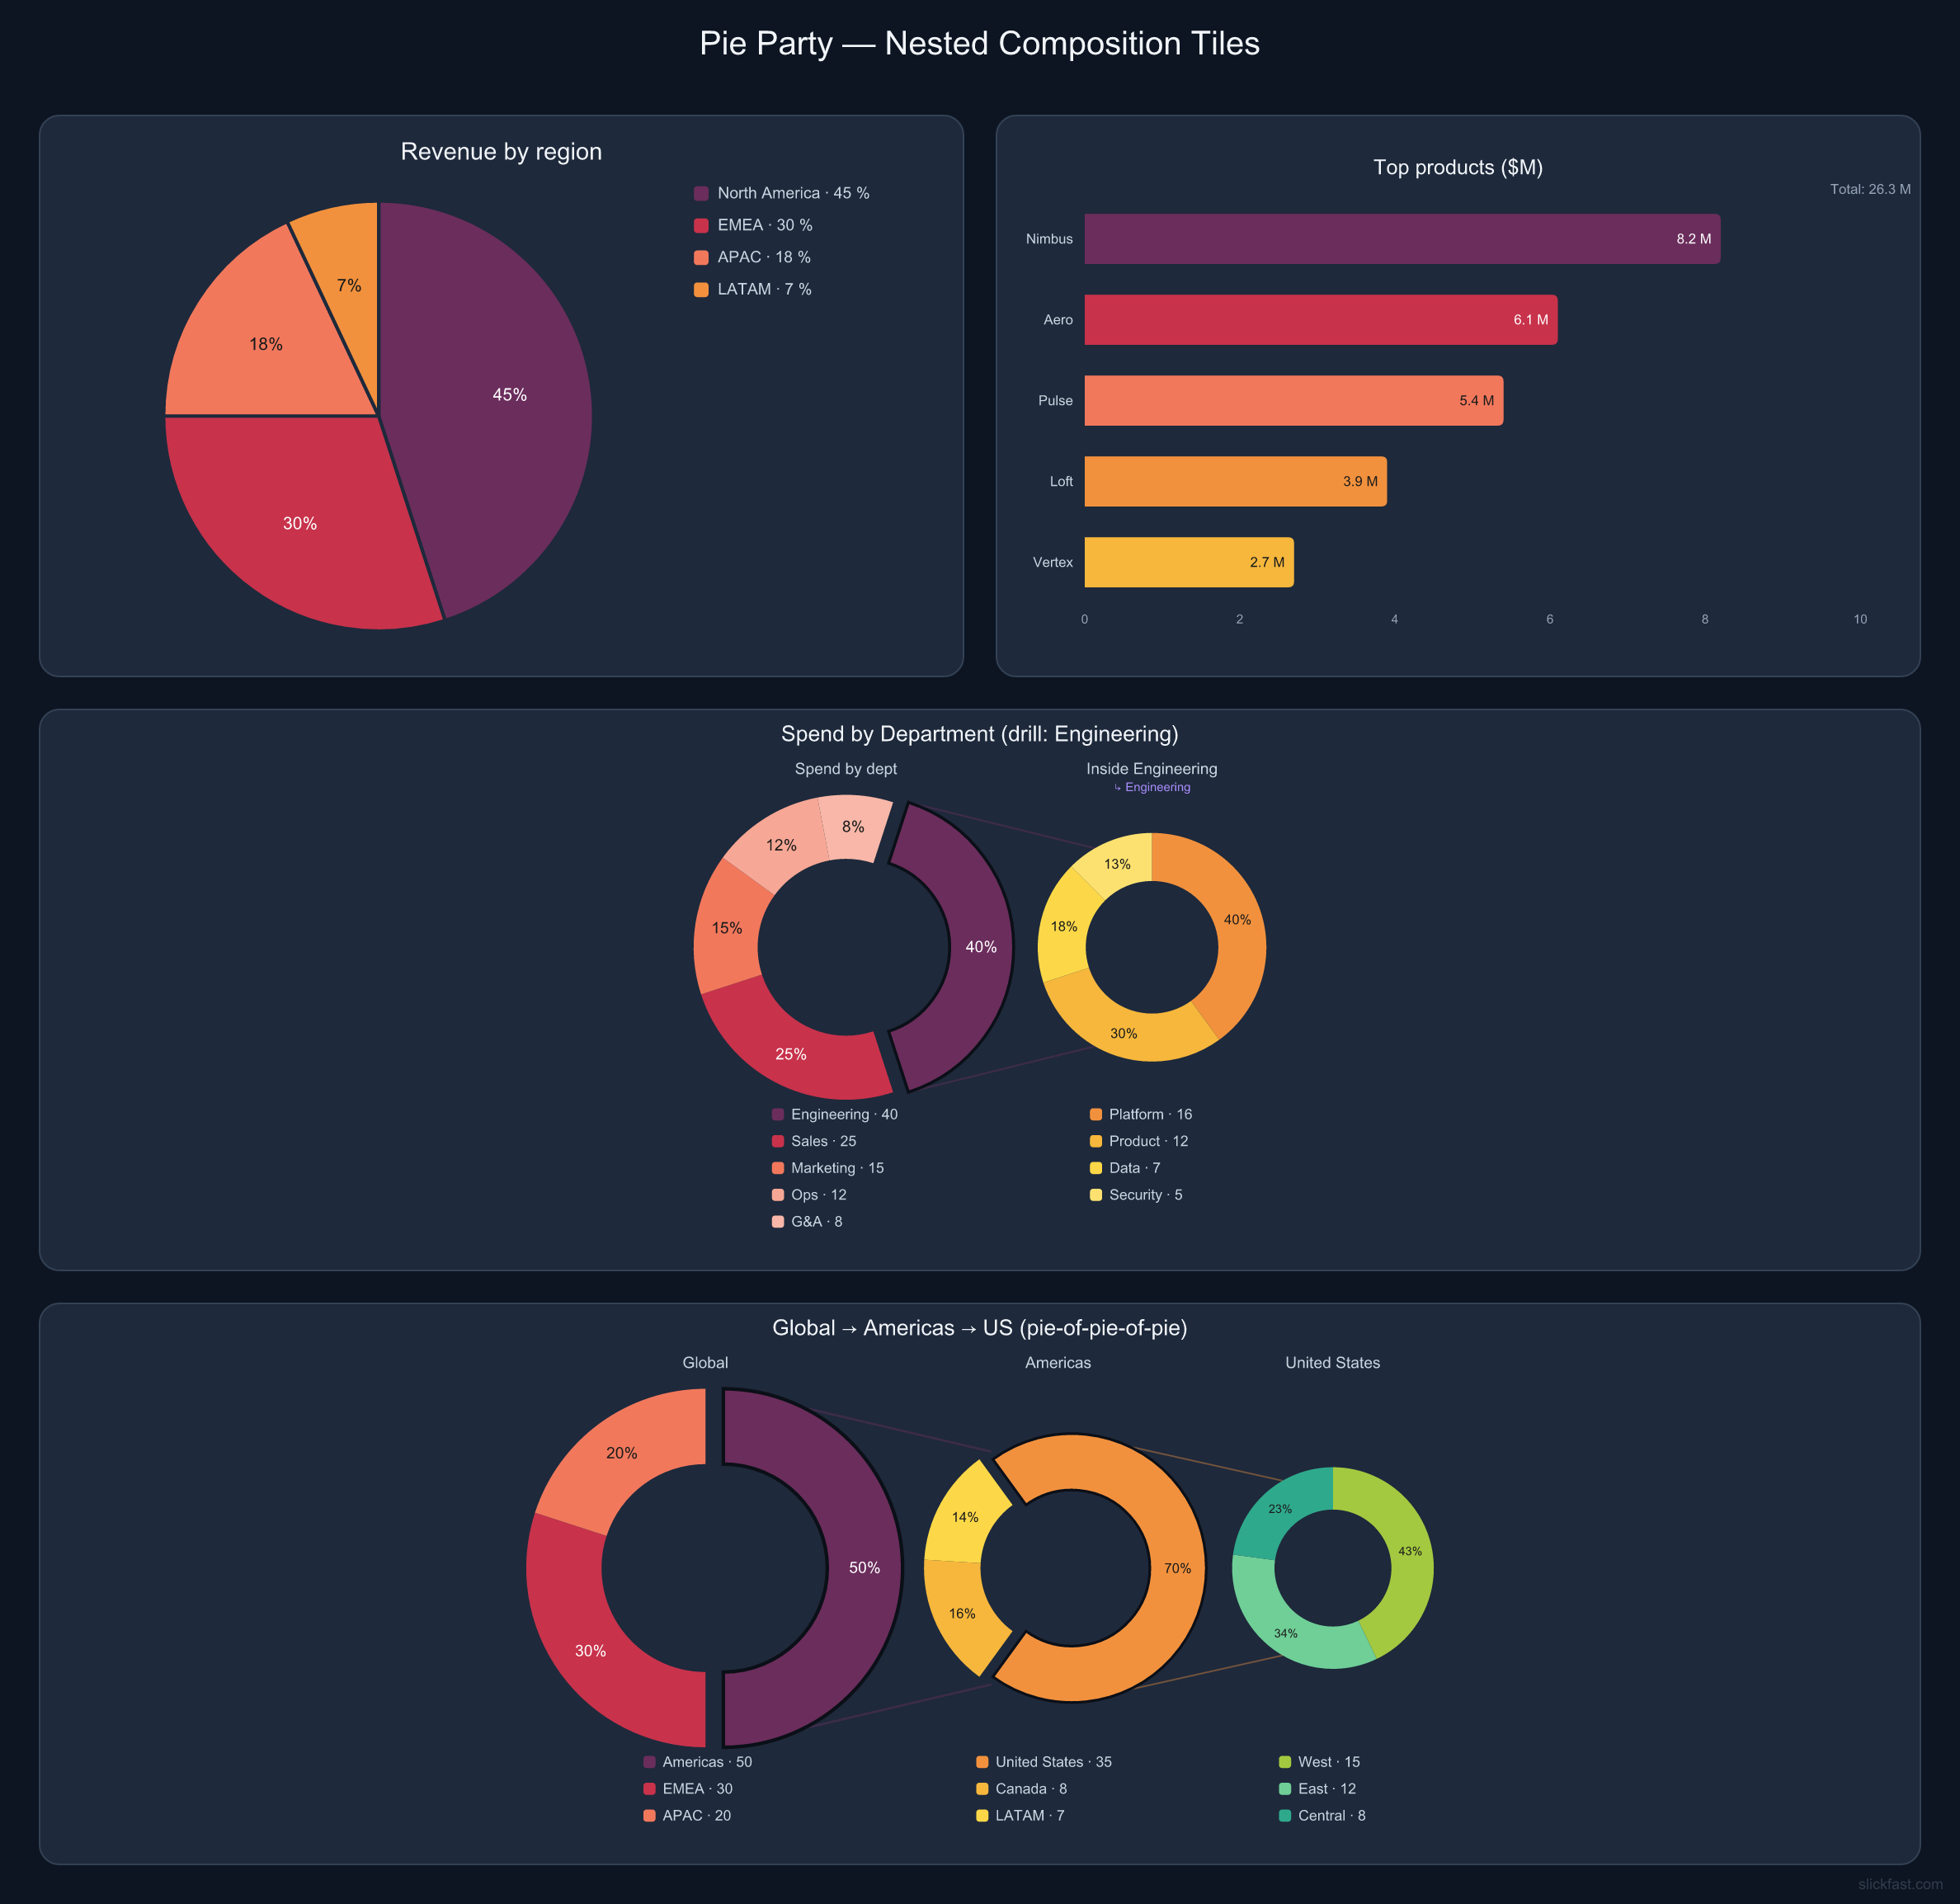
Nested composition — pie-of-pie drill-downs as full-width tiles
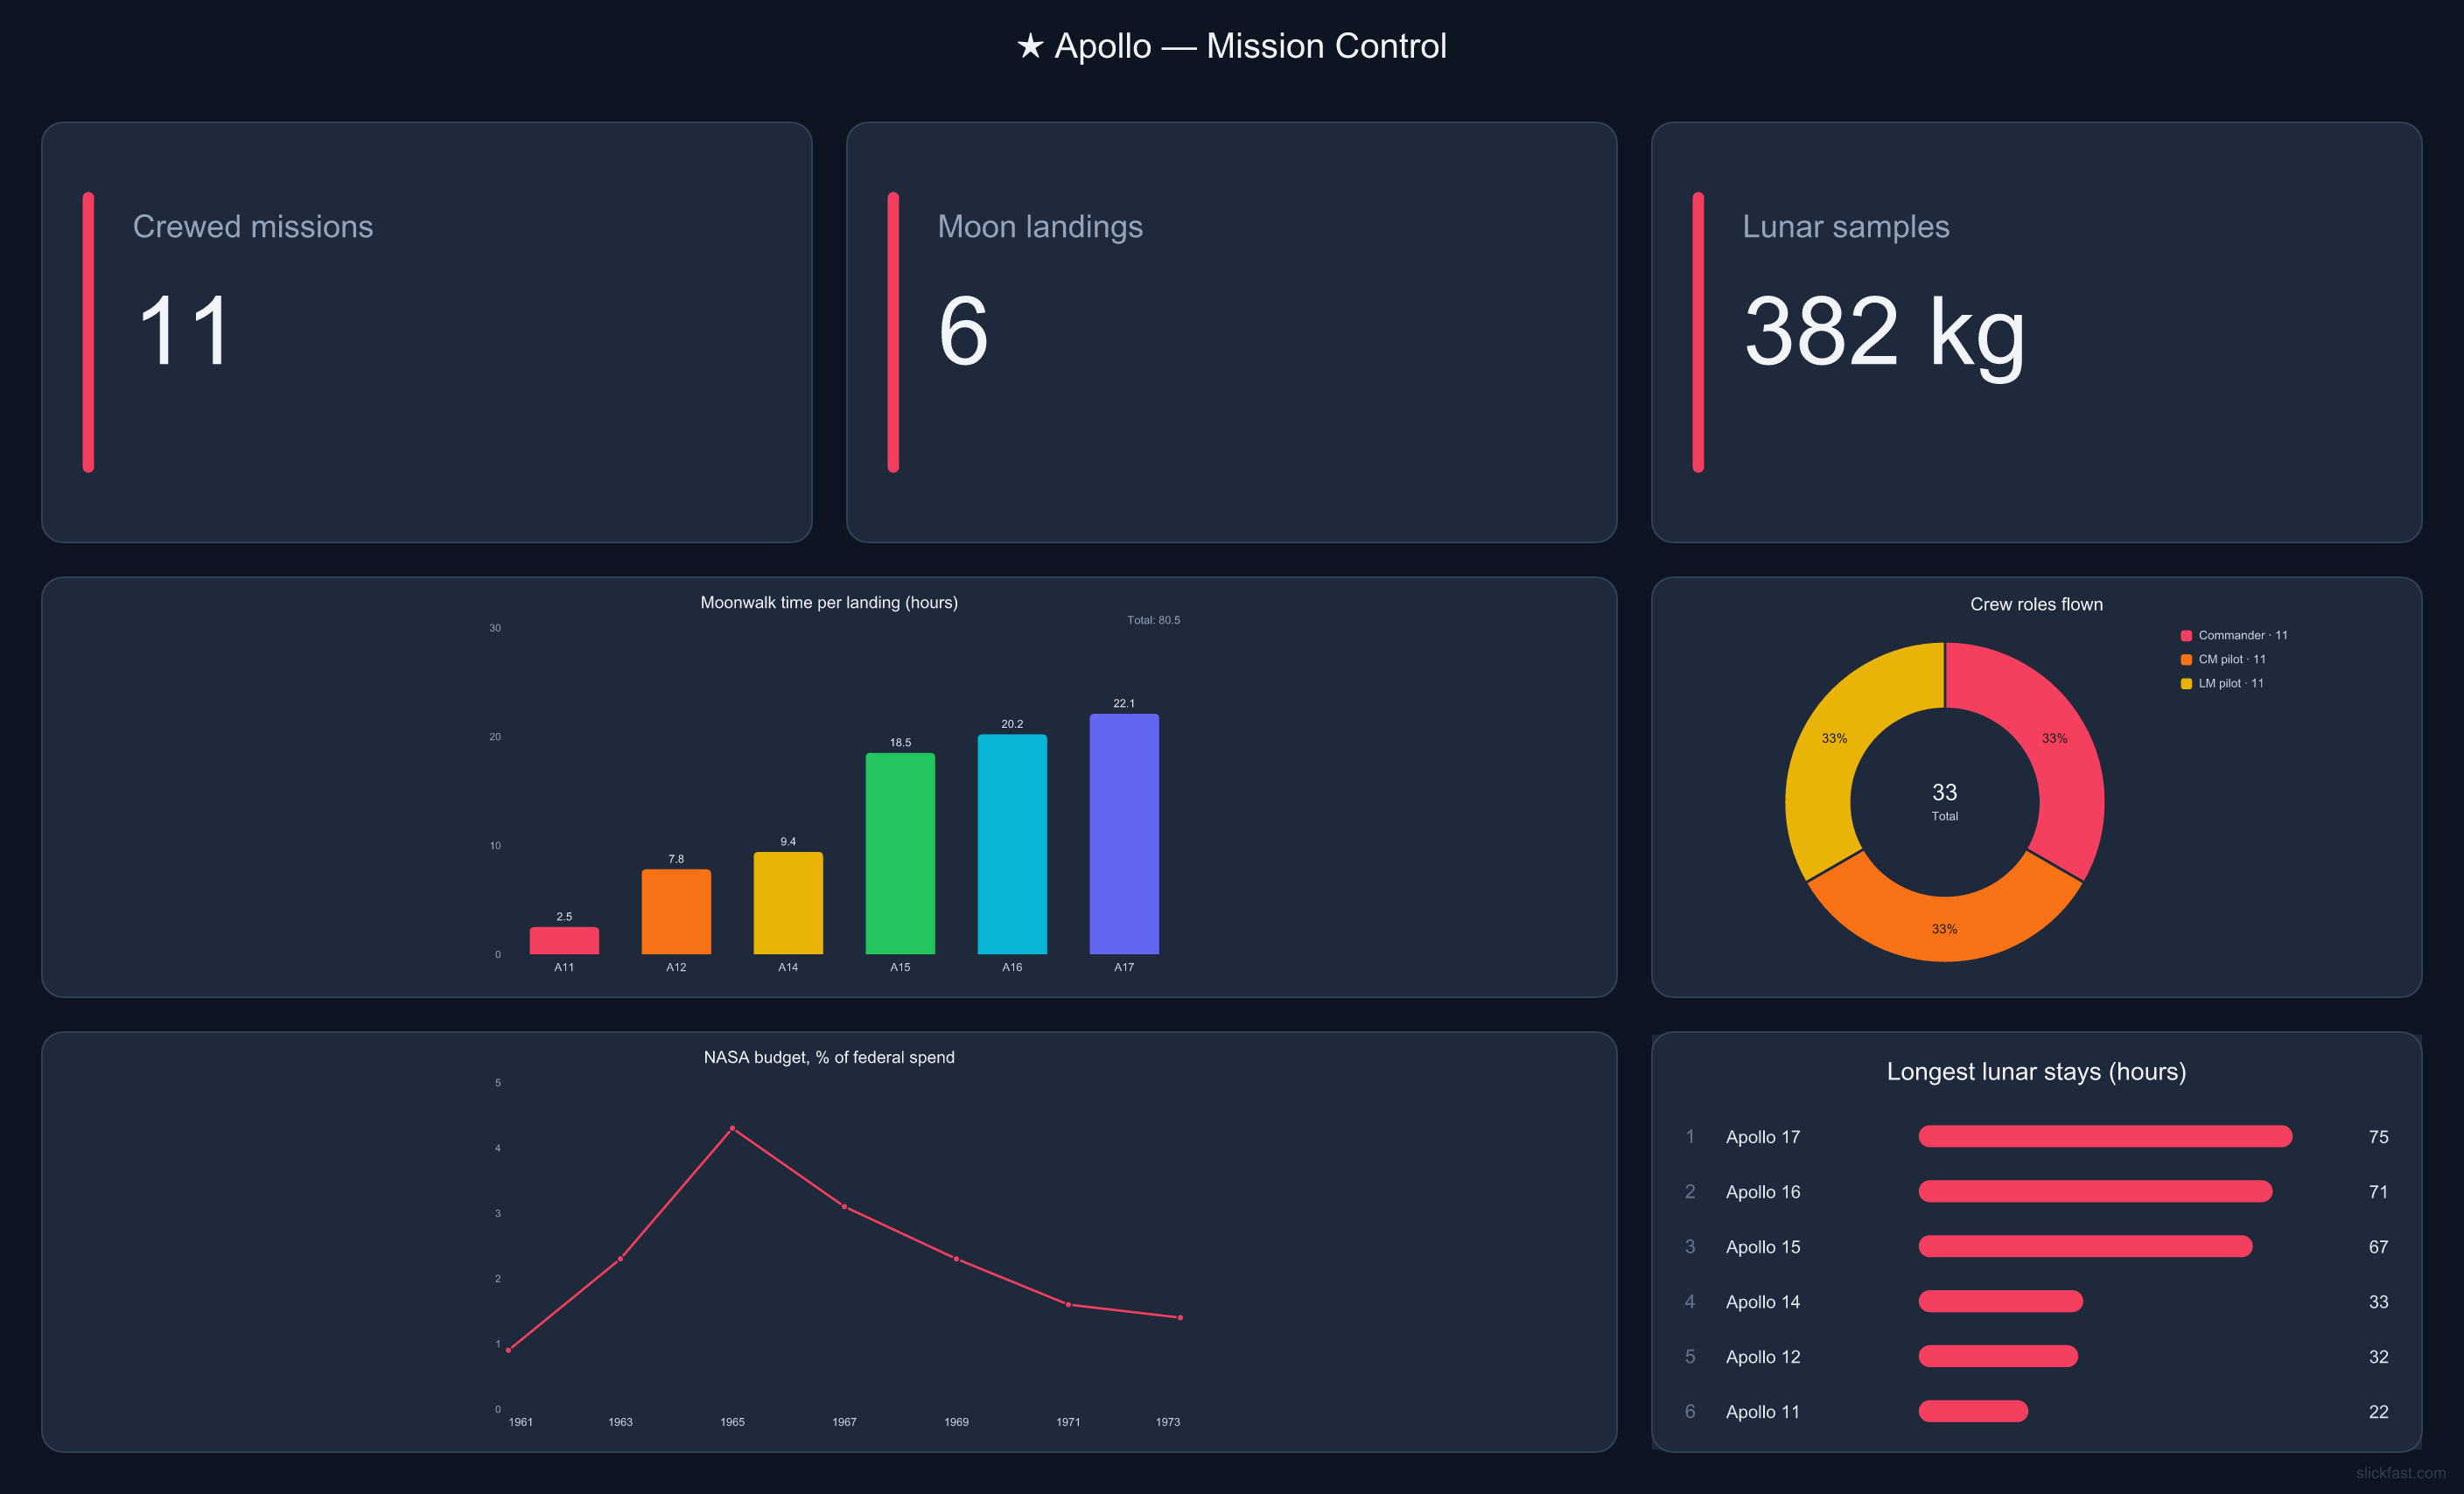
Apollo — Mission Control — themed board, real program data
Every type, by family
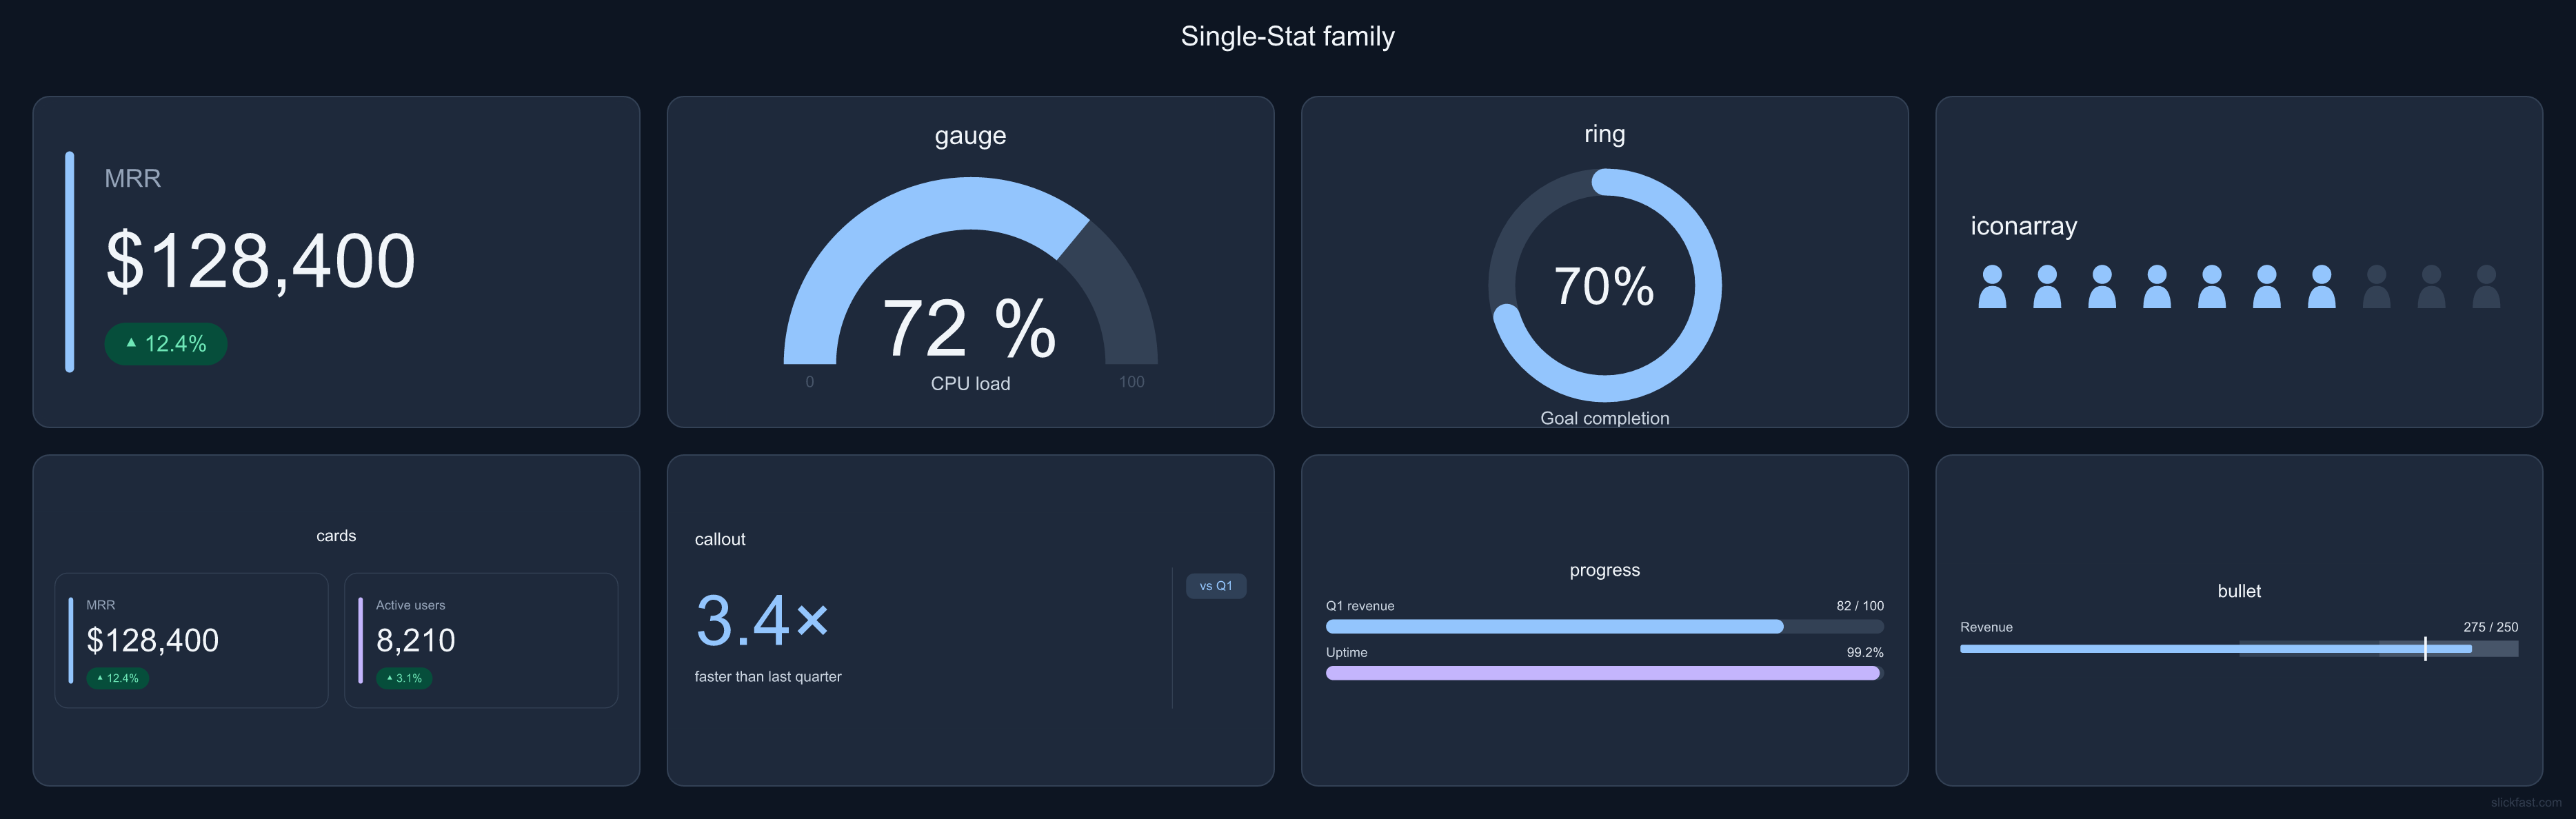
Single-stat family · Pastel — kpi · gauge · ring · callout · progress · bullet
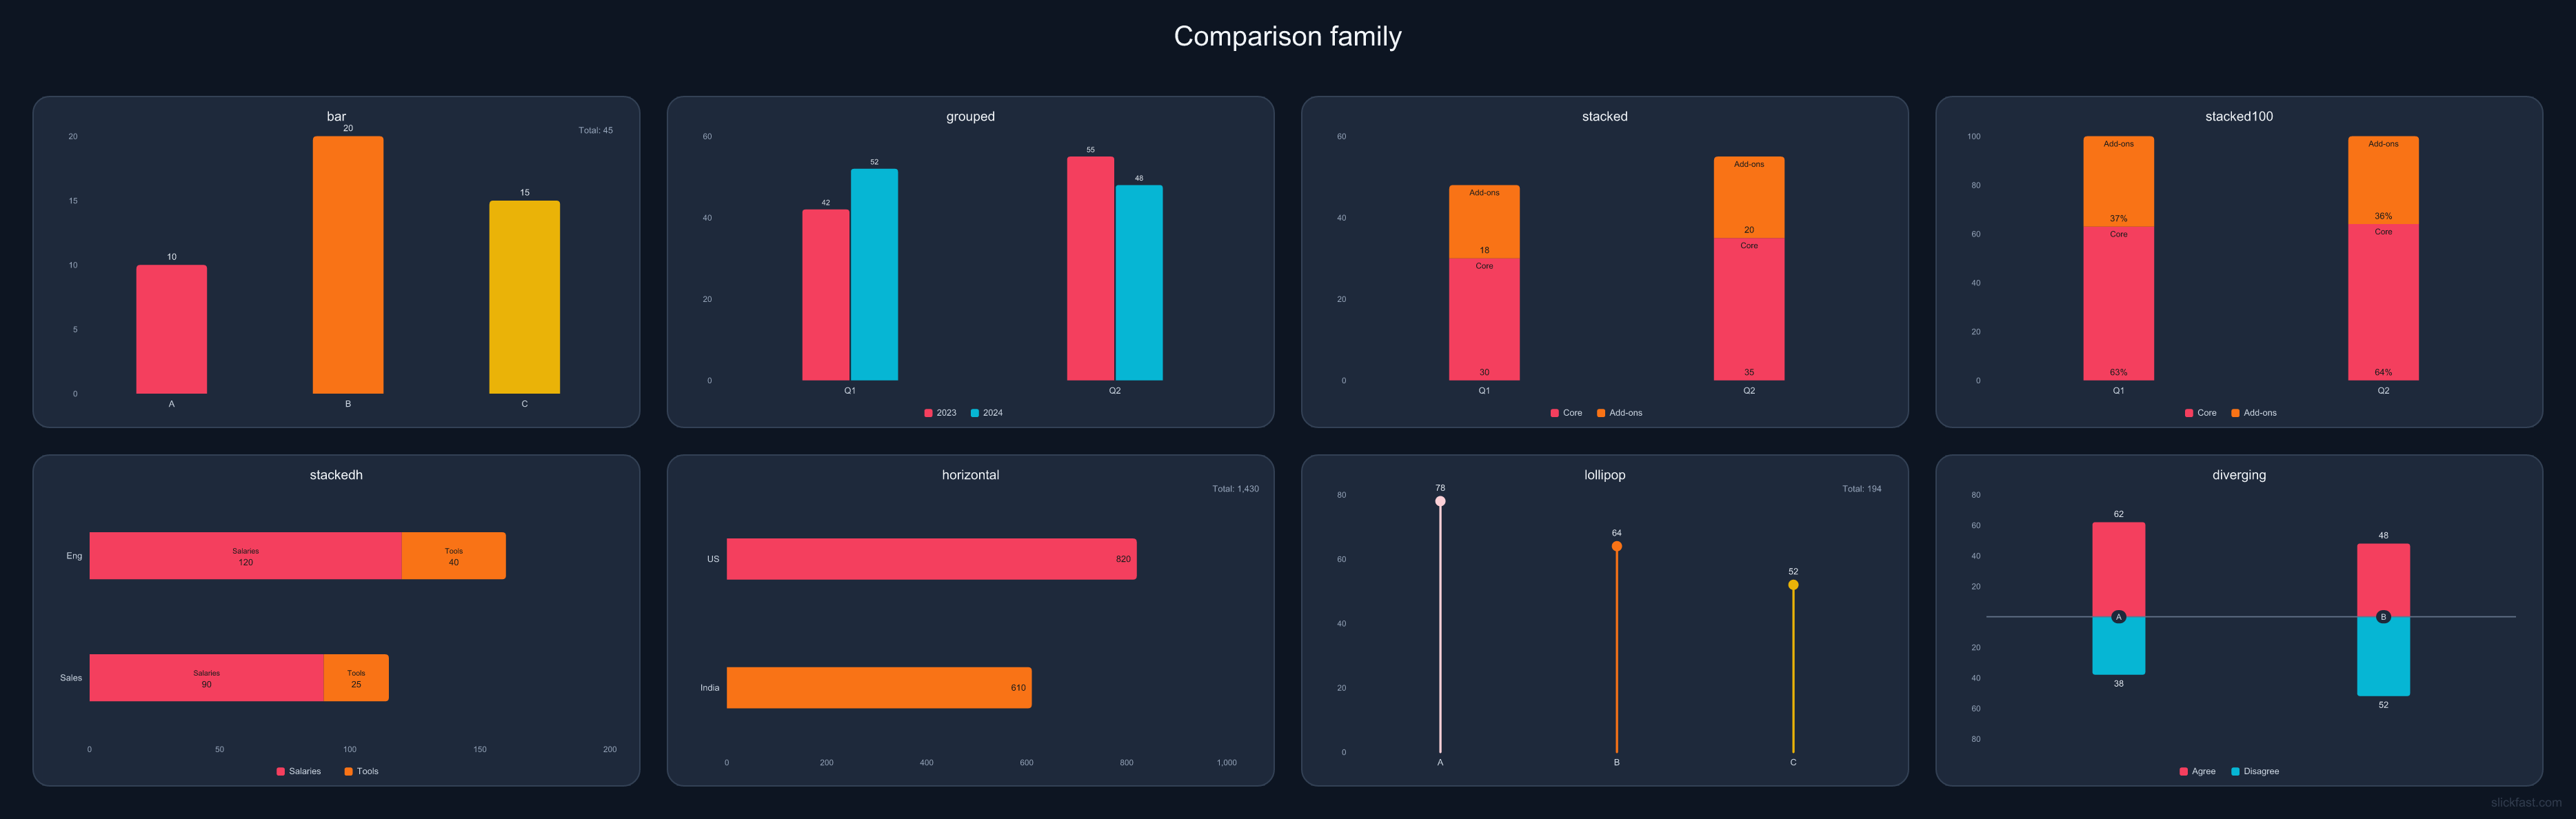
Comparison family · Vibrant — bar · grouped · stacked · diverging · lollipop
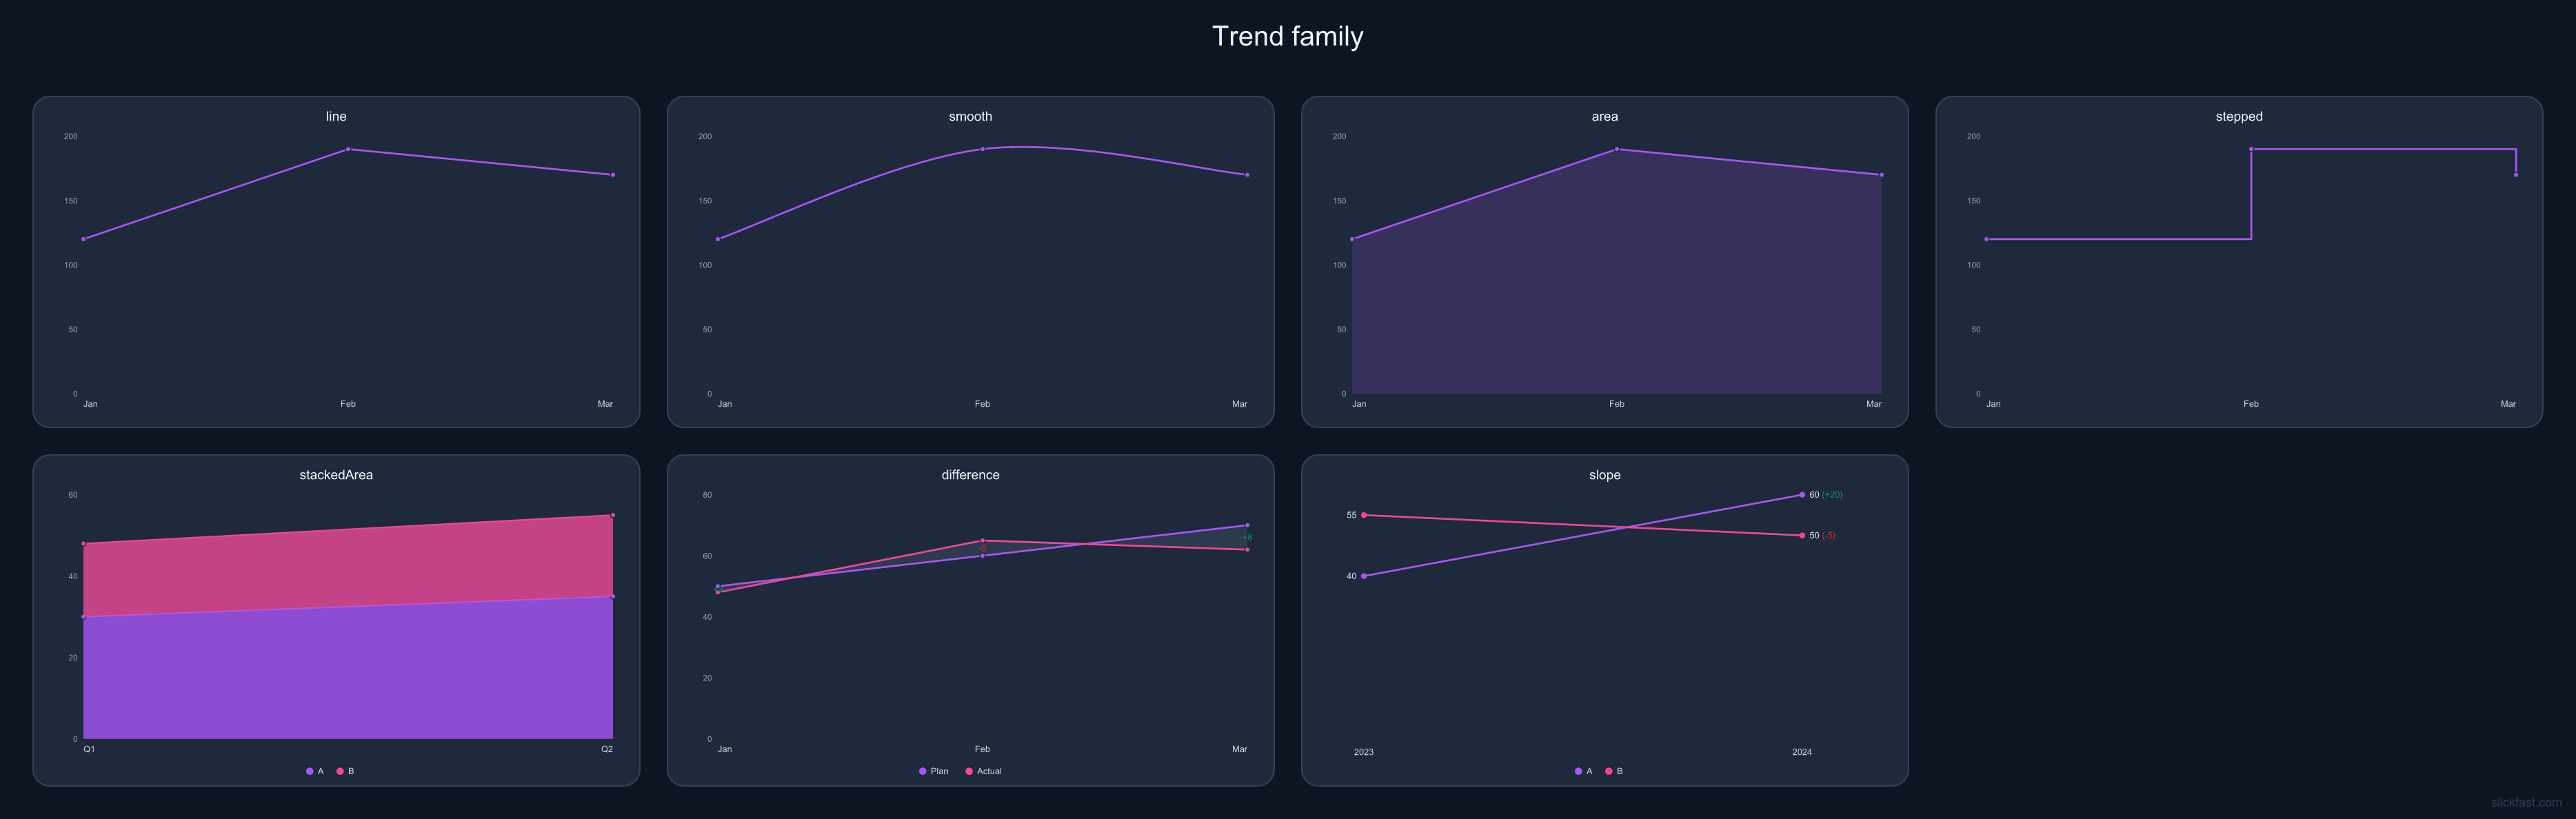
Trend family · Cyberpunk Glow — line · area · slope · difference
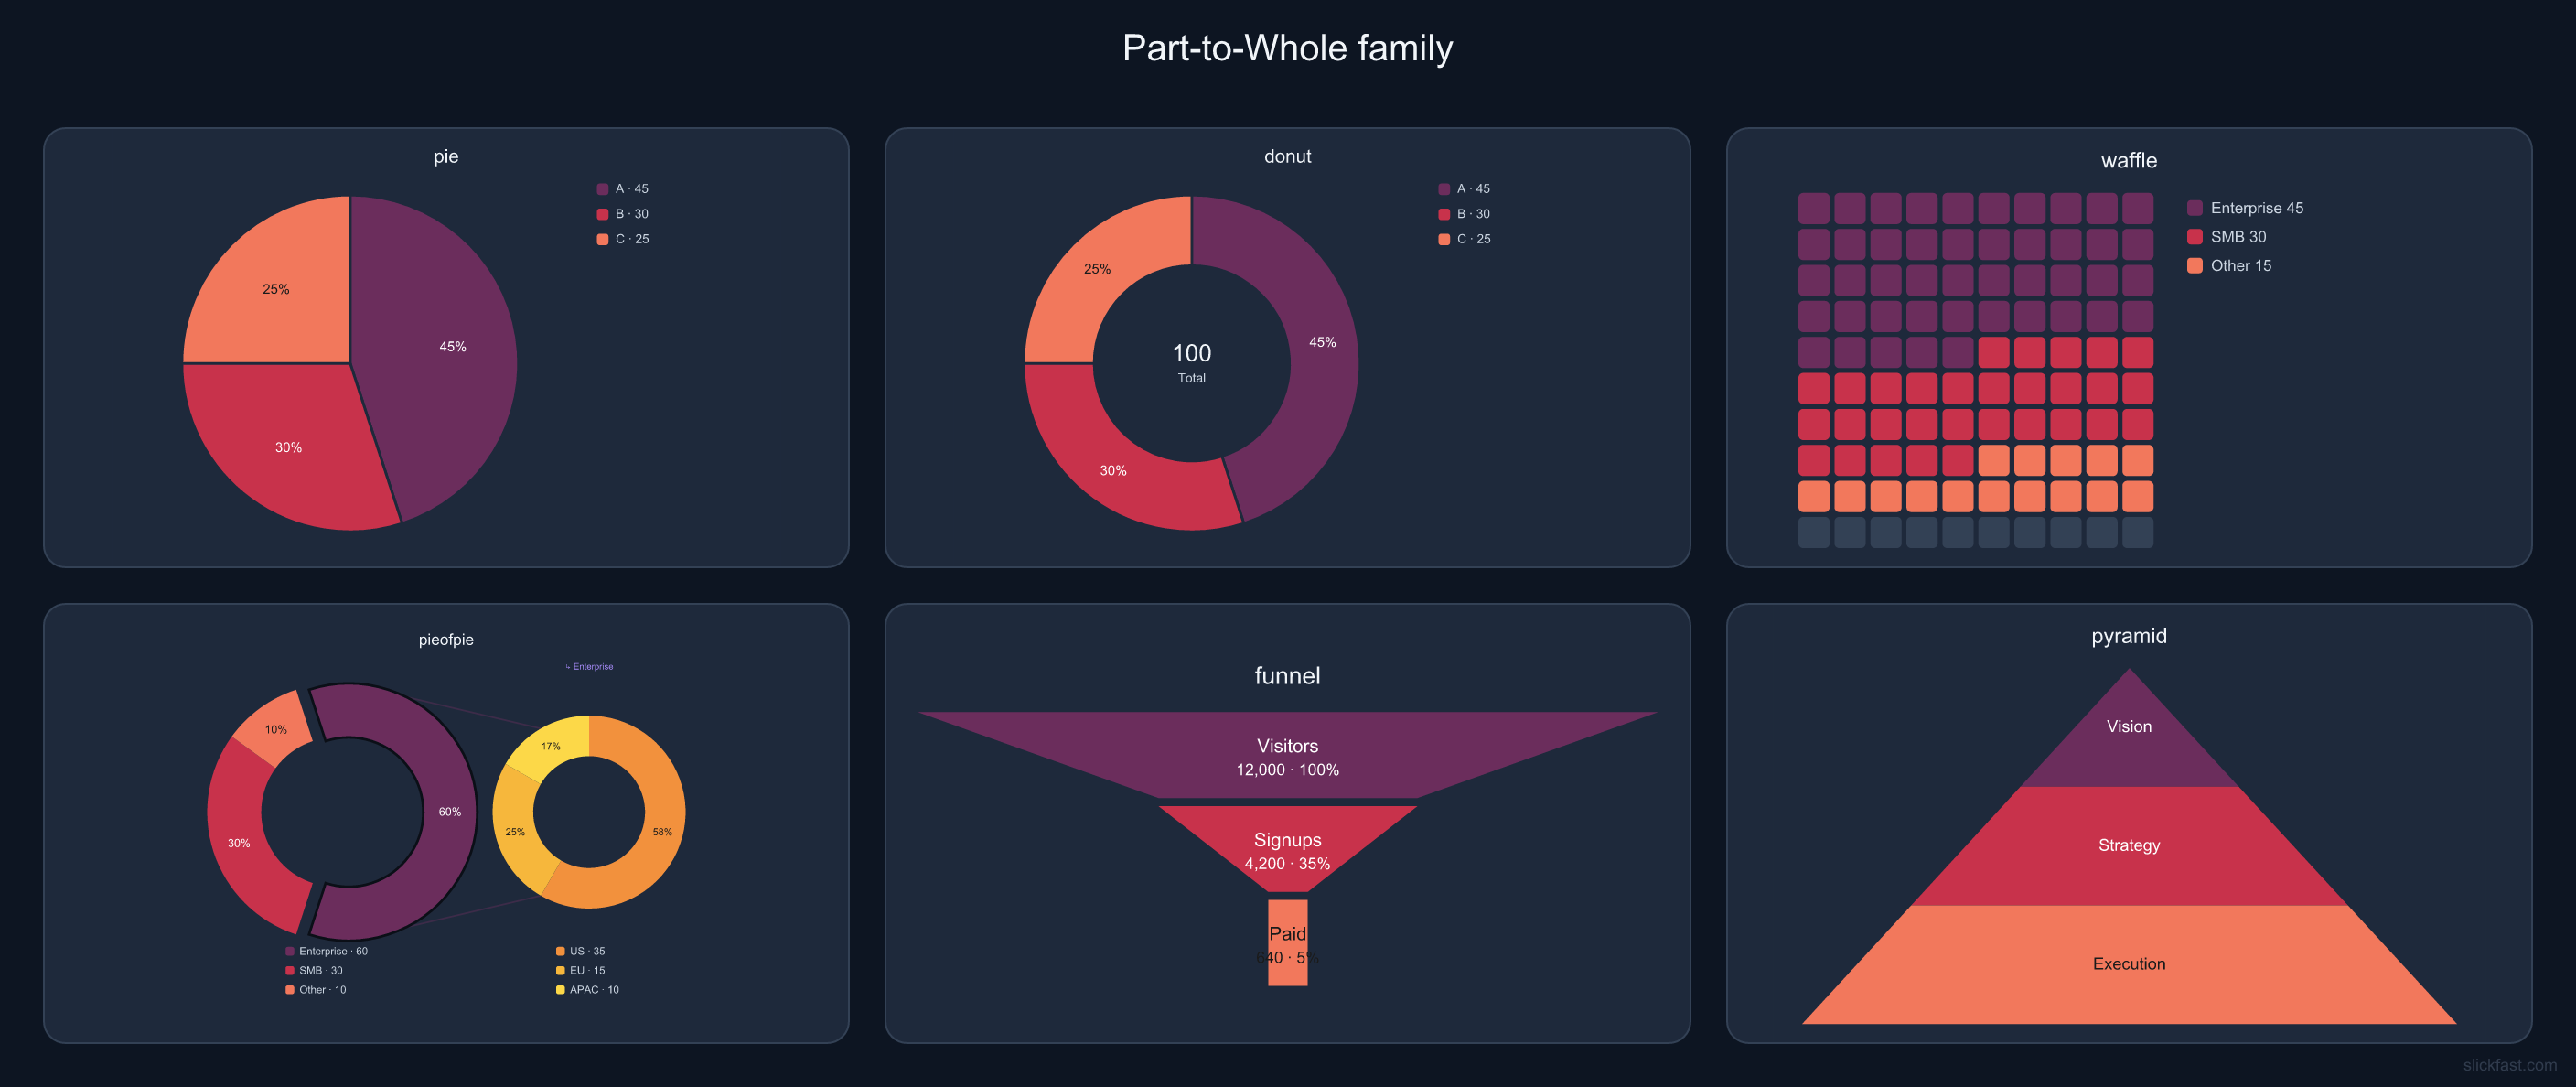
Part-to-whole family · Analogous Shift — pie · donut · pie-of-pie · waffle · funnel
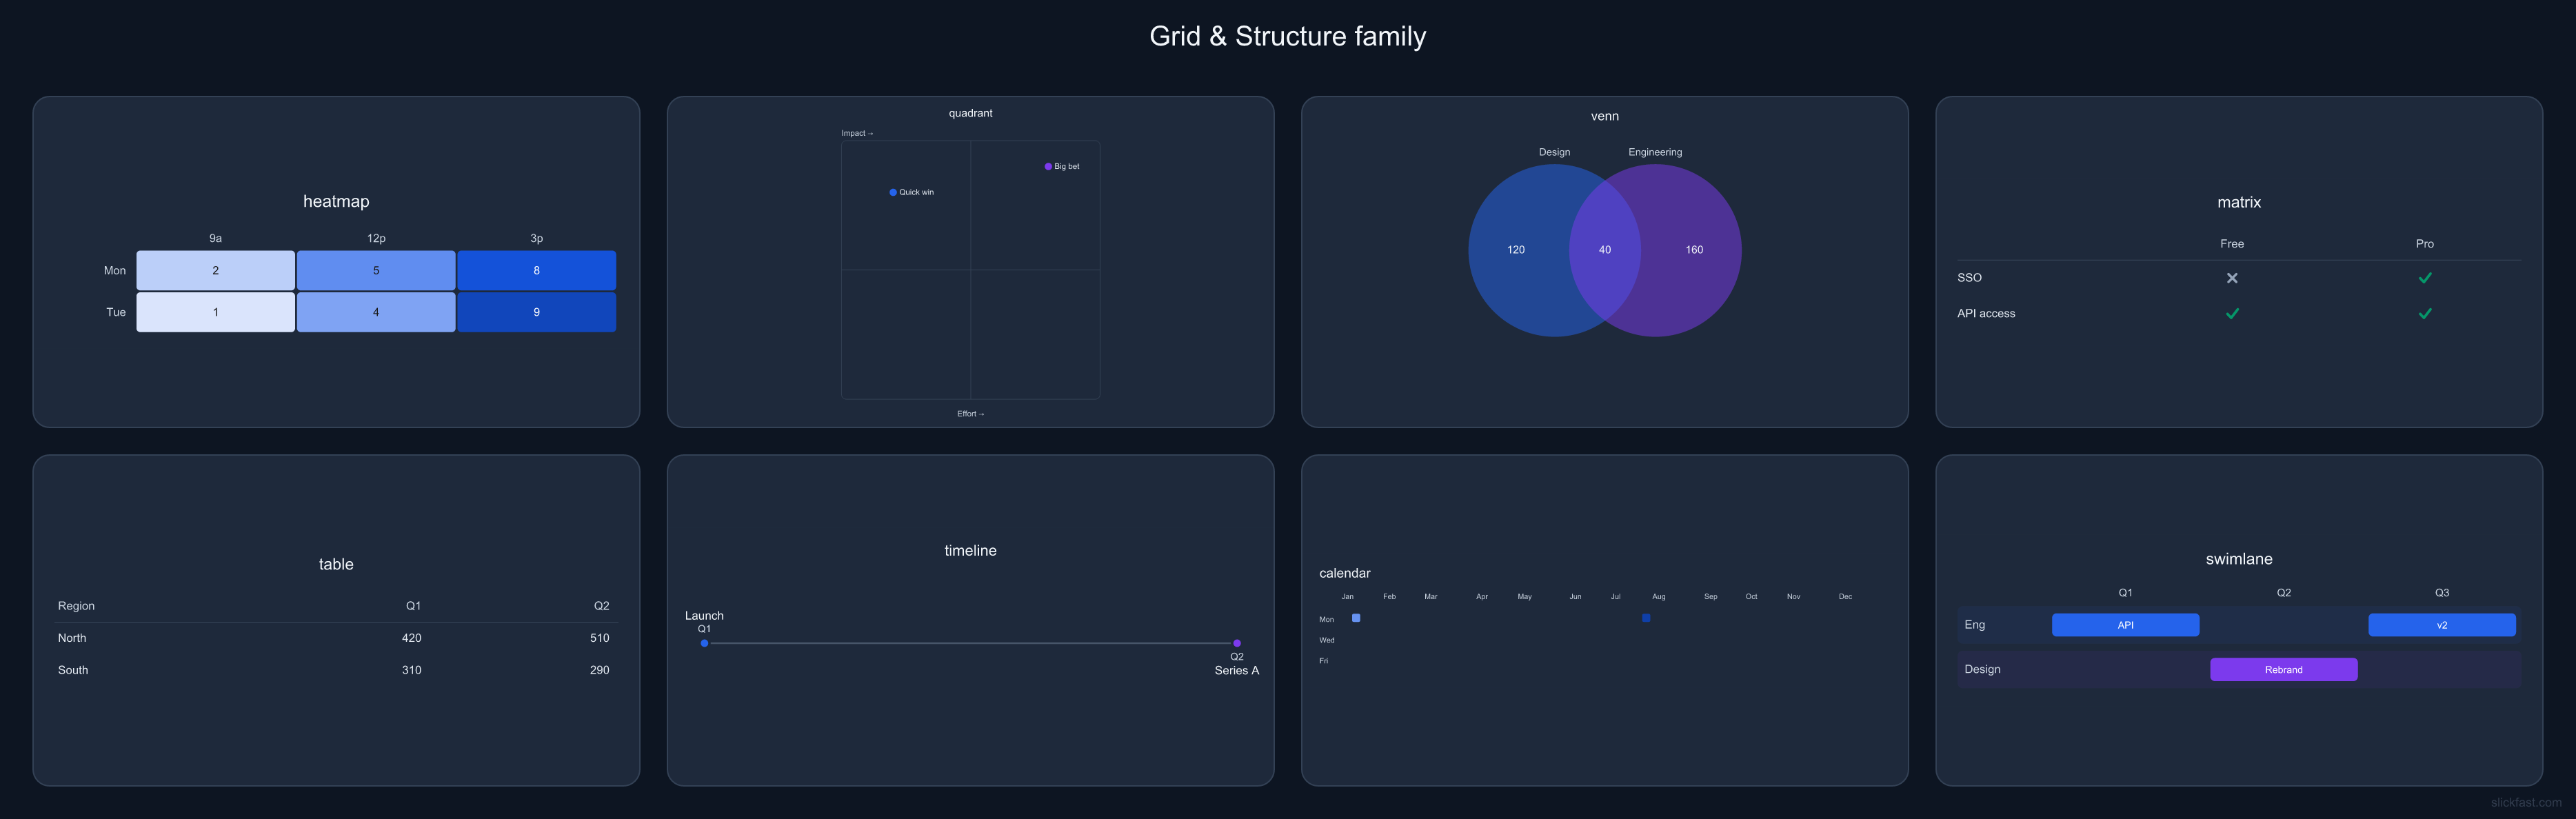
Grid & structure family · Clean Corporate — heatmap · matrix · table · calendar · quadrant
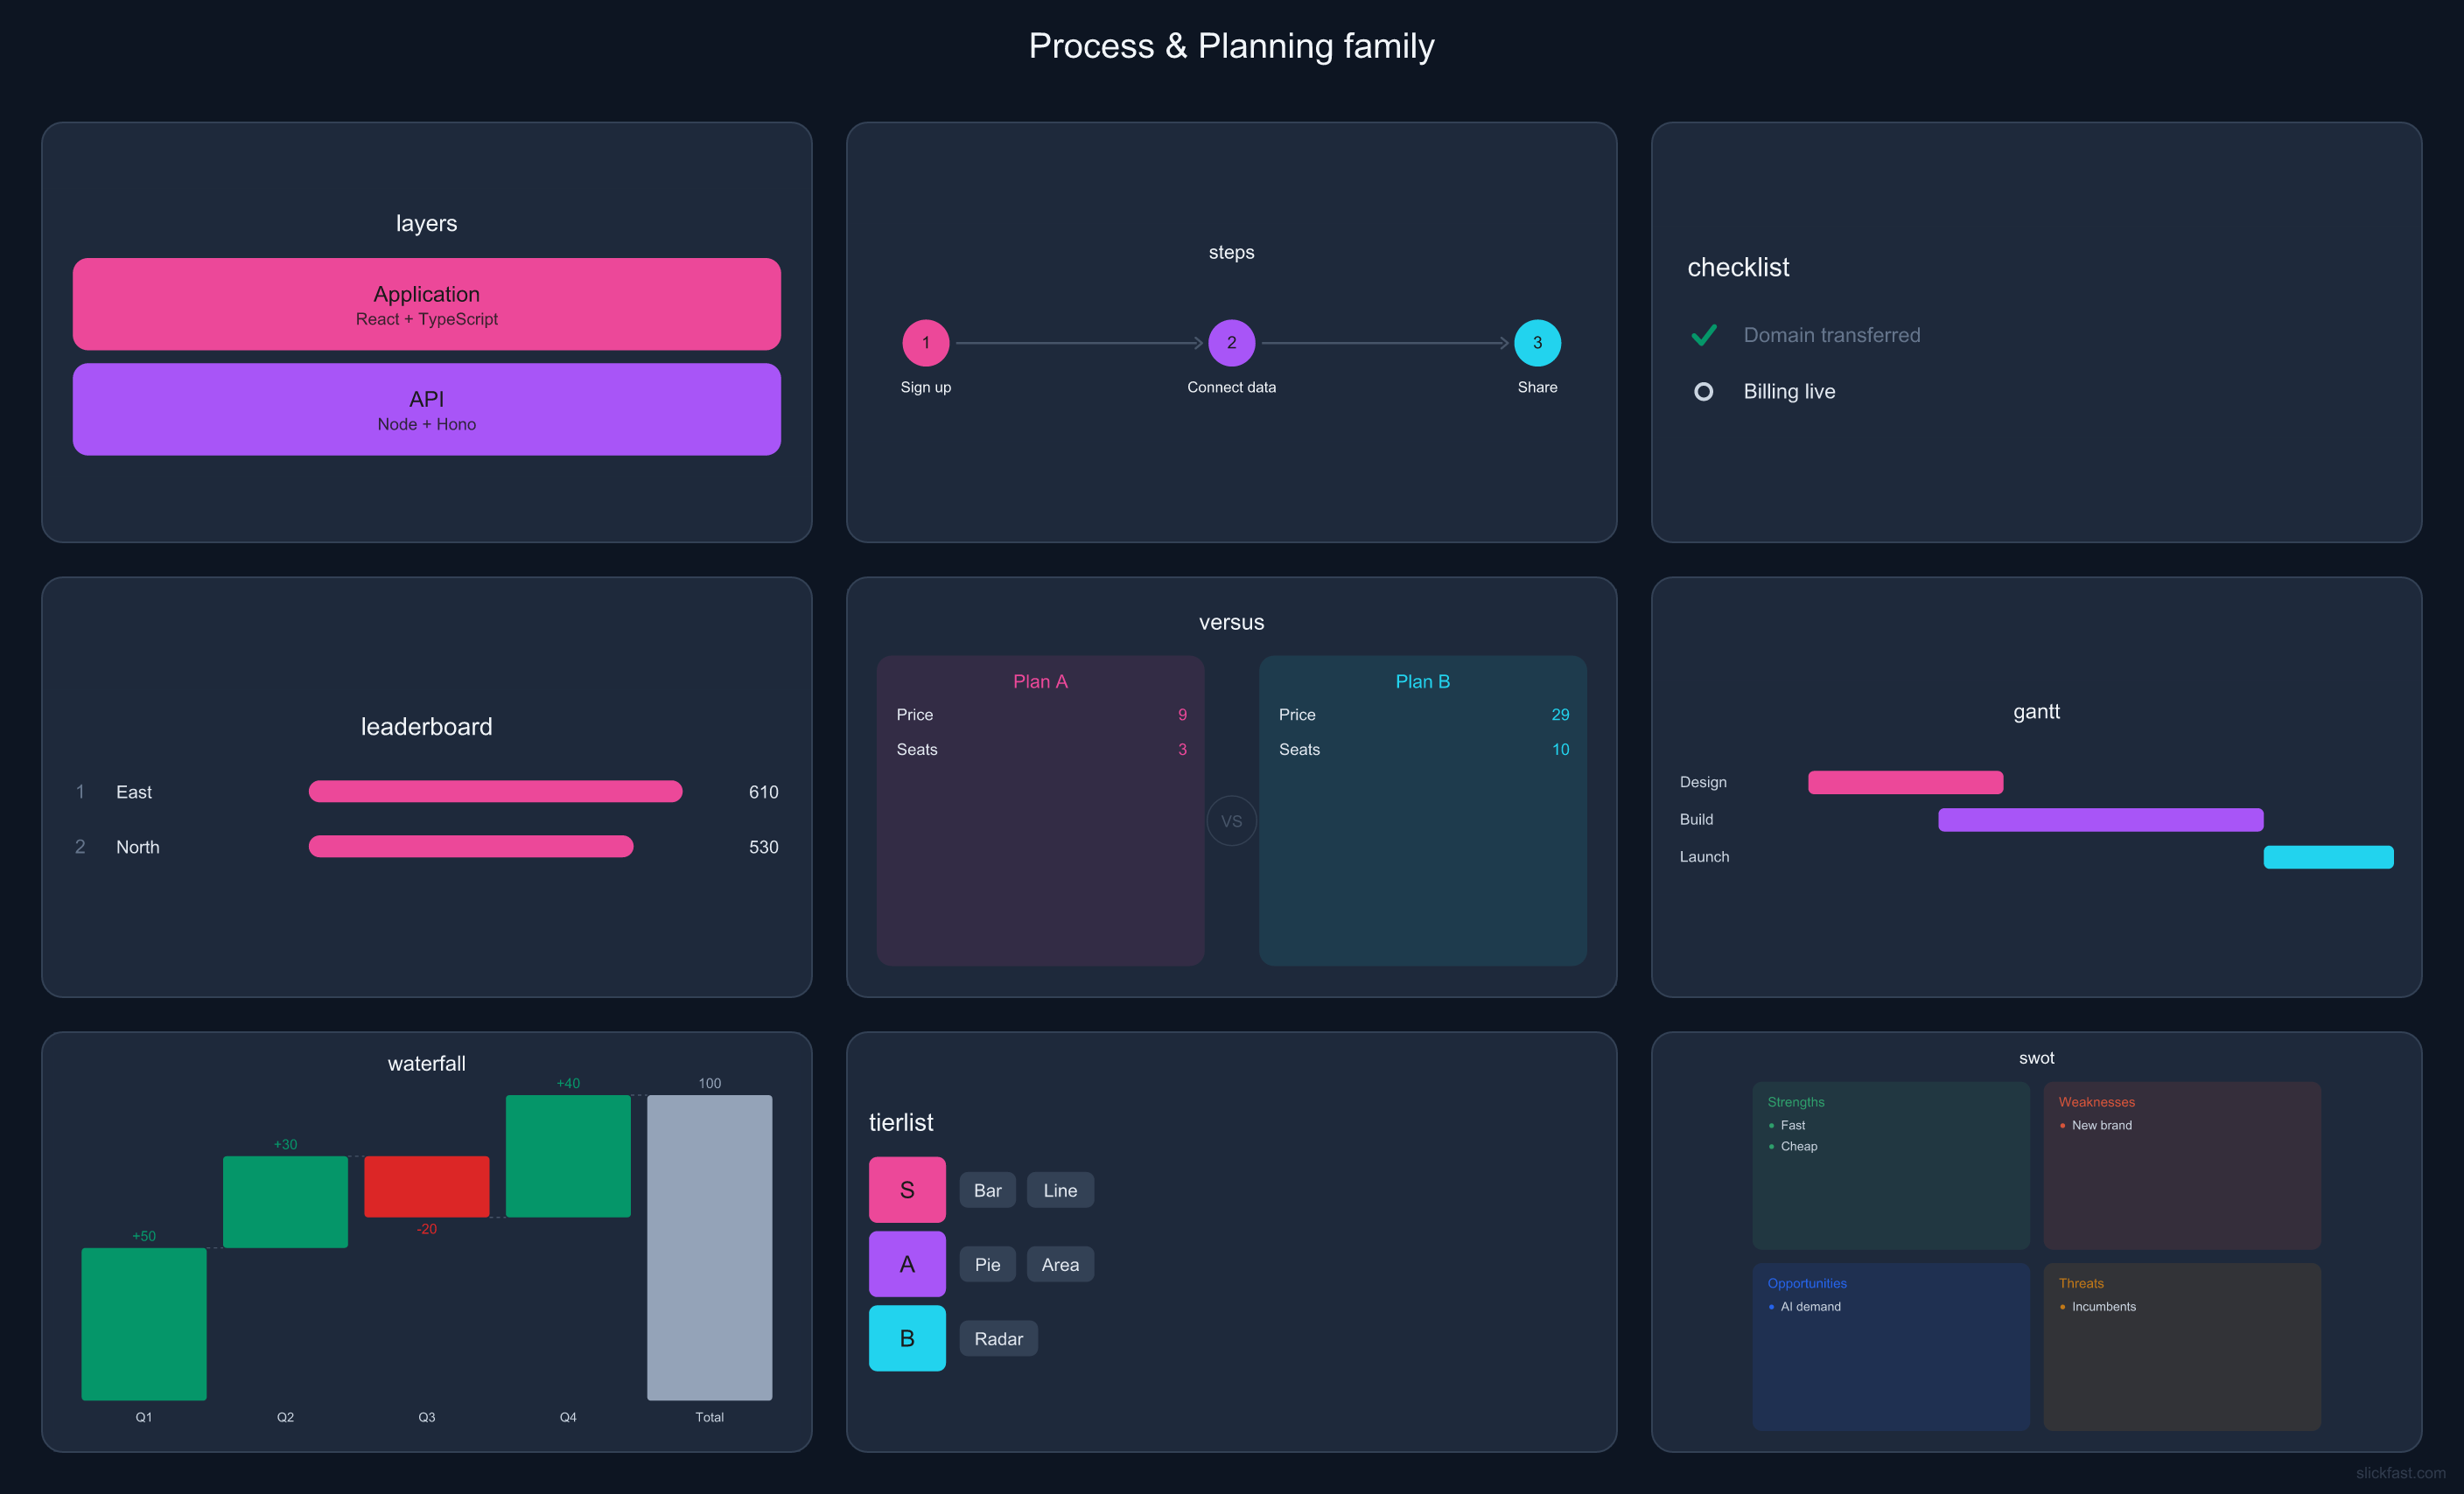
Process & planning family · Cyberpunk — gantt · swimlane · steps · timeline · waterfall
Pricing
Simple plans, metered in renders.
A render is one chart or one whole dashboard. CDN-cached — one render can serve any number of views.
Using SlickFast with your agent? That's free.
The MCP runs on your machine — free forever, unlimited renders, all 47 types, no account, no card, nothing sent anywhere. The plans below are only for the hosted API: public chart URLs rendered and cached by api.slickfast.com, for embedding in Slack, email, or a webpage. If you never need a public URL, you never need a plan.
Free
$0/mo
250 renders/mo · 5 live charts
- All 47 types + dashboards
- SVG & PNG output
- Shareable chart URLs, CDN-cached
- 5 live charts — views free & unlimited
- No card required
MOST POPULAR
Pro
$29/mo
10,000 renders/mo · 25 live charts
- Everything in Free
- 25 live charts + watermark removed
- Room for real agent workloads
- Embed anywhere — Slack, email, docs
Scale
$79/mo
50,000 renders/mo · 100 live charts
- Everything in Pro
- 100 live charts, watermark-free
- Built for fleets of agents
What counts as a render? Only drawing a new chart. Each unique chart renders once — after that, every view of its URL is served from cache, free and uncounted. A million people can look at the same chart and your meter ticks once. You pay when we draw — not every time someone looks. Change the data and that's a new render; a chart may occasionally re-render (first views from a new region, or after long inactivity) — a few extra ticks, not per-view billing.
Live charts: creating one or pushing new data counts as a render — but views are free and unlimited on every tier. Your audience is never metered: a live chart in a README seen ten thousand times costs you nothing extra. Quotas reset monthly; if you hit yours, creates and pushes pause but your embeds keep serving the last data. Live charts belong to your account — rotate keys freely, your charts follow you.
Need more than 50k renders? Write to feedback@slickfast.com. Want the engine inside your own product? See commercial licensing.
Install
Two ways in: local MCP, or one URL.
The MCP runs on your machine via npx — no clone, no build, nothing leaves your machine. The hosted API turns a spec into a public image URL.
MCP — 100% local
Claude Desktop · Claude Code · Cursor — add to your MCP config, restart
{
  "mcpServers": {
    "slickfast": {
      "command": "npx",
      "args": ["-y", "@slickfast/mcp"]
    }
  }
}
The package is
@slickfast/mcp on npm
— a self-contained bundle that npx fetches on first run. No clone, no
build step, no global install; needs only Node.js. Renders 100% on your machine.
API — the URL is the chart
Bearer key from any plan · SVG & PNG · CDN-cached
SPEC='{"type":"bar","data":{"labels":["Q1","Q2","Q3"],
       "series":[{"values":[12,19,8]}]}}'

curl "https://api.slickfast.com/chart.png?spec=$(jq -rn --arg s "$SPEC" '$s|@uri')" \
  -H "Authorization: Bearer sf_your_key" \
  --output chart.png
Keys start with sf_ and come from any plan
(Free included). Send via Authorization: Bearer,
X-API-Key, or ?key= for embeddable URLs.
/chart.svg returns vector instead.
One-click installs


Where does the config go?
- Claude Desktop —
Settings → Developer → Edit Config, or edit the file directly: macOS~/Library/Application Support/Claude/claude_desktop_config.json, Windows%APPDATA%\Claude\claude_desktop_config.json. Restart Claude after saving. - Cursor —
Settings → MCP → Add new server, or drop the same JSON in~/.cursor/mcp.json. - Claude Code — one command:
claude mcp add slickfast -- npx -y @slickfast/mcp.
Try this first
Once it's connected, ask your agent:
"Using SlickFast, build a dashboard with an MRR tile, a signups funnel, and a usage heatmap."
You get a finished multi-chart dashboard image back in one call. Want a smaller first step? "render a bar chart of last quarter's revenue", or "show me the SlickFast gallery" to see every type at once.
Not seeing it? Quick fixes
- Restart the app after editing the config — MCP servers only load at startup.
- Needs Node.js (v18+). Check with
node -v; install from nodejs.org if it's missing. - First run is slow —
npxdownloads the package once, then every run is instant. - The JSON must be valid — one stray comma breaks the whole config. Paste the block exactly.
- Still stuck? Open an issue — we read every one.
License
Free and open source.
SlickFast is open source under AGPL-3.0. Using it with your agent is free, the charts you make are yours, and running it in-house is free. Want SlickFast inside a commercial product or service? Simple per-app commercial licenses start at $99/year — no license keys, no hoops.
Roadmap
What's next.
SHIPPED ✓
Live Charts
One chart URL, always current — embed it anywhere an image loads. It's live — see it in action ↑
SOON
Hosted MCP — SlickFast on claude.ai & cloud agents
No install: paste one URL into claude.ai or your cloud builder and your agent can draw. Same tools as the local MCP, metered on the same free tier.
SOON
Charts for Email
A chart in the inbox that's current at every open, not a stale screenshot — weekly-numbers emails, usage digests, newsletter data-viz.
SOON
Playground
Edit a spec in the browser and watch the chart re-render as you type.
ONGOING
More types, palettes & board layouts
The engine grows steadily — 47 types today, and the tiling system keeps getting more expressive.
Docs
One JSON spec. That's the whole API.
Everything an agent — or you — needs to know, in five short docs.
Click anywhere or press Esc to close