I want to be able to record, stream, screen share, and do speech recognition, possibly all at the same time. If I just try having those processes read directly from my microphone, I find that the audio skips. I'm on Linux, so it turns out that I can set up Pipewire with a virtual audio cable (loopback device) connecting my microphone to a virtual output (null sink) with some latency (100ms seems good) so that multiple applications listening to the null sink can get the audio packets smoothly.
I was getting a little confused connecting things to other things, though. qpwgraph was helpful for starting to understand how everything was actually connected to each other, and also for manually changing the connections on the fly.
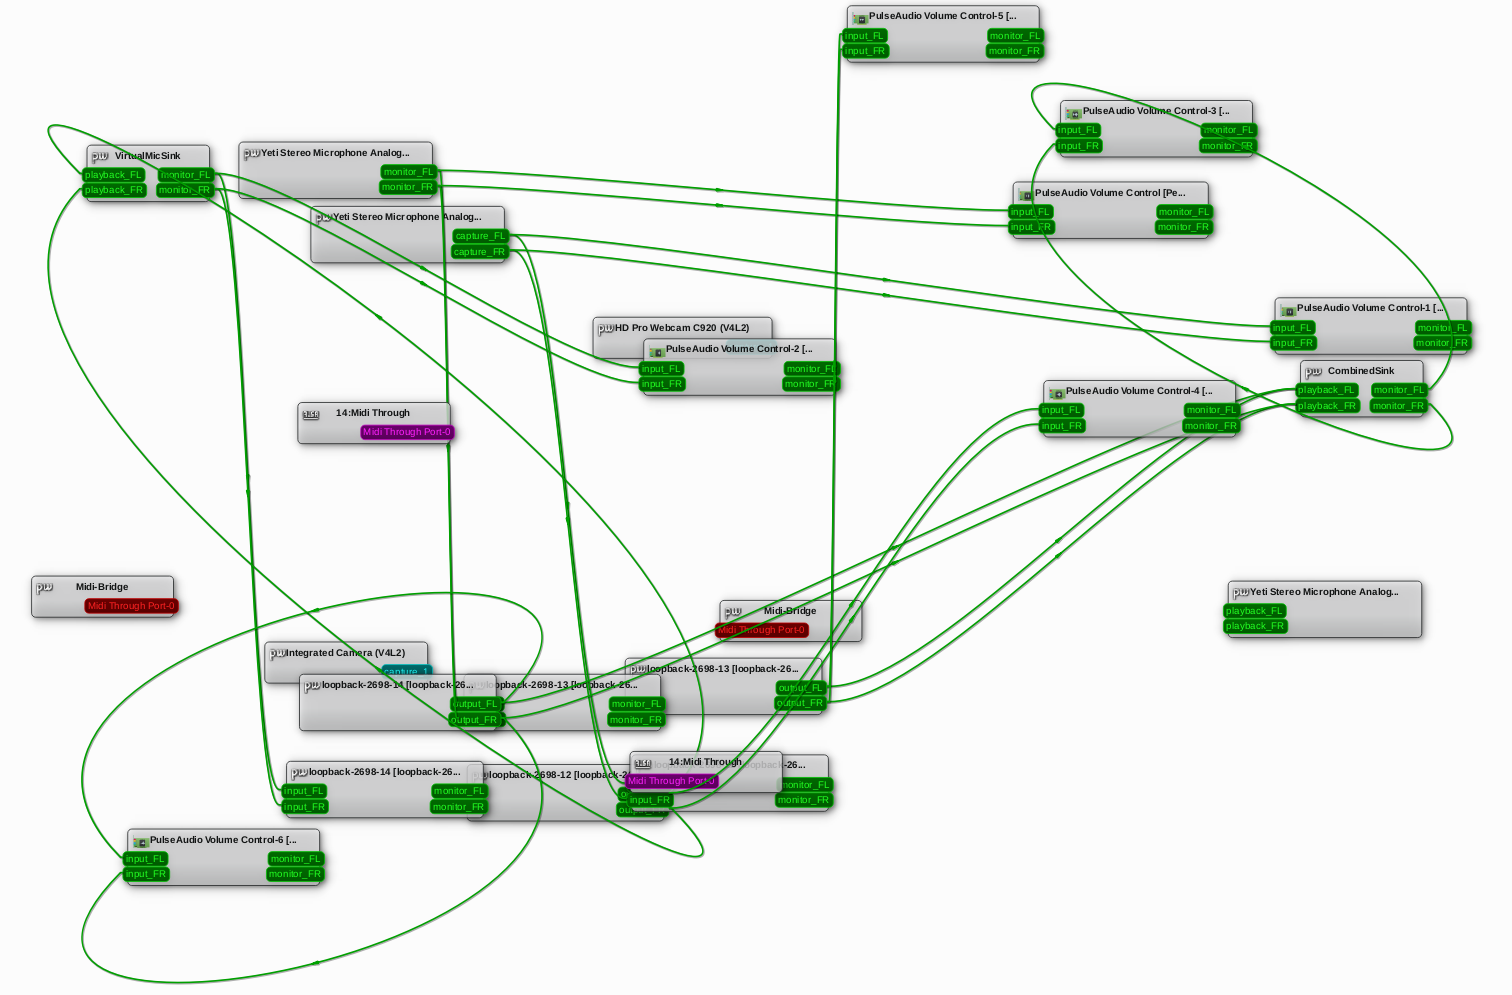
Like with other graphical applications, I found myself wondering: could I do this in Emacs instead? I wanted to just focus on a small set of the nodes. For example, I didn't need all of the lines connecting to the volume control apps. I also wanted the ability to focus on whichever nodes were connected to my microphone.
Unsurprisingly, there is a pipewire package in MELPA.
I want to see and manage the connections between devices, though, so I started working on
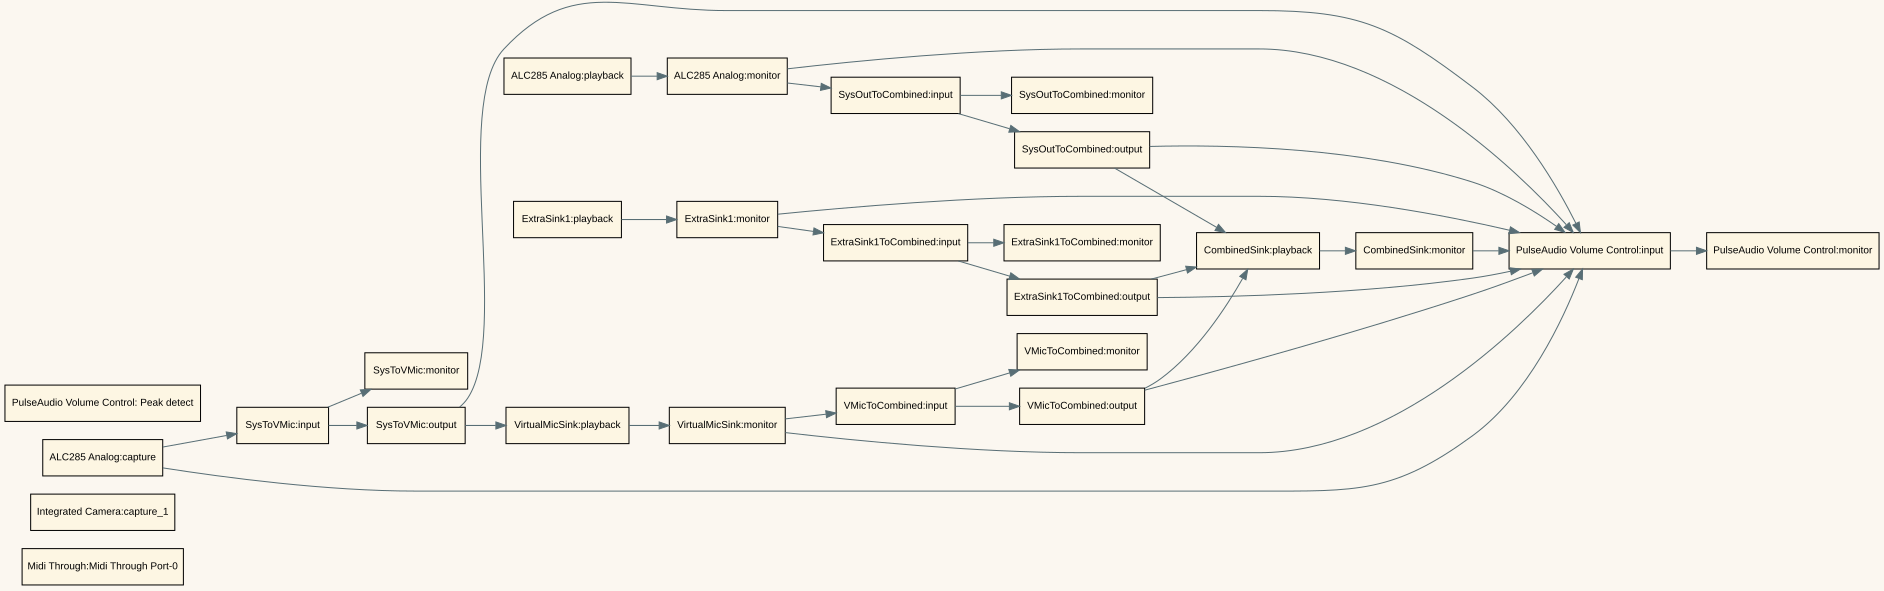
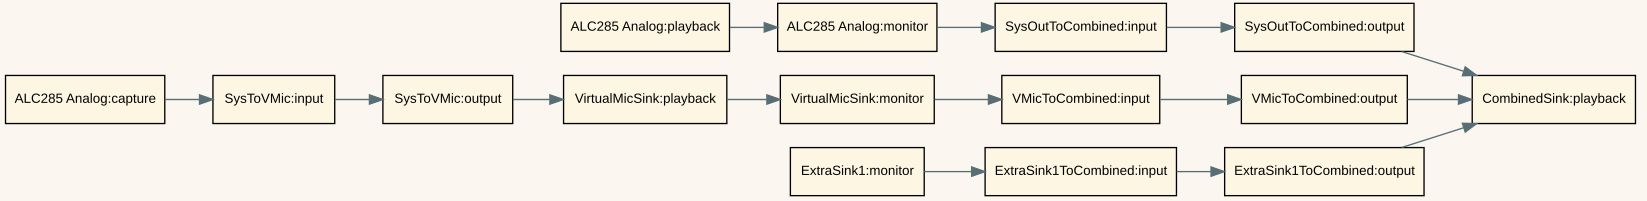
sachac/epwgraph: Emacs Pipewire graph visualization. This is what epwgraph-show looks like with everything in it:
Let's call it with C-u, which prompts for a regexp of nodes to focus on and another regexp for nodes to exclude. Then I can ignore the volume control:
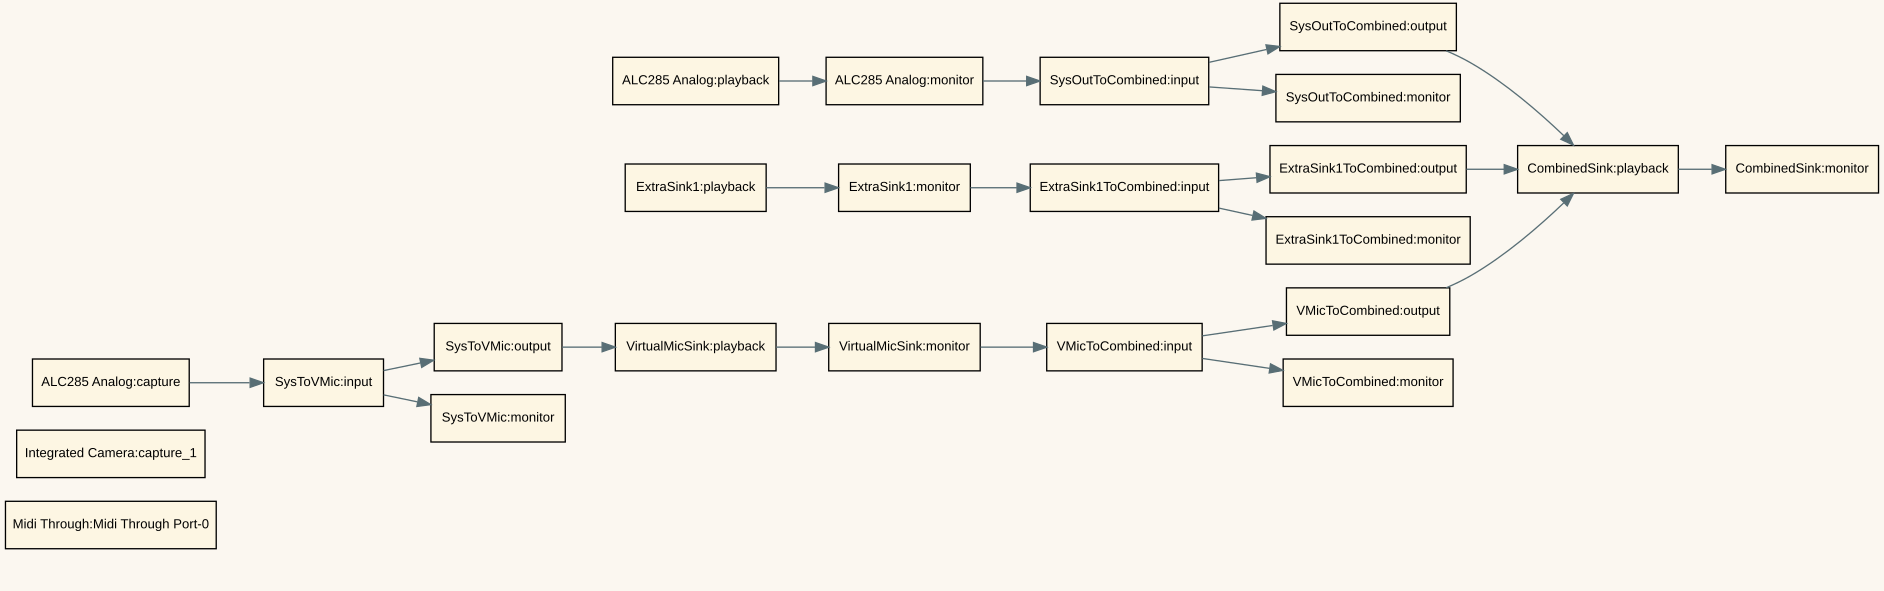
I can focus on just the things that are connected to my microphone:
This also lets me disconnect things with d (epwgraph-disconnect-logical-nodes):
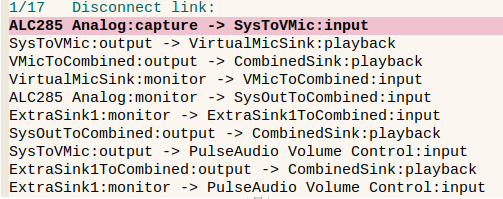
and connect them with c (epwgraph-connect-logical-nodes).
I don't have a fancy 5.1 sound systems, so the logic for connecting nodes just maps L and R if possible.
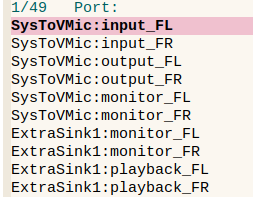
Most of the time I just care about the logical devices instead of the specific left and right channels, but I can toggle the display with t so that I can see specific ports:
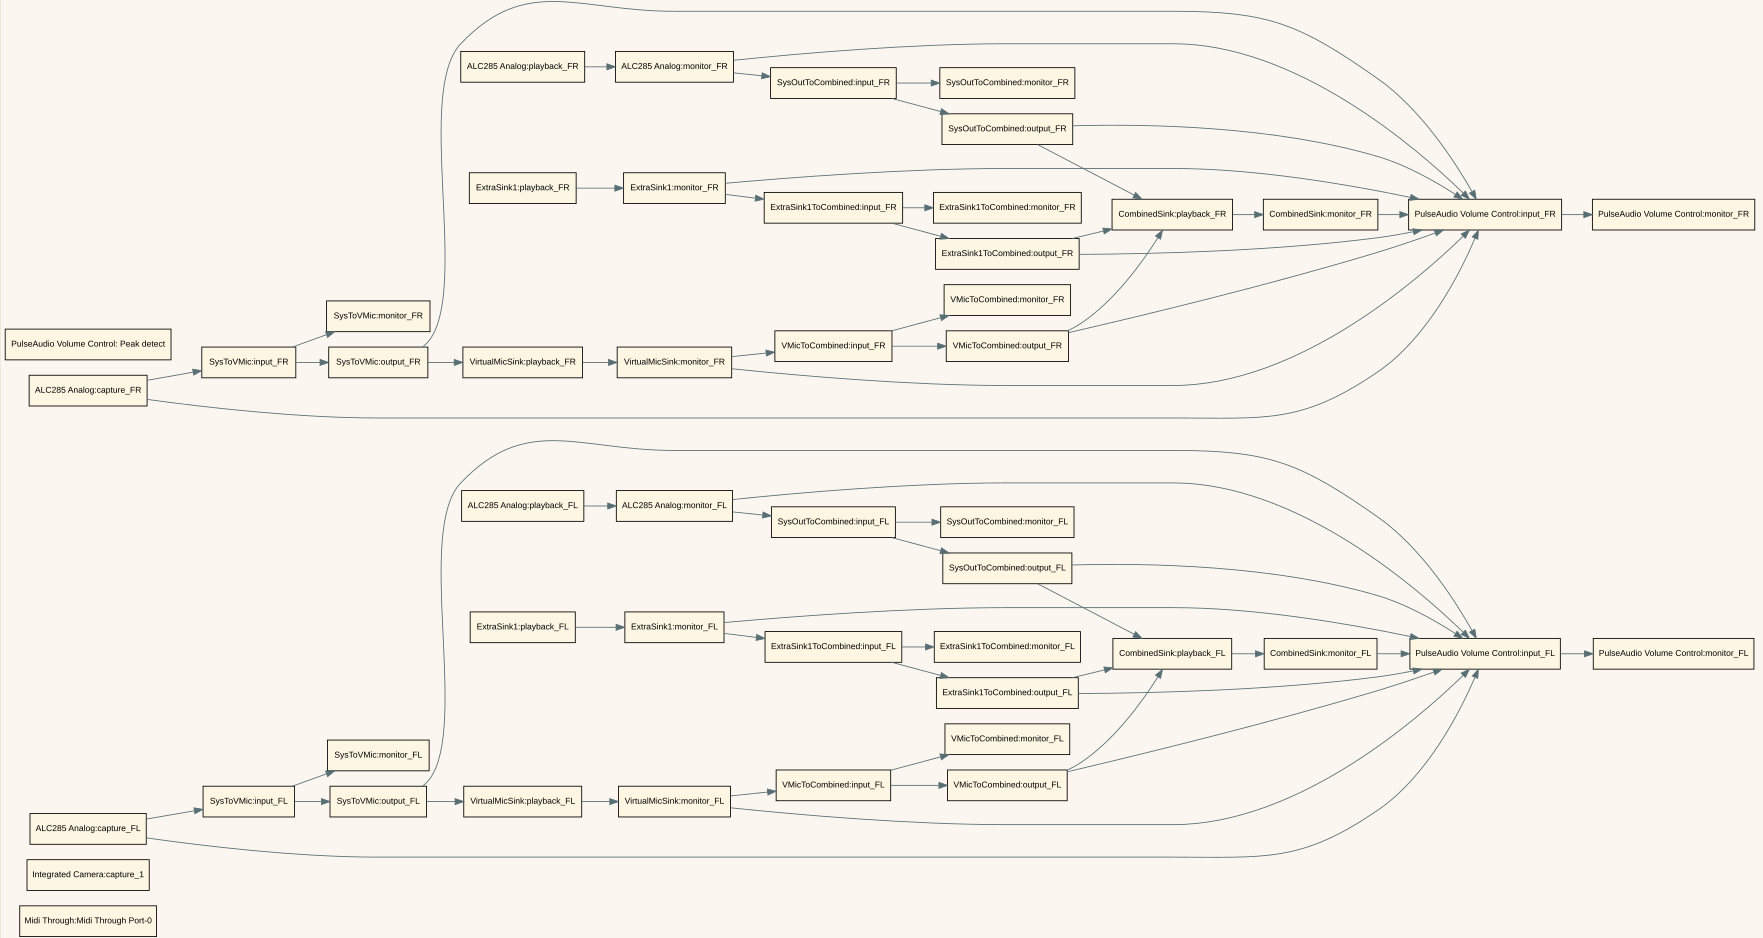
and I can use C and D to work with specific ports as well.
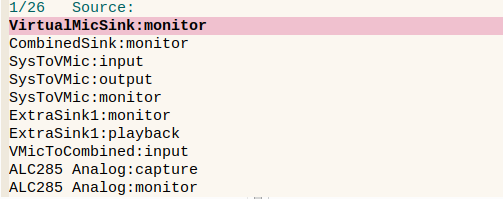
I usually just want to quickly rewire a node so that it gets its input from a specified device, which I can do with i (epwgraph-rewire-inputs-for-logical-node).
I think this will help me stay sane when I try to scale up my audio configuration to having four or five web conferences going on at the same time, possibly with streaming speech recognition.
Ideas for next steps:
- I want to be able to set the left/right balance of audio, probably using
pactl set-sink-volume <index> left% right% - I'd love to be able to click on the graph in order to work with it, like dragging from one box to another in order to create a connection, right-drag to disconnect, or shift-drag to rewire the inputs.
In case this is useful for anyone else: