During my usual daily routine of reading the newspaper, a front-page photograph suddenly caught my attention.
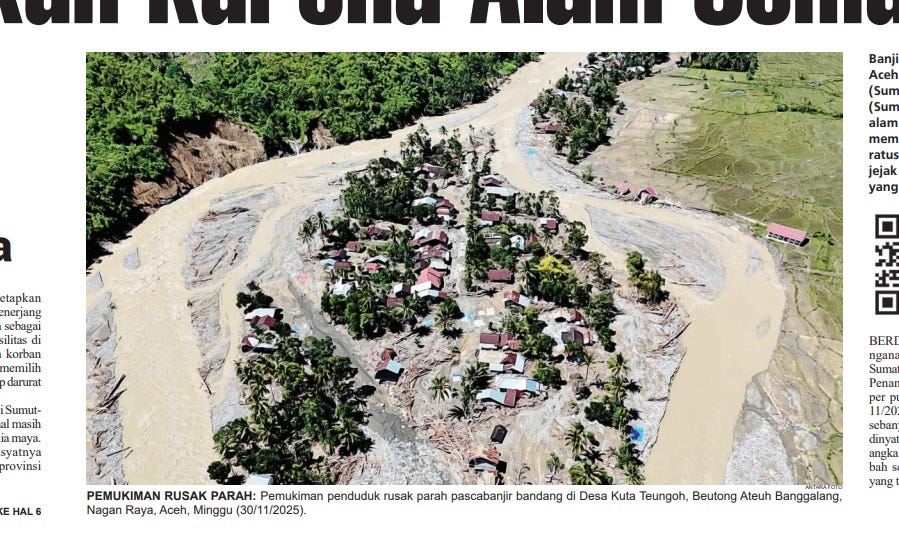
It showed part of the heavy flooding triggered by Cyclonic Storm Senyar in Aceh, specifically in Kuta Teungoh, Beutong Ateuh Balanggang, Nagan Raya.
The scene looked as if the village were flanked by rivers on both sides, and I wanted to confirm exactly where the photo had been taken and compare pre- and post-flood satellite imagery.
I started with Google Maps, which generally offers good Indonesian administrative boundary data. The address listed in the caption contained four toponyms arranged from lowest to highest hierarchy: “Kuta Teungoh, Beutong Ateuh Balanggang, Nagan Raya, Aceh.”
The challenge is that the lowest tier of Indonesian place names is often informal. These names are used in day-to-day conversation but aren’t always part of the official administrative structure. In contrast, mid- and upper-level toponyms usually match government-defined boundaries, so map searches for those tend to be more reliable.
Because of this specific quirk, pasting the entire address into Google Maps doesn’t always return a useful result.
So instead, a more reliable workflow is to split the address into a “higher” and “lower” portion.
I began by searching for the higher segment: “Beutong Ateuh Balanggang, Nagan Raya, Aceh.” This immediately zoomed the map into the correct subdistrict, confirming that these names correspond to official boundaries.
Once the map was already centered on the correct area, I searched for the lower portion: “Kuta Teungoh, Beutong Ateuh Balanggang.” This forces Google Maps to look for relevant points of interest within the already-defined locality. Even if the smallest toponym isn’t an official administrative unit, there’s a good chance that a local Google Maps contributor has marked it on the map (as a “point of interest” data).
In this case, the method worked, and the location surfaced.
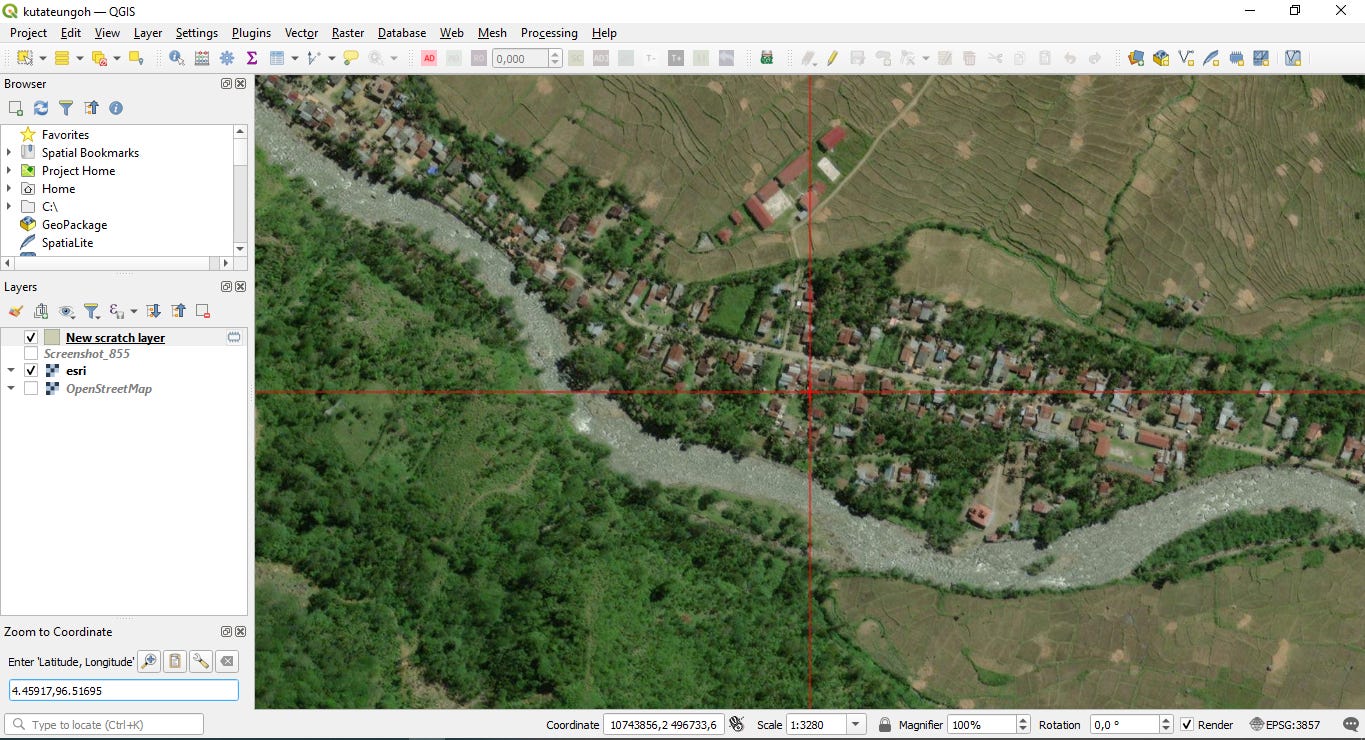
I copied the coordinates from Google Maps (right click) and moved into QGIS, loaded the ESRI satellite imagery basemap, and examined the area.
After zooming out slightly, the residential cluster identified as Kuta Teungoh became clear. In a remote region dominated by forest and undeveloped land, the built-up portion of the village stood out cleanly against the surrounding green landscape.
This imagery served as the “before” condition.

To obtain the “after” view, I pasted the same coordinates into the Copernicus Browser and checked the most recent Sentinel imagery available for the area.
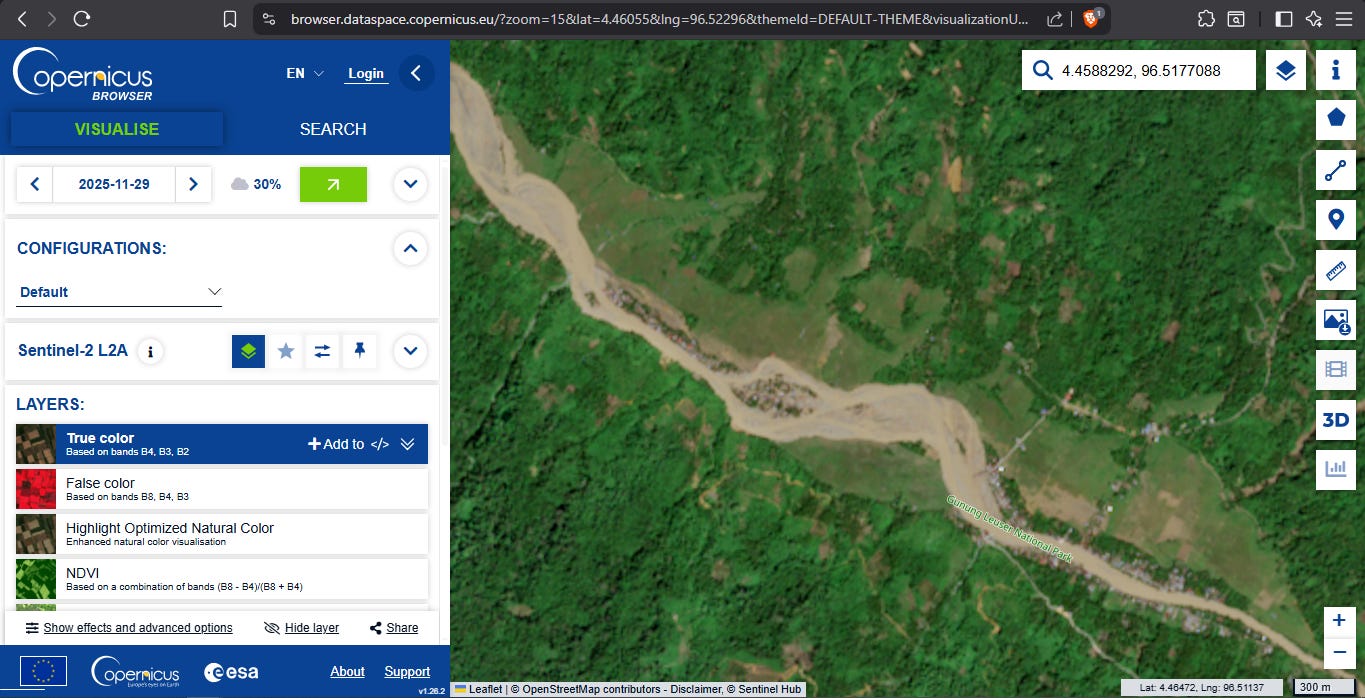
The flooded section was immediately visible, with water encircling part of the settlement from both sides.
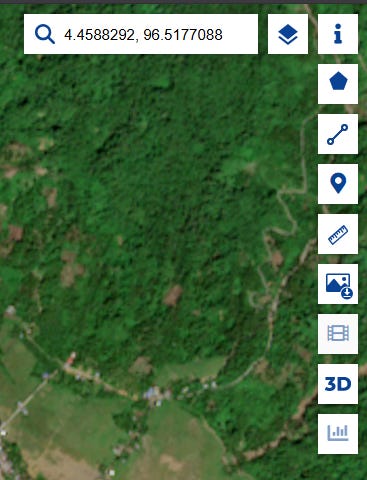
To refine the coordinate reference, I used the “mark point of interest” tool in the Copernicus interface and copied the updated coordinate pair back into QGIS.

I exported a screenshot of the post-flood Sentinel imagery and loaded it into QGIS using the Freehand Raster Georeferencer plugin. That allowed me to overlay the “after” scene directly on top of the “before” imagery. By gradually adjusting the transparency, I could create a smooth visual transition between the two states.
I captured this transition as a short timelapse using ShareX.