Note: Work in progress — Caveat lector!
The international committee responsible for the official scenarios that feed into climate modeling that are the basis for most projective climate research and the assessments of the Intergovernmental Panel on Climate Change (IPCC) has just published the next generation of climate scenarios.
Big news: The new framework has eliminated the most extreme scenarios that have dominated climate research over much of the past several decades — specifically, RCP8.5, SSP5-8.5, and SSP3-7.0. This is an absolutely huge development in climate science which will have lasting impacts across research and policy.
The future is not what it used to be.
Today’s post commends the researchers who have brought climate scenarios more in line with current understandings, but also raises some significant continuing issues with the scenarios.
Let’s get started . . .
The new scenarios come from the Coupled Model Intercomparison Project (CMIP) — a project of the World Climate Research Programme (WCRP), co-sponsored by the World Meteorological Organization, the International Science Council, and UNESCO’s Intergovernmental Oceanographic Commission.
Under CMIP, now in its seventh iteration, sits another little-known committee with responsibility for developing the scenarios necessary for earth system models to project future climate.1 That committee — called ScenarioMIP — just published the new scenario framework that will underpin the IPCC’s Seventh Assessment Report (AR7) and much of the research that it will draw upon.
In a paper released earlier this month, Van Vuuren et al. (VVetal26) introduce a new set of seven scenarios. The authors write of the obsolete high end emissions scenarios (emphasis added):
“For the 21st century, this range will be smaller than assessed before: on the high-end of the range, the CMIP6 high emission levels (quantified by SSP5-8.5) have become implausible, based on trends in the costs of renewables, the emergence of climate policy and recent emission trends.”
Read that again — The high end scenarios are Implausible.2
I disagree that the implausibility of the high-end scenarios resulted from the falling costs of renewables or the emergence of climate policy, but that is a debate for another day.
What matters today is that the group with official responsibility for developing climate scenarios for the IPCC and broader research community has now admitted that the scenarios that have dominated climate research, assessment, and policy during the past two cycles of the IPCC assessment process are implausible: They describe impossible futures.
Tens of thousands of research papers have been — and continue to be — published using these scenarios, a similar number of media headlines have amplified their findings, and governments and international organization have built these implausible scenarios into policy and regulation.
We now know that all of this is built on a foundation of sand.
The new CMIP7 ScenarioMIP framework offers seven scenarios spanning a range from “VERY LOW” through “HIGH.” The current naming convention drops the radiative-forcing target labels of the SSP era — there is no “8.5” scenario, and no “7.0” scenario, but as I’ll show below, each scenario has a radiative forcing level in 2100.
I ran the available new scenarios (HIGH, MEDIUM, LOW, and VERY LOW) through the FaIR calibrated and constrained ensemble that Sanderson and Smith (2025) used to characterize the CMIP7 set (FaIR v. 2.2.0 as described in their README file). I then ran each of the five tier-1 SSPs through the same emulator with identical parameters to ensure that the results are apples-to-apples. The full methodology, data, and code is in the appendix to this post.
The headline results follow.
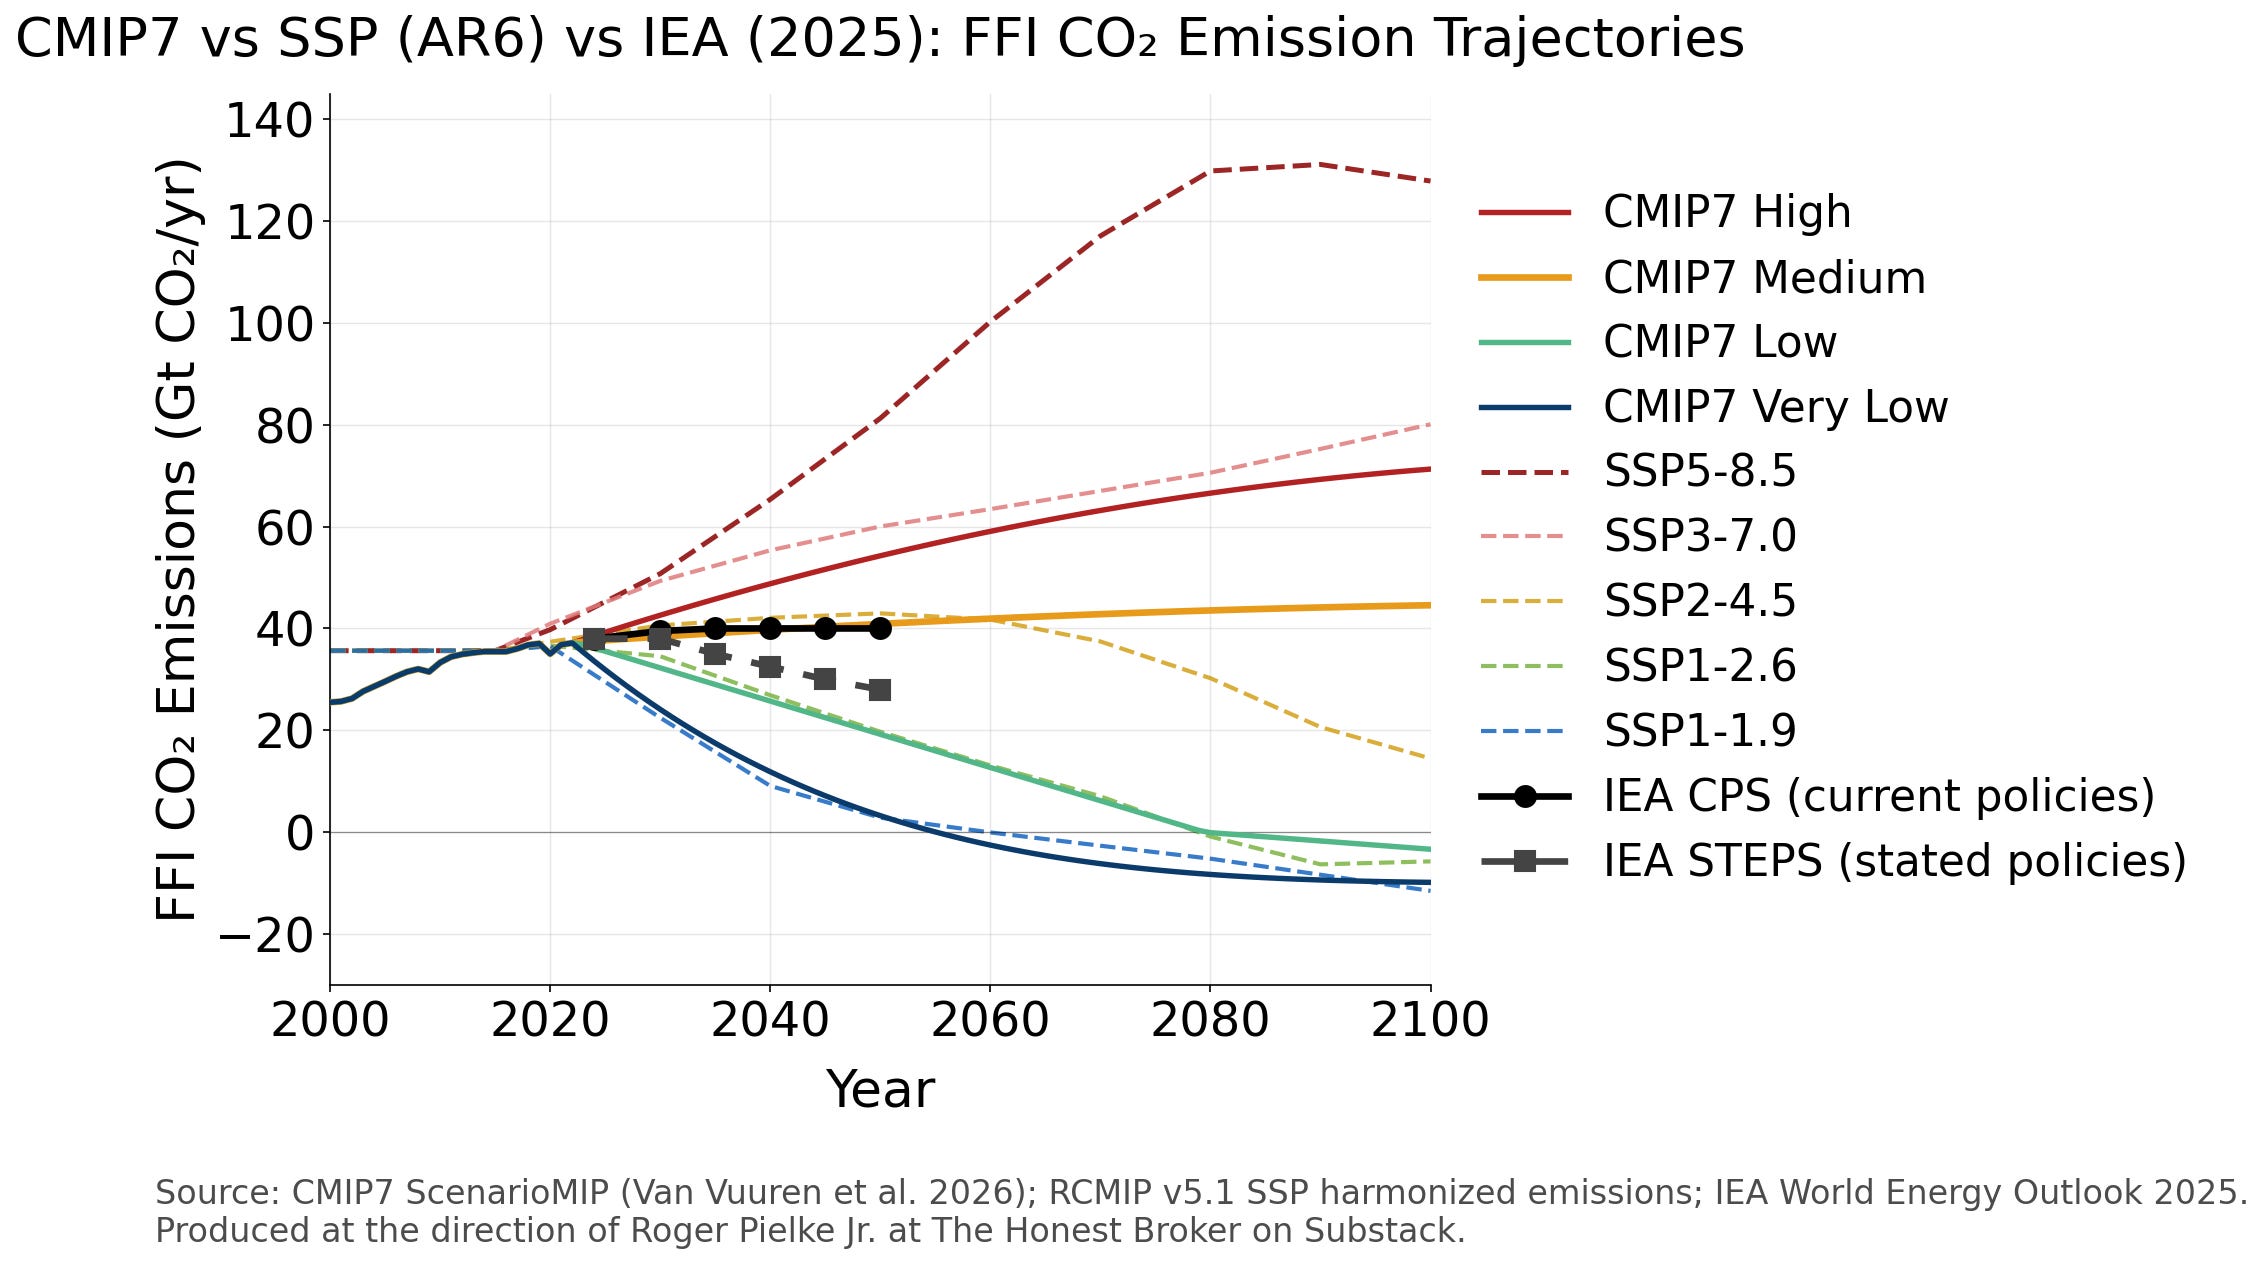
The chart above shows fossil-fuel and industry CO₂ emissions for four CMIP7 scenarios alongside the five tier-1 SSPs and the two main reference scenarios from the 2025 IEA World Energy Outlook.
Note the massive gap between the new HIGH and SSP5-8.5. The new HIGH reaches 71 Gt CO₂/yr in 2100 — far below SSP5-8.5 at 128 Gt in 2100. Nothing in the CMIP7 set comes close to SSP5-8.5. The new HIGH also sits below SSP3-7.0 by about 9% in terms of cumulative emissions to 2100. Note also the gap between MEDIUM (solid yellow) and SSP2-4.5 (dashed yellow), which I’ll return to below.
Both of the most recent IEA near term scenarios — which run to 2050 — fall below MEDIUM and SSP2-4.5.
The table below compares the CMIP7 scenarios to their closest AR6 analogues, showing that the overall range has constricted. The higher scenarios have come down and the lower scenarios have come up — except VERY LOW, which moved down.

The table below lists AR6 and CMIP7 scenarios from highest to lowest 2100 radiative forcing. The middle column shows the average global temperature change from an 1850-1900 baseline, under the climate emulator used by CMIP7. The right column shows the average temperature change for the SSPs as projected by the IPCC AR6.
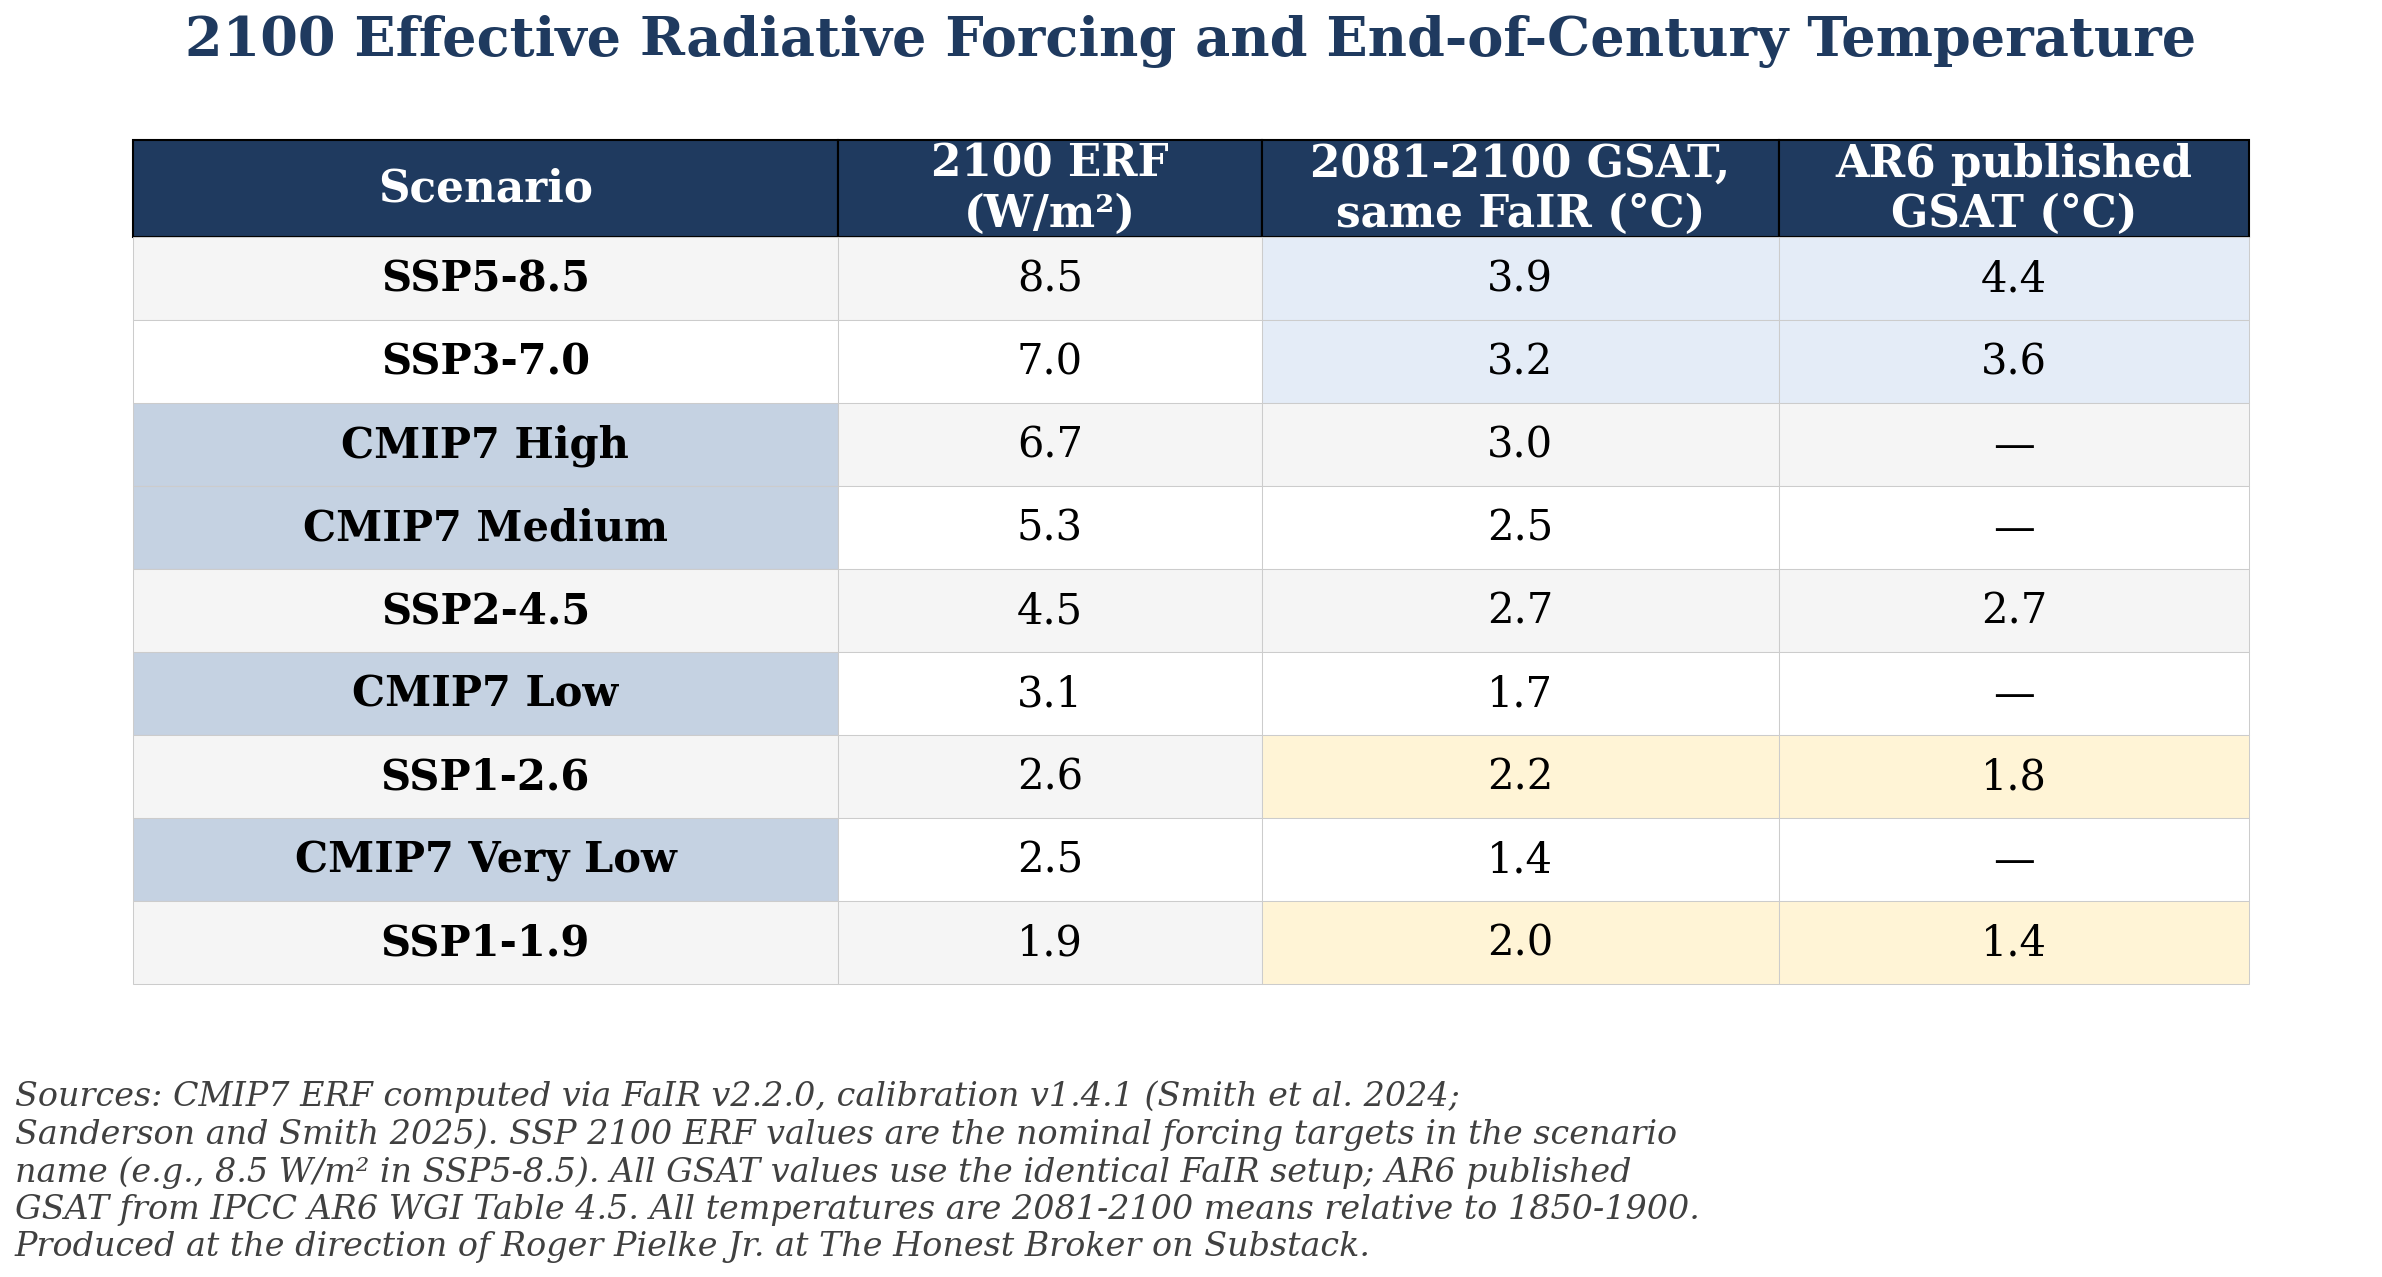
Interestingly, the projected 2080-2100 temperatures of the SSPs decreased from their AR6 values based solely on recent updates to the FaIR climate emulator.3 These changes resulted primarily from the updating of emissions trajectories from 2014 (used in AR6) to 2023 (used by CMIP7). The more moderate emissions trajectories resulted in lower projected end-of-century temperature increases.
The new CMIP7 HIGH is 0.9°C cooler than SSP5-8.5 in apples-to-apples terms (and 1.4°C cooler versus IPCC AR6), and 0.2°C cooler than SSP3-7.0 (-0.6°C against IPCC AR6).
The implausibility of upper-end legacy scenarios is now official.
Last April I argued here at THB that the climate science community was on the brink of repeating the RCP8.5 mistake with SSP3-7.0 — which assumed a 2100 global population approaching 13 billion, well above any contemporary demographic projection and a five-fold expansion of global coal use. Neither assumption survives current understandings of demographics or energy systems.
I don’t know if anyone in CMIP or ScenarioMIP reads THB4 — if not they should! — but regardless, they wisely chose not to adopt SSP3-7.0 as the new HIGH scenario.
The new HIGH scenario sits at 6.7 W/m² in 2100 — below the SSP3 baseline 7.0 W/m² — with 9 percent less cumulative fossil CO₂ through 2100. As I’ll discuss below, this is progress; it is partial but real.
But the new HIGH still sits well above the plausibility range that we identified in Pielke, Burgess, and Ritchie (2022). We found that of the >1,000 scenarios in the AR5 database, the plausible subset centered on a median of ~3.4 W/m² in 2100, with an upper end near 6 W/m². The new HIGH scenario is well above that upper end.
The authors of Van Vuuren et al. partially acknowledge that the new HIGH scenario is exploratory — a thought experiment, not a projection:
“Clearly, this scenario is not a “business-as-usual” scenario nor the no-policy reference scenario for the other scenarios. The scenario is intended to explore the upper end of GHG emissions resulting from deep political, technological, and structural deviation from current trends.”
Note that first sentence — It means that any future research that compares the HIGH scenario to lower scenarios in order to characterize the effects of climate policy will be fundamentally flawed. The HIGH scenario is not a projective scenario, but a “what if?” exercise.
Unfortunately, Van Vuuren et al. then engage in some unsupported speculation about the plausibility of the HIGH scenario in the real world:
“The are various reasons why such a scenario could emerge. For instance, a rollback of climate policies could result from a lack of public support for the energy transition. This could be related to, for instance, local opposition to building new wind farms or concerns about impacts on fossil industries related to jobs and national energy security. Also, the rapid cost decrease in renewable energy of the past decade could be discontinued, possibly as a result of regional scarcity and limited tradability in materials for solar and wind technologies and EV batteries . . .”
As discussed below, the new population assumptions of the updated SSP3 are ridiculous, and by themselves render the HIGH scenario implausible. The lack of any systematic effort to evaluate plausibility of scenarios remains a fundamental weakness of the scenario development process.
The new CMIP7 framework does not start from a fresh socioeconomic foundation. Van Vuuren et al. explain:
“In practice, the IAM [Integrated Assessment Modeling] teams have based their current scenarios on various SSPs, as it was generally deemed pragmatic as these come with already available, suitably rich quantifications and were implemented by the participating modelling teams within the given timeline.”
The CMIP7 scenarios rely on the same narrative architecture as the IPCC AR6 SSPs. The table below shows how the SSP storylines map onto the new scenarios — Confusion is sure to result, as the old SSPs are not the new SSPs.
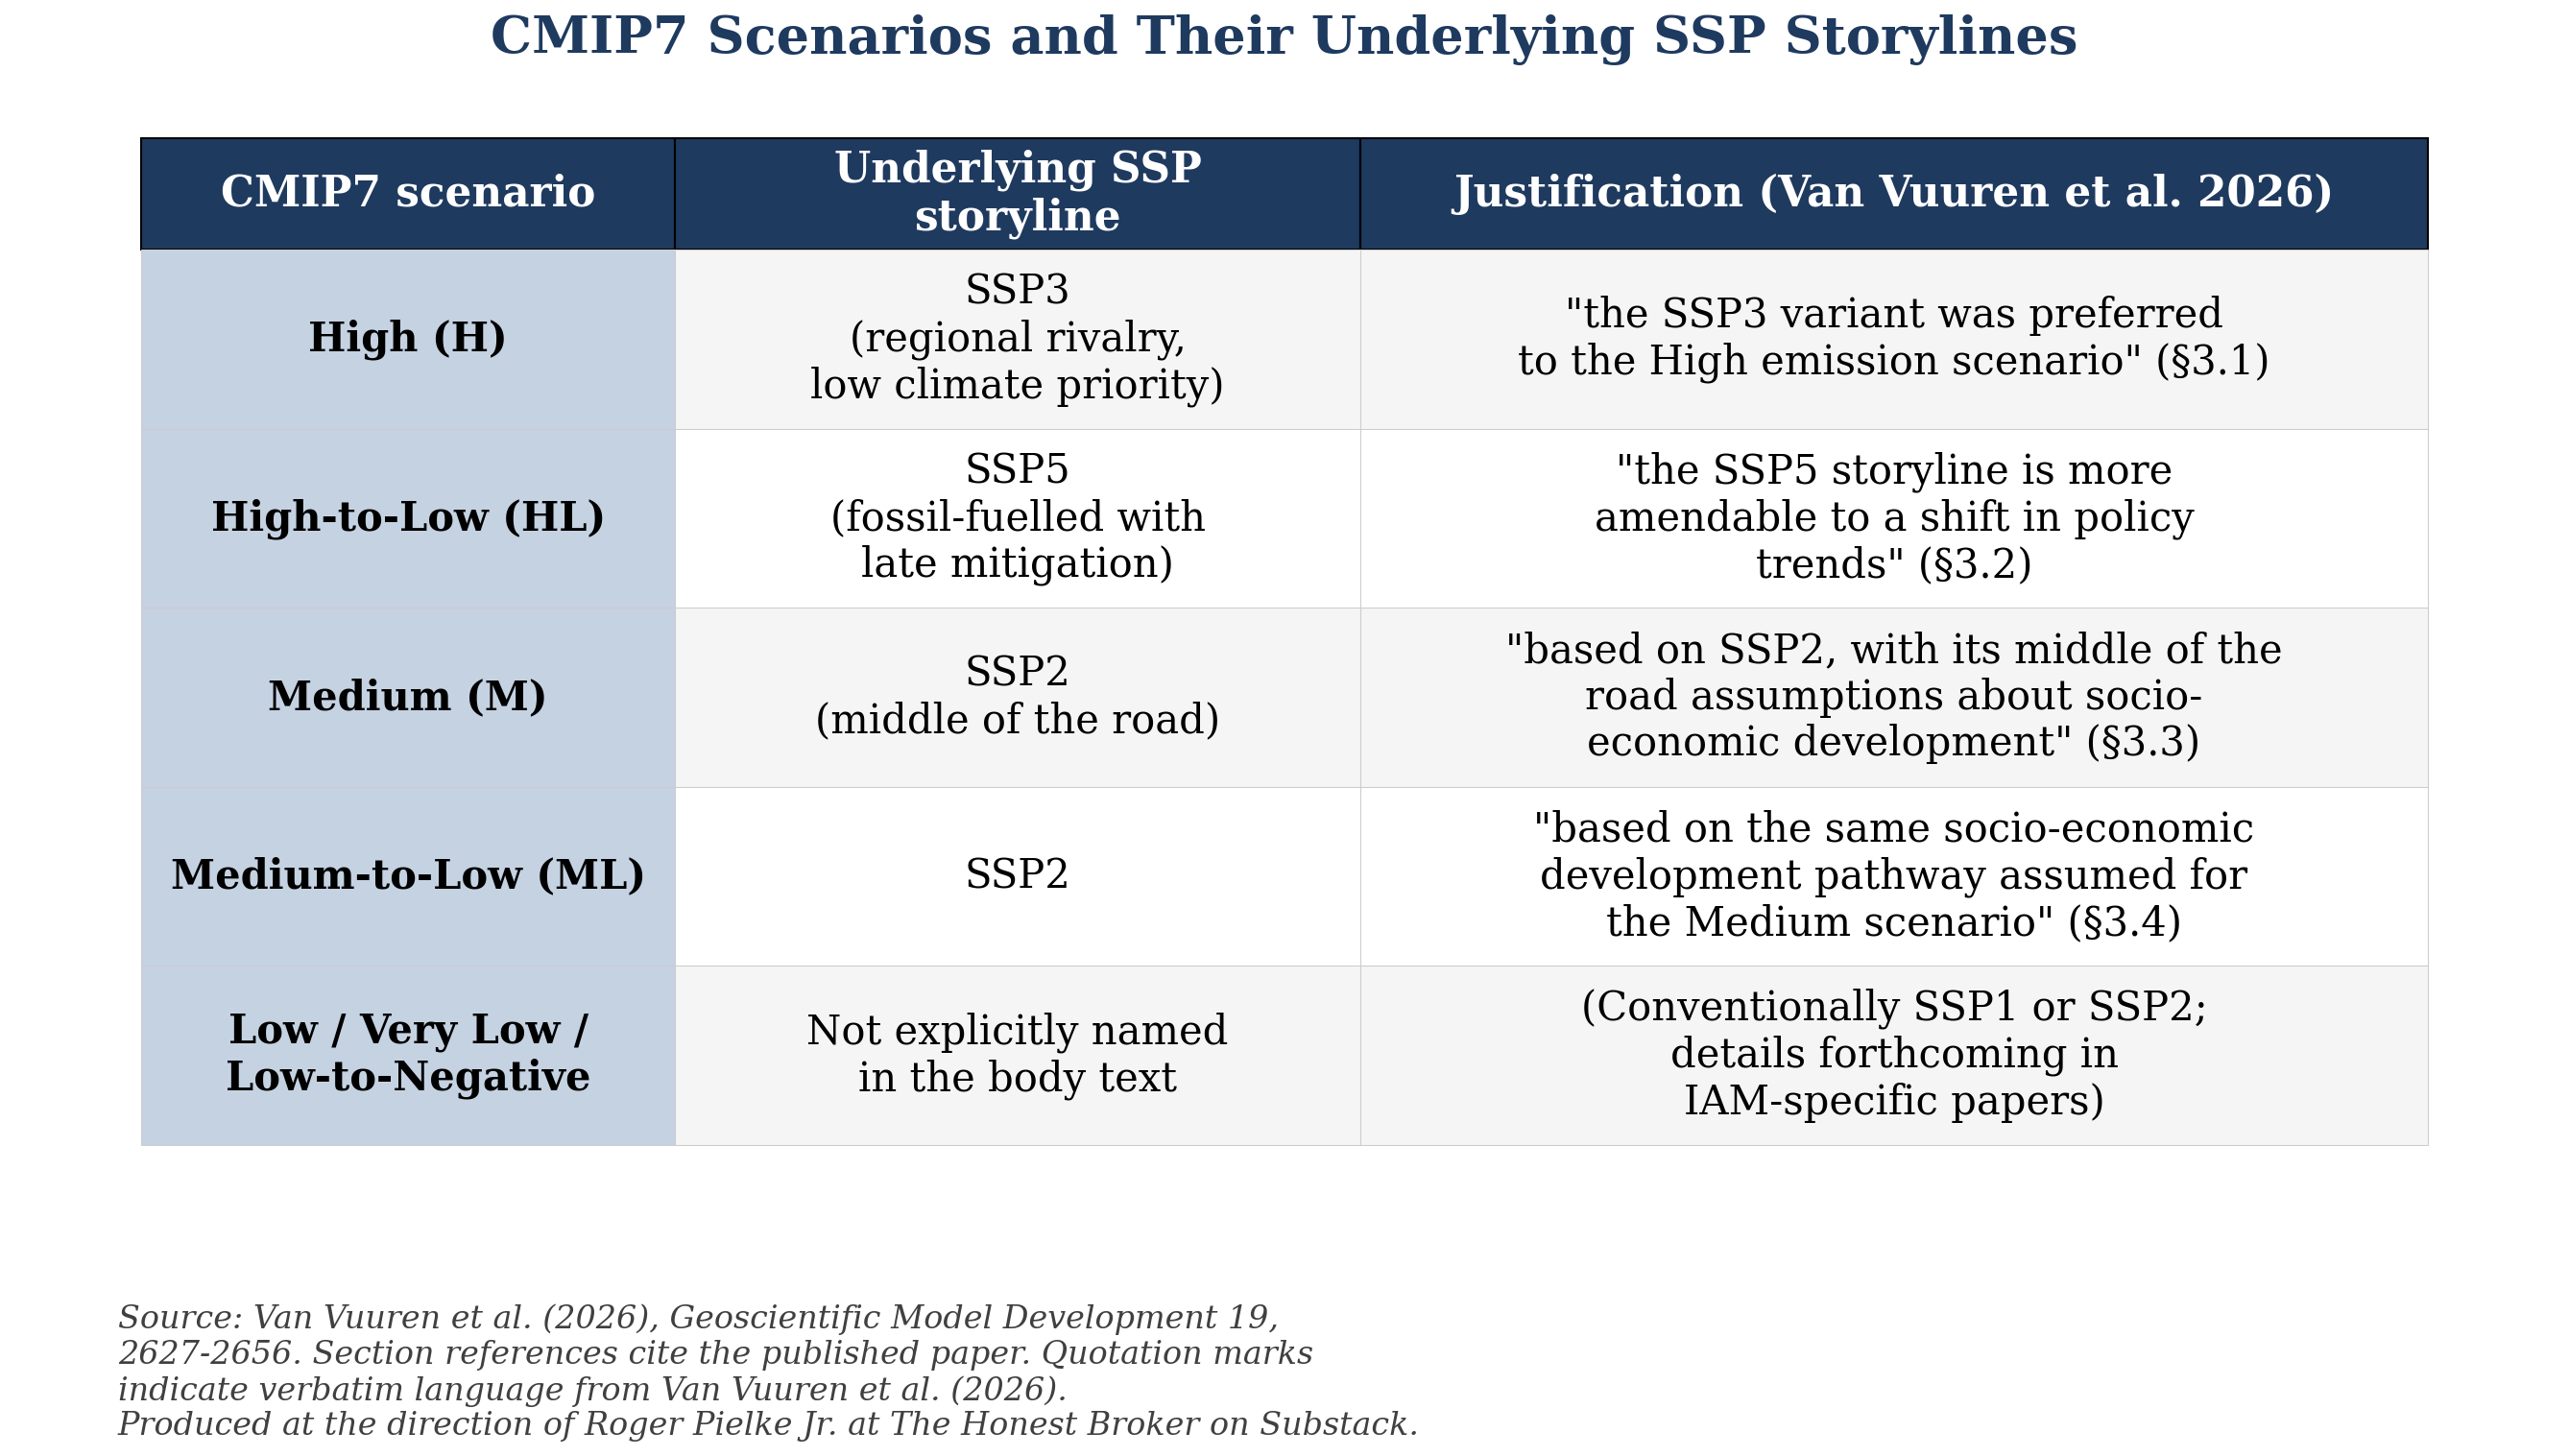
The new HIGH inherits the SSP3 storyline directly — the same SSP3 whose enormous 2100 population rendered it implausible when used in the IPCC AR6. Remarkably, the IIASA 2024 update to the SSPs did not bring the population projections down. Instead, it increased them, as you can see in the table below.
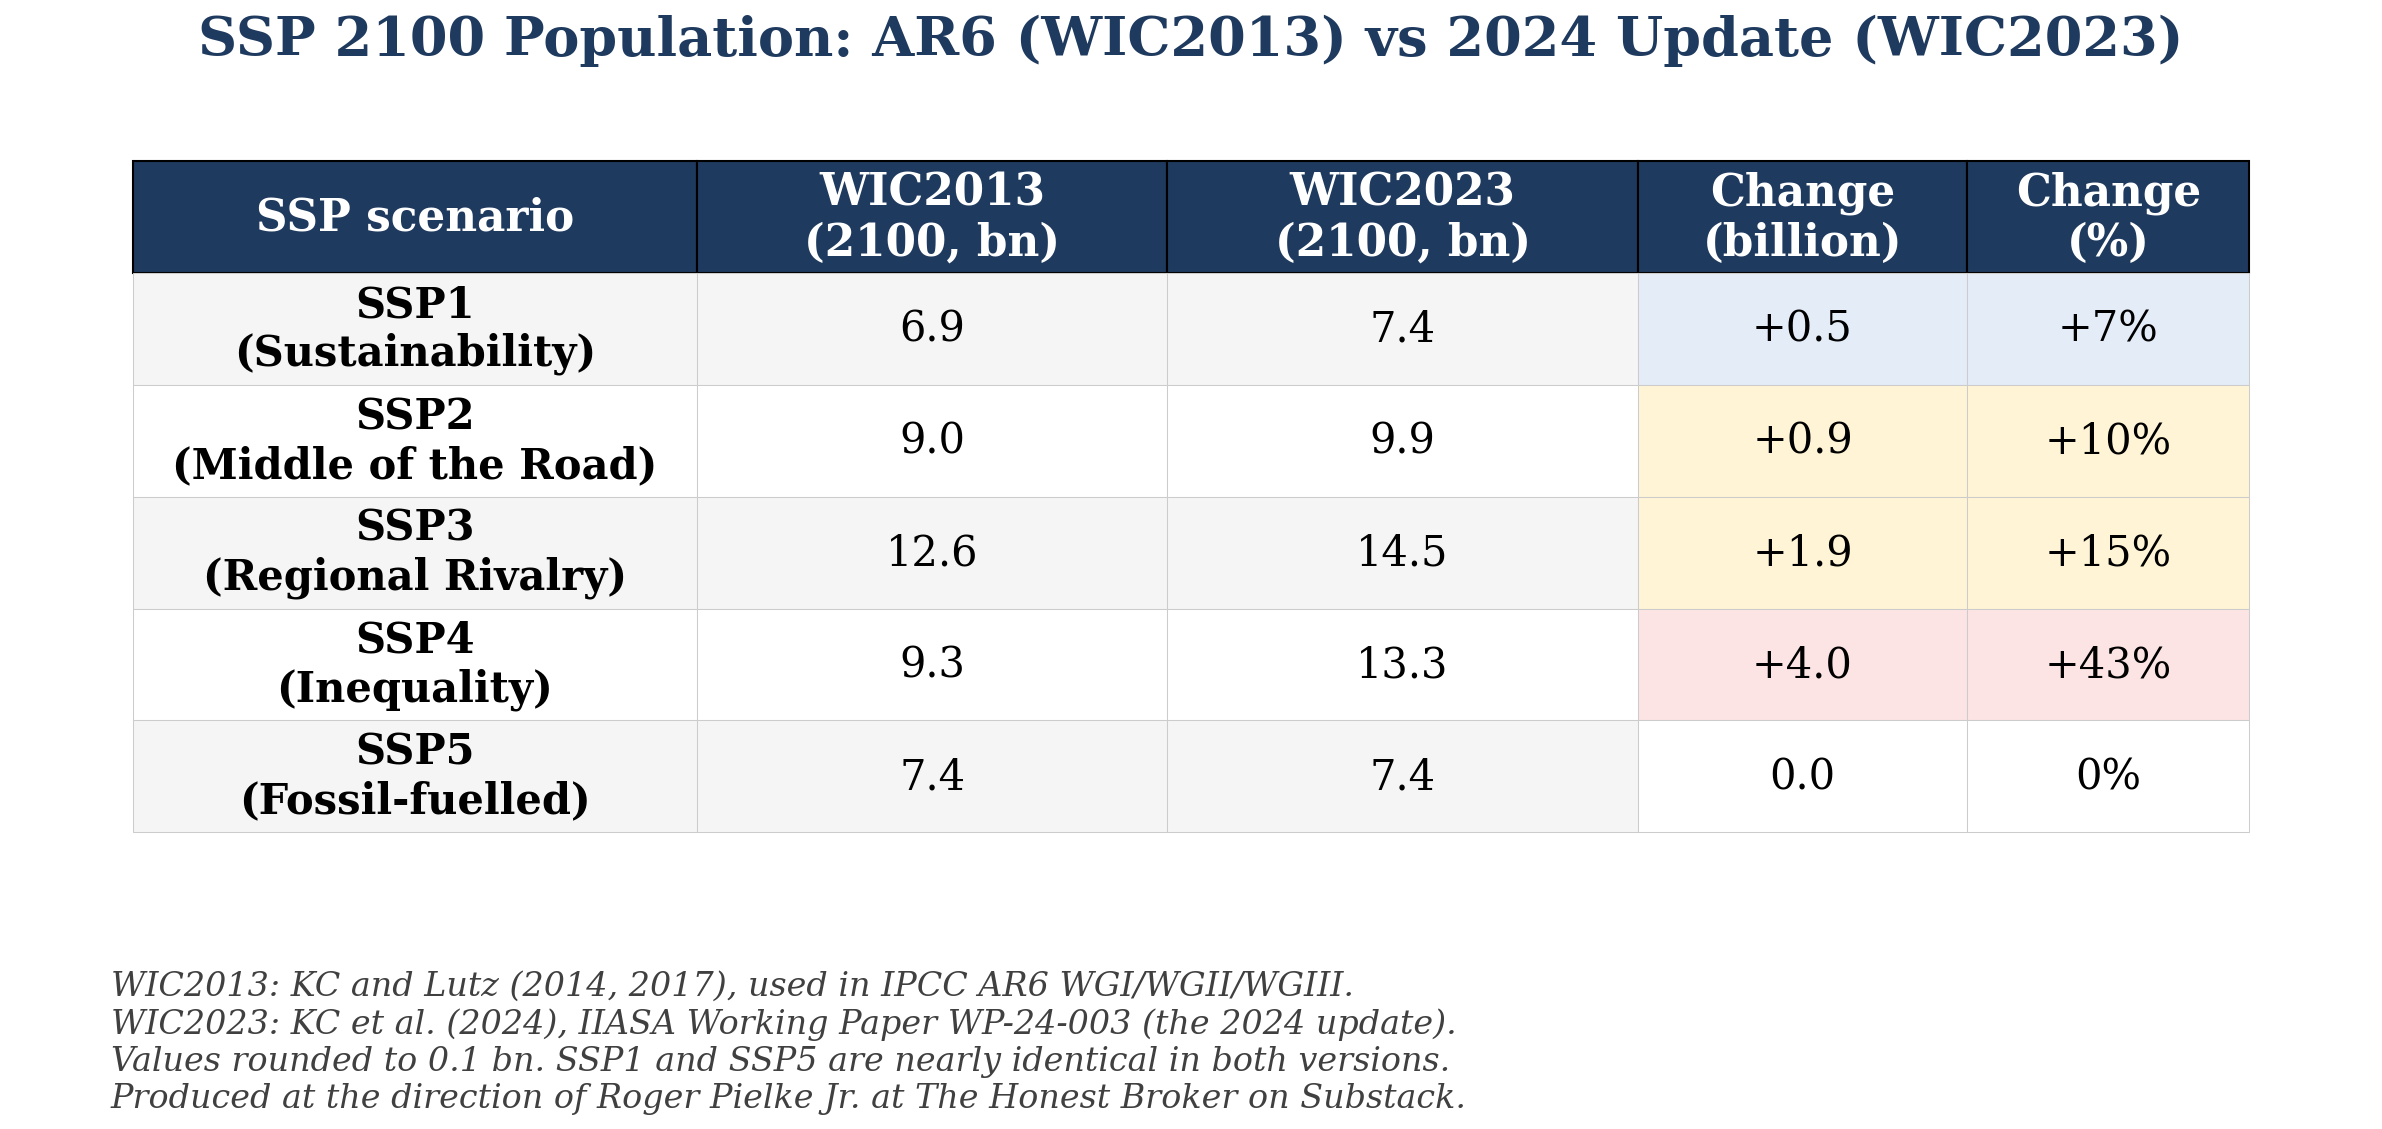
The 2024 demographic update (KC et al. 2024, IIASA Working Paper WP-24-003, also referred to as WIC2023) revises SSP 2100 populations upward: SSP3 jumps from 12.6 to 14.5 billion. SSP4 increases from 9.3 to 13.3 billion — an eye-popping 43% increase.
The SSP population update assumes that child mortality declines faster than WIC2013 anticipated, fertility declines slower in sub-Saharan Africa, and Africa’s 2020 base-year population was already 76 million higher than WIC2013 had projected. Africa’s 2100 population alone is now 3.55 billion, up from 2.62 billion in the AR6-era projection — a 35% upward revision.
This puts the CMIP7 HIGH scenario in a strange position: The cumulative fossil CO₂ from energy and industry in CMIP7 HIGH (4,629 Gt 2020-2100) is lower than SSP3-7.0 (5,074 Gt), but it has a 2100 population that is 15 percent larger. That means that the implied per-capita emissions trajectory in the new HIGH has a steeper decline.
How much of the new HIGH scenario’s warming is due to its incredible population projection?
I performed a simple sensitivity analysis:
Take HIGH as published: 4,629 Gt cumulative fossil CO₂ over 2020-2100, producing about 3.0°C of 2081-2100 warming.
That means per-capita emissions intensity average about 5.2 tonnes of CO₂ per person per year using 11-billion as the mean population across the century.
Hold that per-capita intensity constant and replace the SSP3 population trajectory with the SSP1/SSP5 population trajectory — peaking at 8.5 billion in 2050, declining to 7.4 billion by 2100, averaging about 8 billion.
Under these assumptions, under HIGH, cumulative fossil CO₂ falls to roughly 3,330 Gt, a 1,300 Gt reduction. The IPCC AR6 central TCRE estimate (0.45°C per 1,000 Gt CO₂) gives about 0.6°C less warming. The HIGH scenario with SSP1/SSP5 population thus would deliver about 2.4°C of 2081-2100 warming — slightly cooler than the new MEDIUM at 2.5°C.
Under this simple method, about 0.6°C of the HIGH scenario’s projected warming traces to the population assumption alone. The HIGH scenario may be much less about carbon and much more about assumed human fecundity.
This is a sensitivity analysis, not a coherent scenario — combining SSP3’s per-capita intensity with the SSP1/SSP5 demographic profile is internally inconsistent. But it suggests that the demographic contribution to the HIGH scenario’s warming is significant.
The deeper problem with the SSP/RCP architecture, as Justin Ritchie has documented at length, is that physical climate modeling became decoupled from the underlying IAM socio-economic scenarios.
Under the RCPs, scenario creators identified concentration pathways and the underlying socio-economic assumptions were expected to be filled in later. Whether the underlying assumptions actually described a coherent picture of the world was never systematically assessed.
Ritchie called this a plausibility vacuum — a situation where any combination of climate model inputs could be used without any assessment of the real-world plausibility of the assumptions.
To be fair, the new CMIP7 framework does address some earlier shortfalls. The new design specifies emission-driven runs as the default, which allows for carbon-cycle feedbacks. The harmonization of emissions to observed 2023 data is an improvement — CMIP6 harmonized to 2014, and that harmonization had become well out-of-date by the time AR6 came out.
However, the plausibility vacuum problem remains. Van Vuuren et al. do not evaluate scenario plausibility against observed energy trends, against IEA projections, or against the body of literature critiquing the SSP set.
The 2023 ScenarioMIP workshop report — which kicked off the process of developing these new scenarios — recognized the plausibility problem and committed to addressing it. Van Vuuren et al. does not deliver on that commitment.
ScenarioMIP produces a better scenario set than those of AR6, but the improvement comes from incorporating more recent emissions data and accepting the undeniable collapse of SSP5-8.5’s credibility — not from any methodological reform of how scenario plausibility is assessed.
The walk-back at the high end is the most important change in the new framework. The story in the middle is more complicated.
Van Vuuren et al. describe the MEDIUM scenario as one that “shows the consequences of the current policy situation (as of 2025) and trends continuing over the century.” They specify that MEDIUM includes only policies “actually officially being implemented” — no NDC pledges, no net-zero announcements, unless backed by explicit policy. The framing implies that MEDIUM tracks where the world is actually headed under current policies.
That framing is not consistent with other approaches to defining a current policy trajectory. The CMIP7 MEDIUM scenario produces fossil-fuel CO₂ emissions that rise from about 38 Gt CO₂/yr today to 41 Gt by 2050 — that part compares well to the scenarios (CPS and STEPS) of IEA’s World Energy Outlook 2025, released last November.
However, it is post-2050 where the new MEDIUM scenario diverges from other current-policy projections, with its emissions slowly rising through the second half of the century.
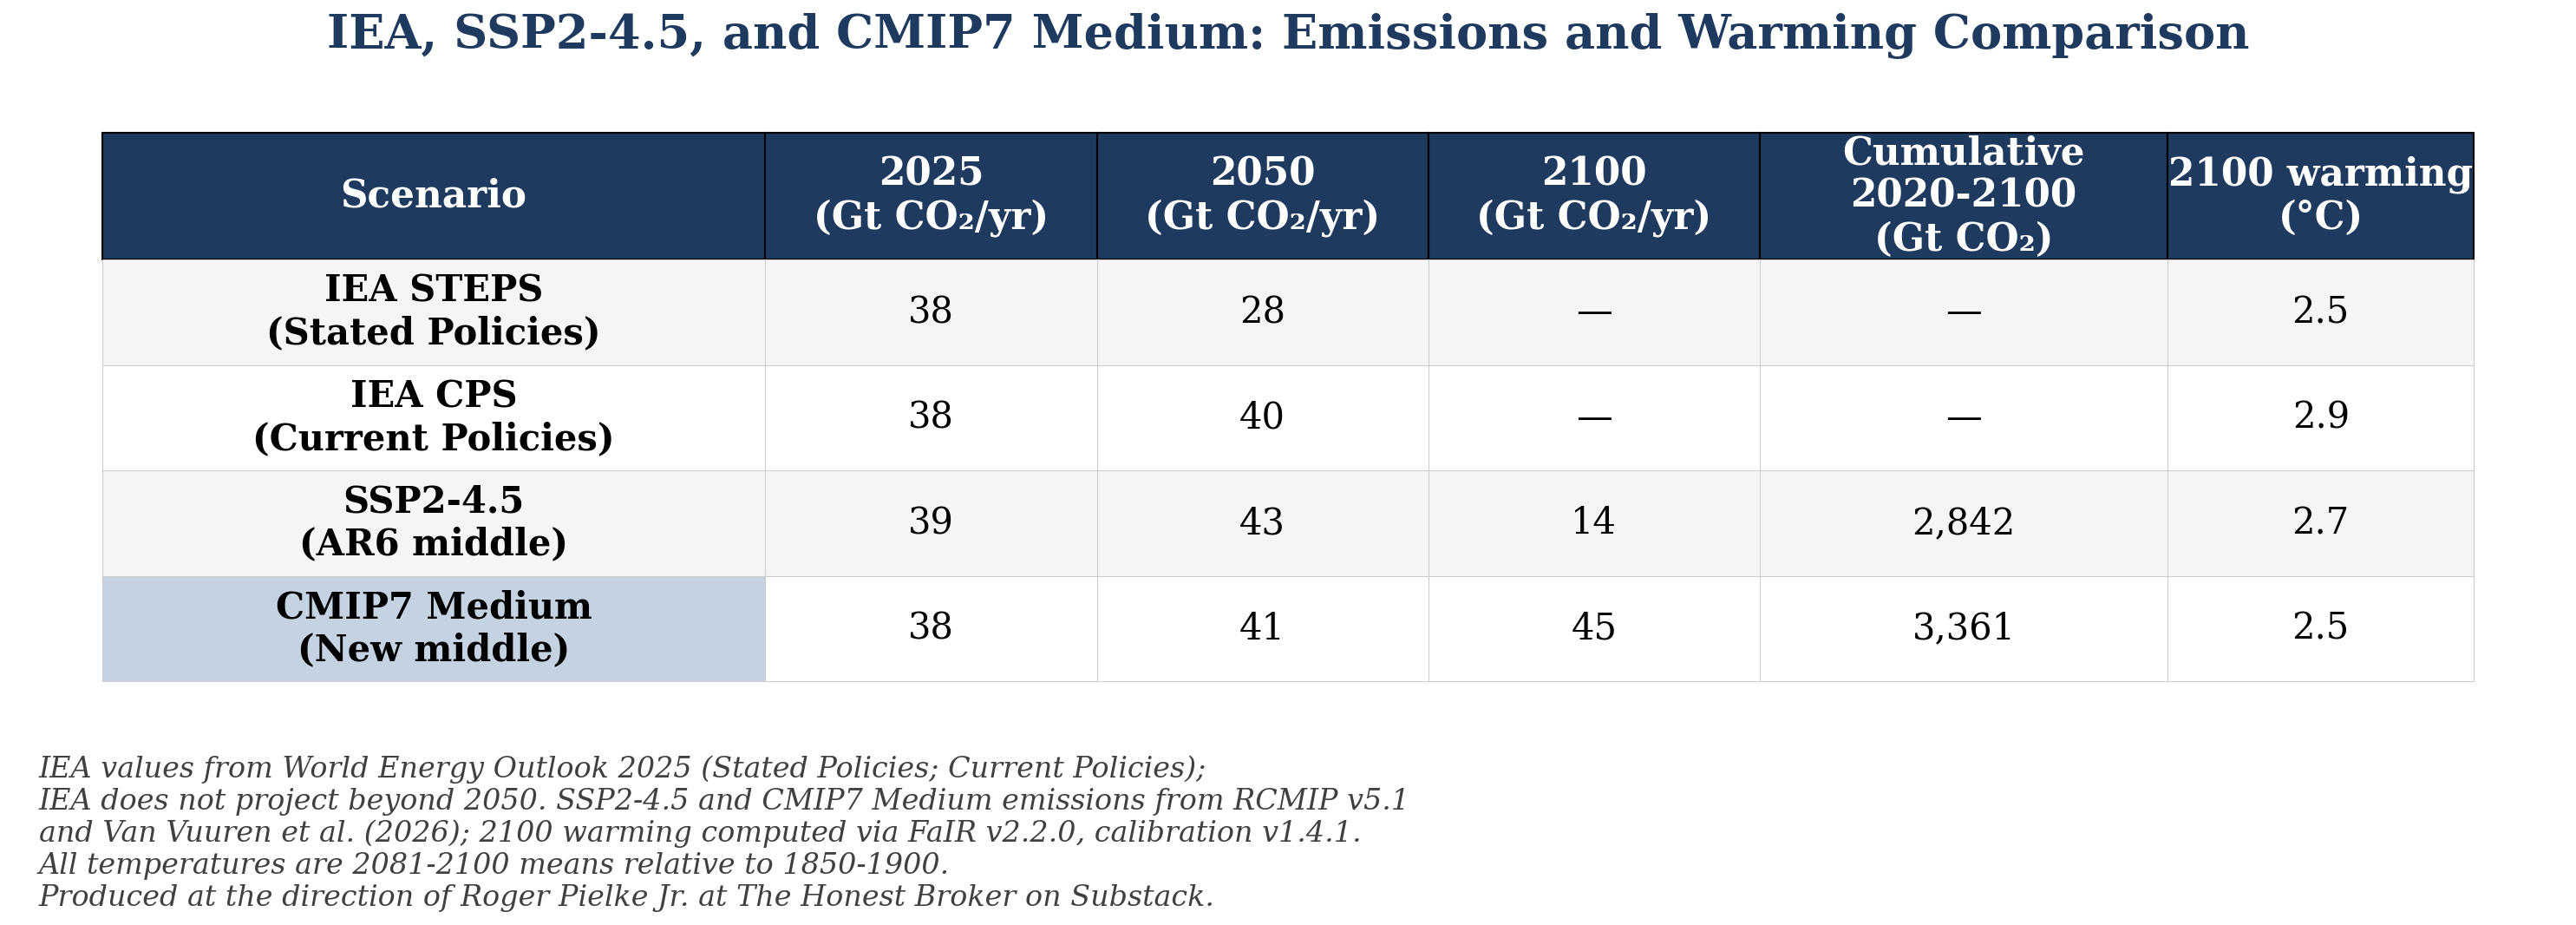
In contrast, STEPS — the IEA’s standard reference for where current and announced policies actually take us — falls below 30 Gt by 2050 and produces about 2.5°C of 2100 warming.
The CMIP7 MEDIUM is more accurately characterized as a “policy stagnation” scenario rather than a “current policy” scenario. Cumulative fossil CO₂ emissions through the end of the century come in 18% higher than SSP2-4.5 — the AR6-era middle-of-the-road scenario — even though the MEDIUM 2081–2100 mean temperature is slightly cooler (explained below).
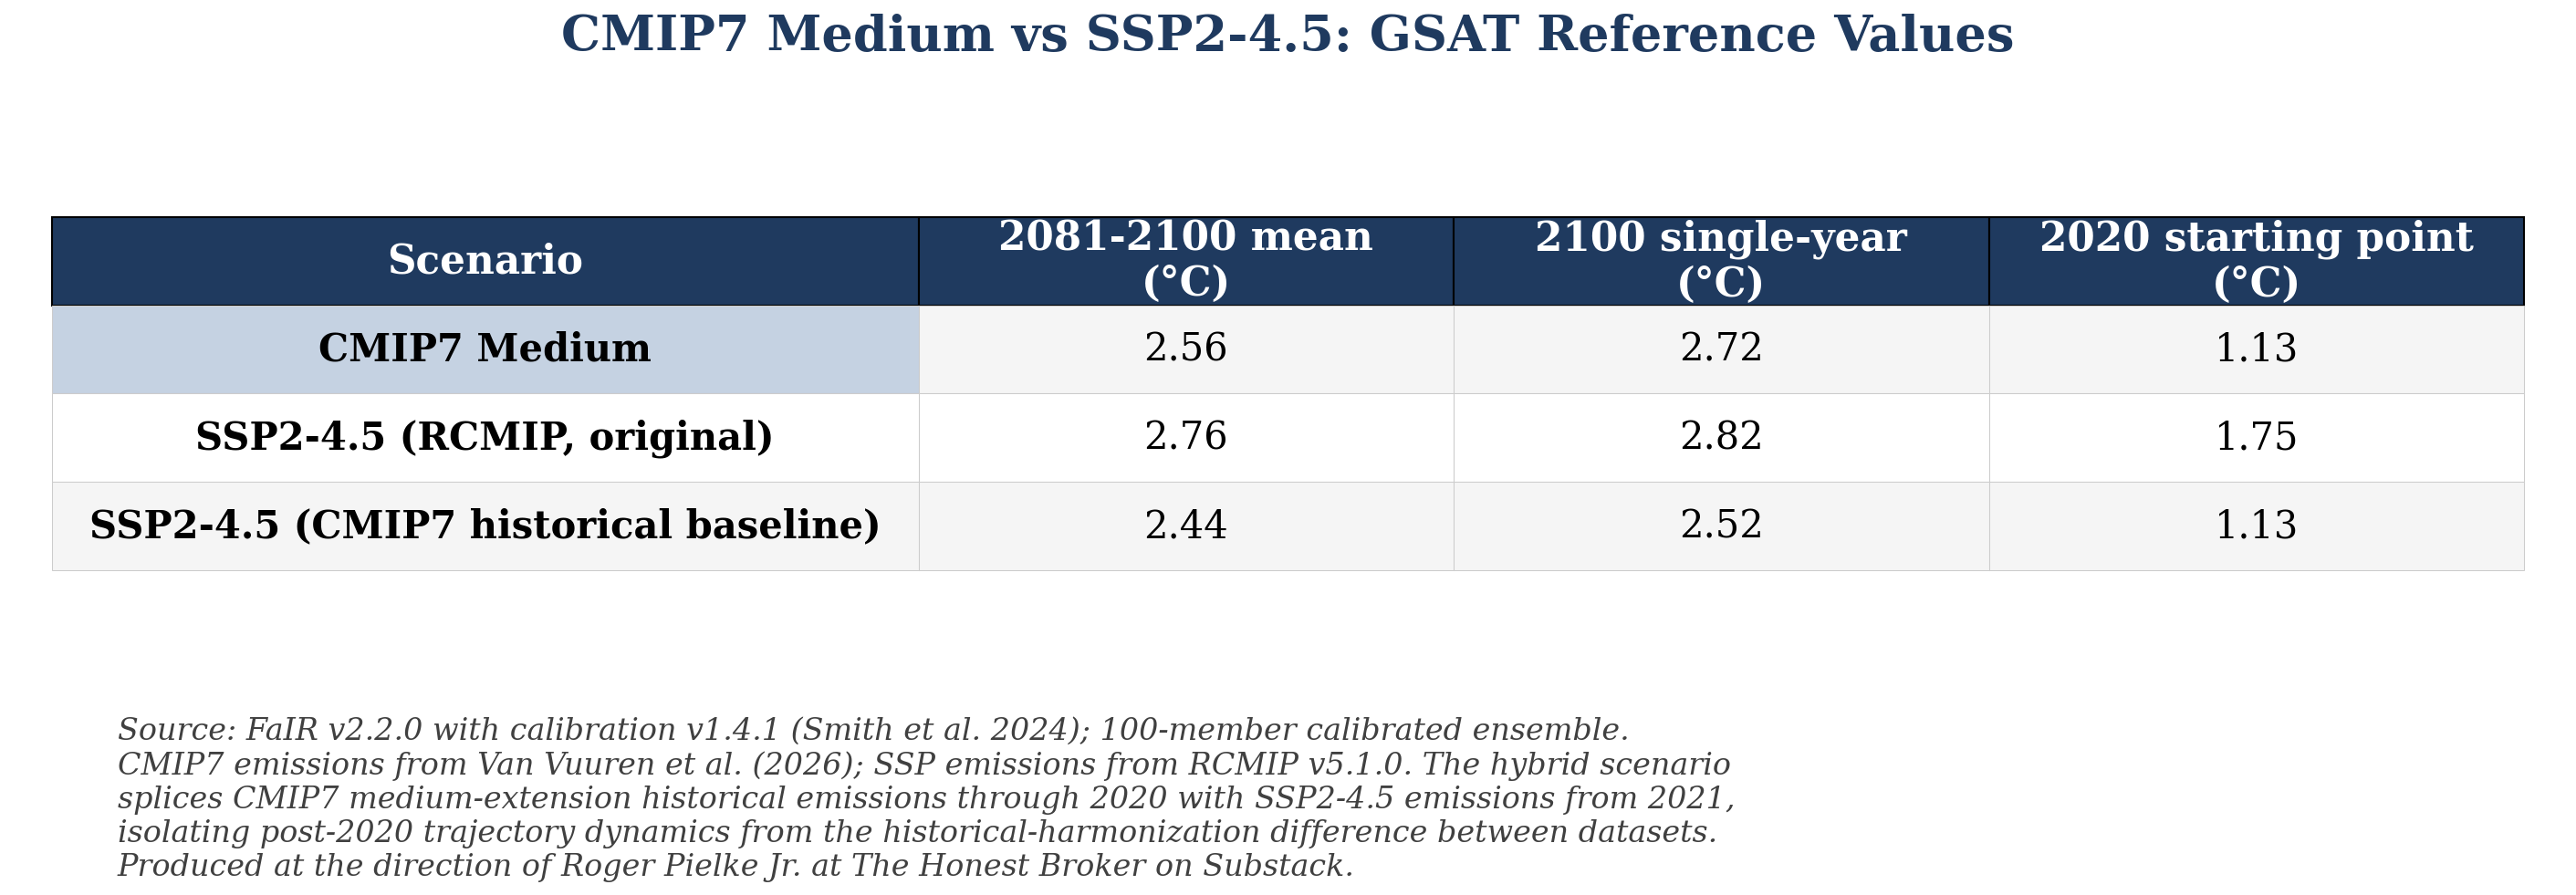
The figure below shows what happens once SSP2-4.5 and MEDIUM are anchored to the same observed 2020 baseline. The original SSP2-4.5 (black) sits roughly 0.6°C above CMIP7 MEDIUM (red) at 2020 — not because the 21st century plays out differently, but because the SSP framework's historical emissions are harmonized to 2014 while CMIP7's are harmonized to 2023. That head start propagates through the entire 21st century trajectory.
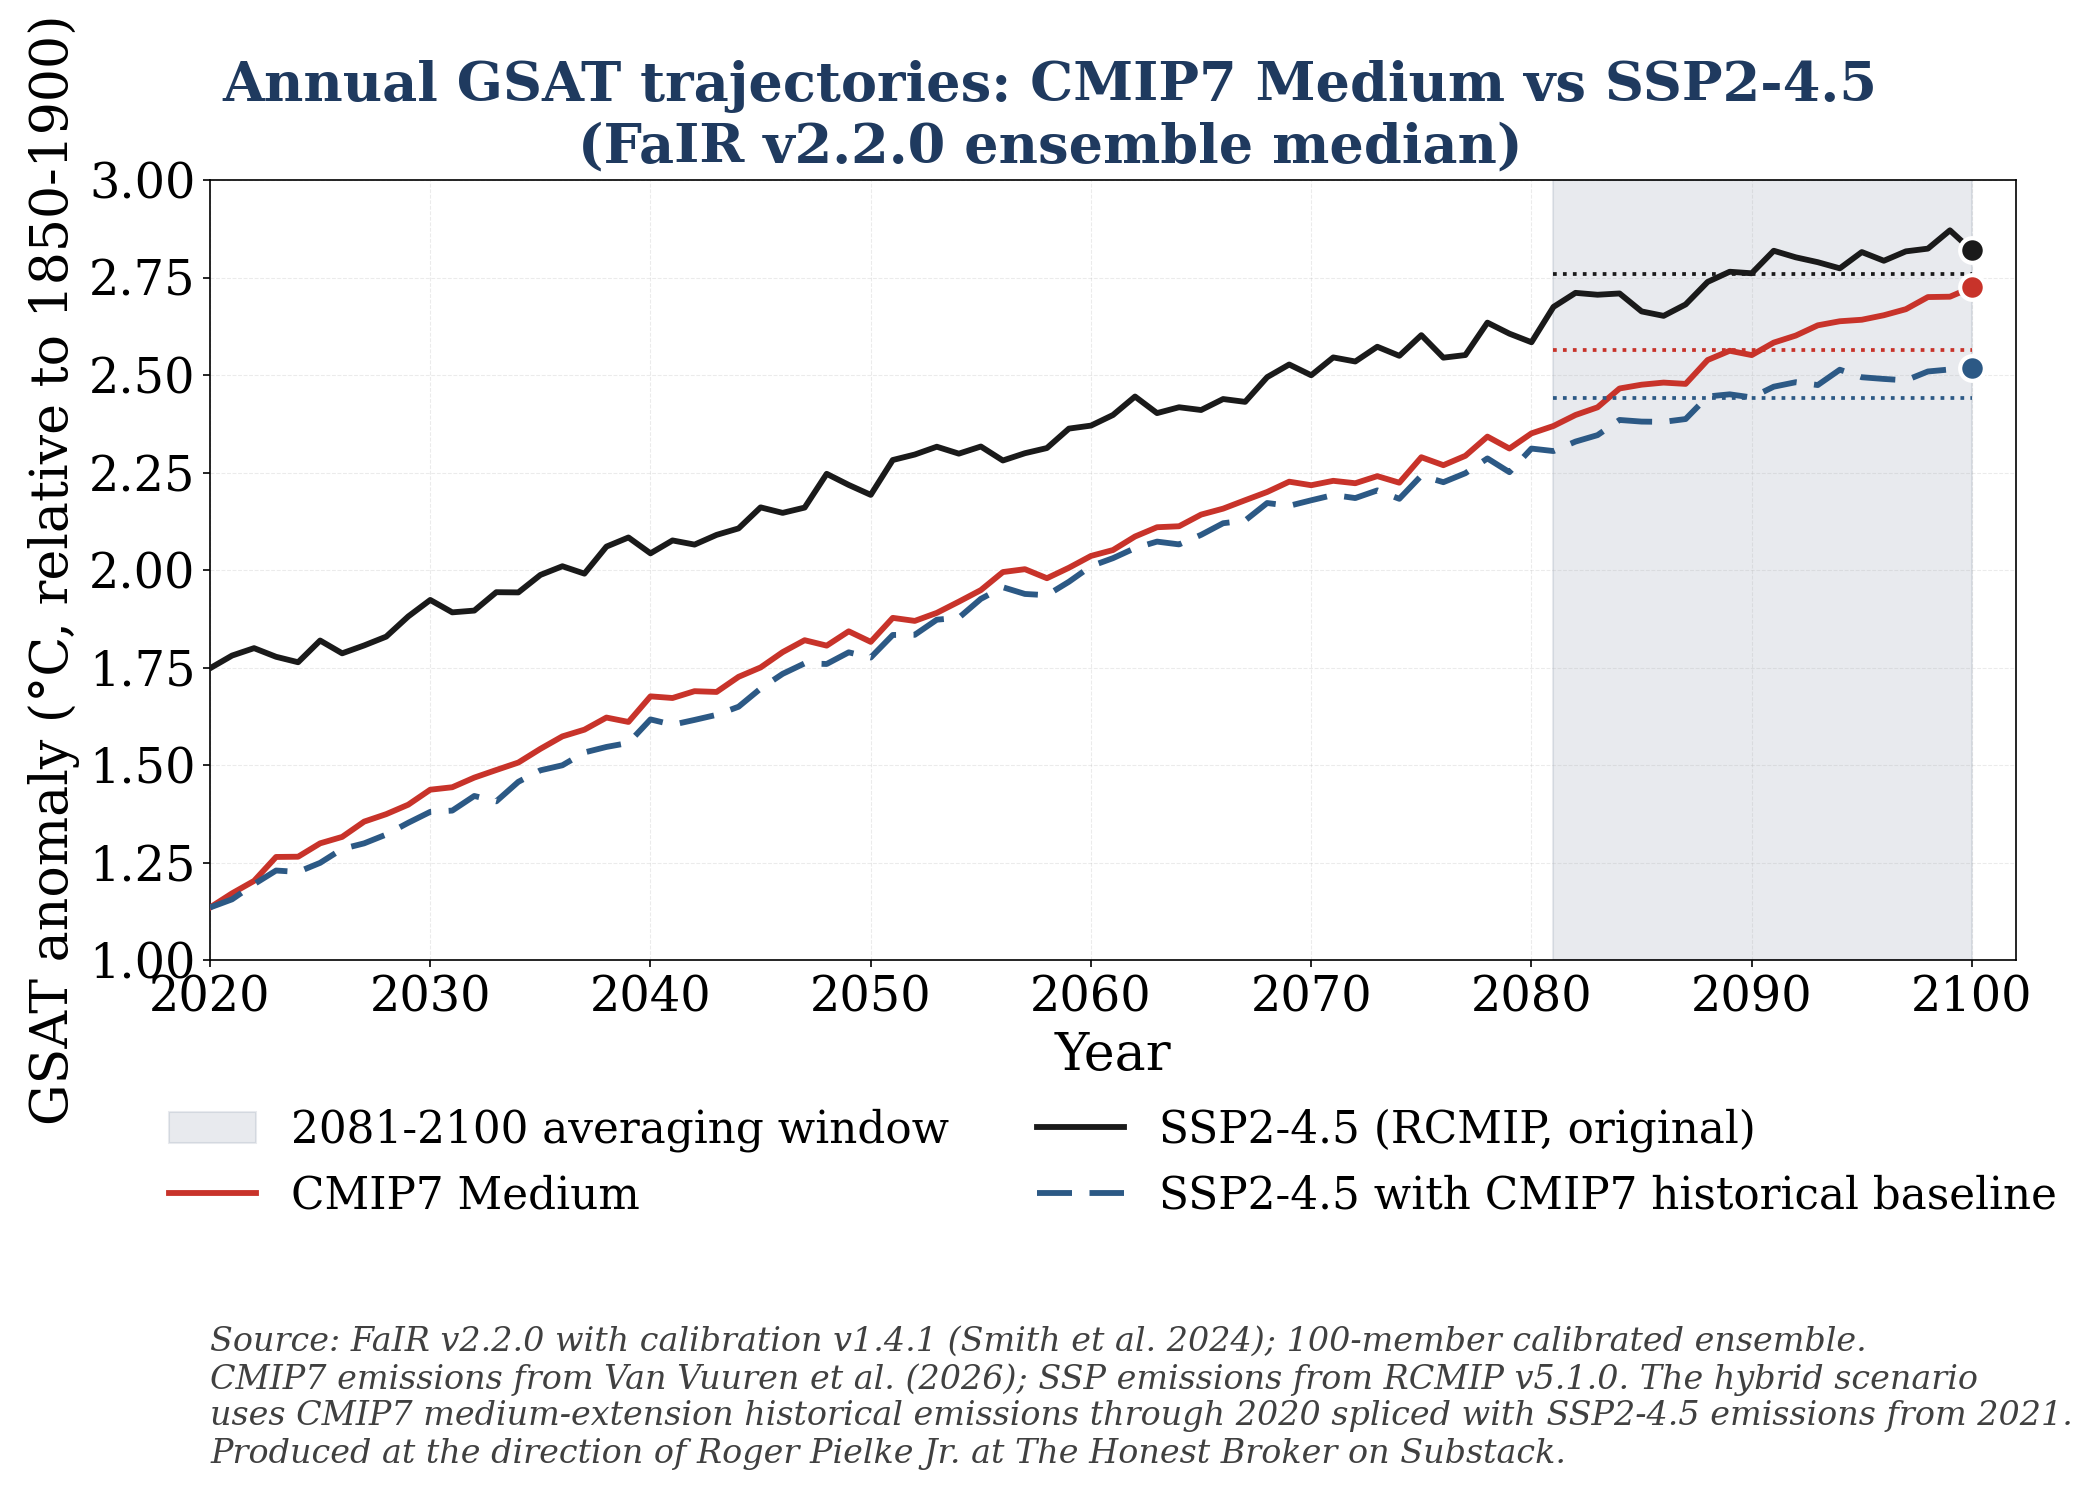
Running SSP2-4.5 post-2020 emissions through the CMIP7 FaIR emulator with CMIP7’s updated historical baseline (dashed blue), the picture inverts: SSP2-4.5 produces a 2081-2100 mean of 2.44°C against CMIP7 MEDIUM 2.56°C. On an apples-to-apples comparison, the new MEDIUM results in about 0.12-0.20°C more warming than SSP2-4.5 — due to its 520 Gt larger cumulative CO₂ budget over the century.
This connects to the larger argument in Pielke, Burgess, and Ritchie (2022): observed CO₂ emissions from 2005 through 2020 tracked closer to the SSP 3.4 W/m² range than to SSP2-4.5. Today, the gap has widened, not closed. IEA STEPS now has emissions falling to under 30 Gt by 2050 — a trajectory consistent with the SSP 3.4 forcing range. The center of the new CMIP7 scenario set sits well above that range.
The new framework compressed the high end. Good.
The middle did not move far enough. The new MEDIUM might be considered a worst-case scenario rather than a current policy scenario. Interestingly, that would mean that there is no real current-policy scenario in the new CMIP7 scenarios, which would be something like a SSP2-3.4 scenario with updated demographics.
Perhaps, if projected demographic changes continue to trend lower, CMIP7 LOW will come to represent something akin to a current policy trajectory.
The now-implausible upper-end scenarios — RCP8.5, SSP5-8.5, and SSP3-7.0 — are not just academic constructs used in esoteric research. They are embedded in the policies and regulations of most of the world’s largest economies, found across the world’s most important multilateral institutions, and used in the climate stress tests that govern hundreds of billions of dollars in bank capital.
The table below provides just a few examples.
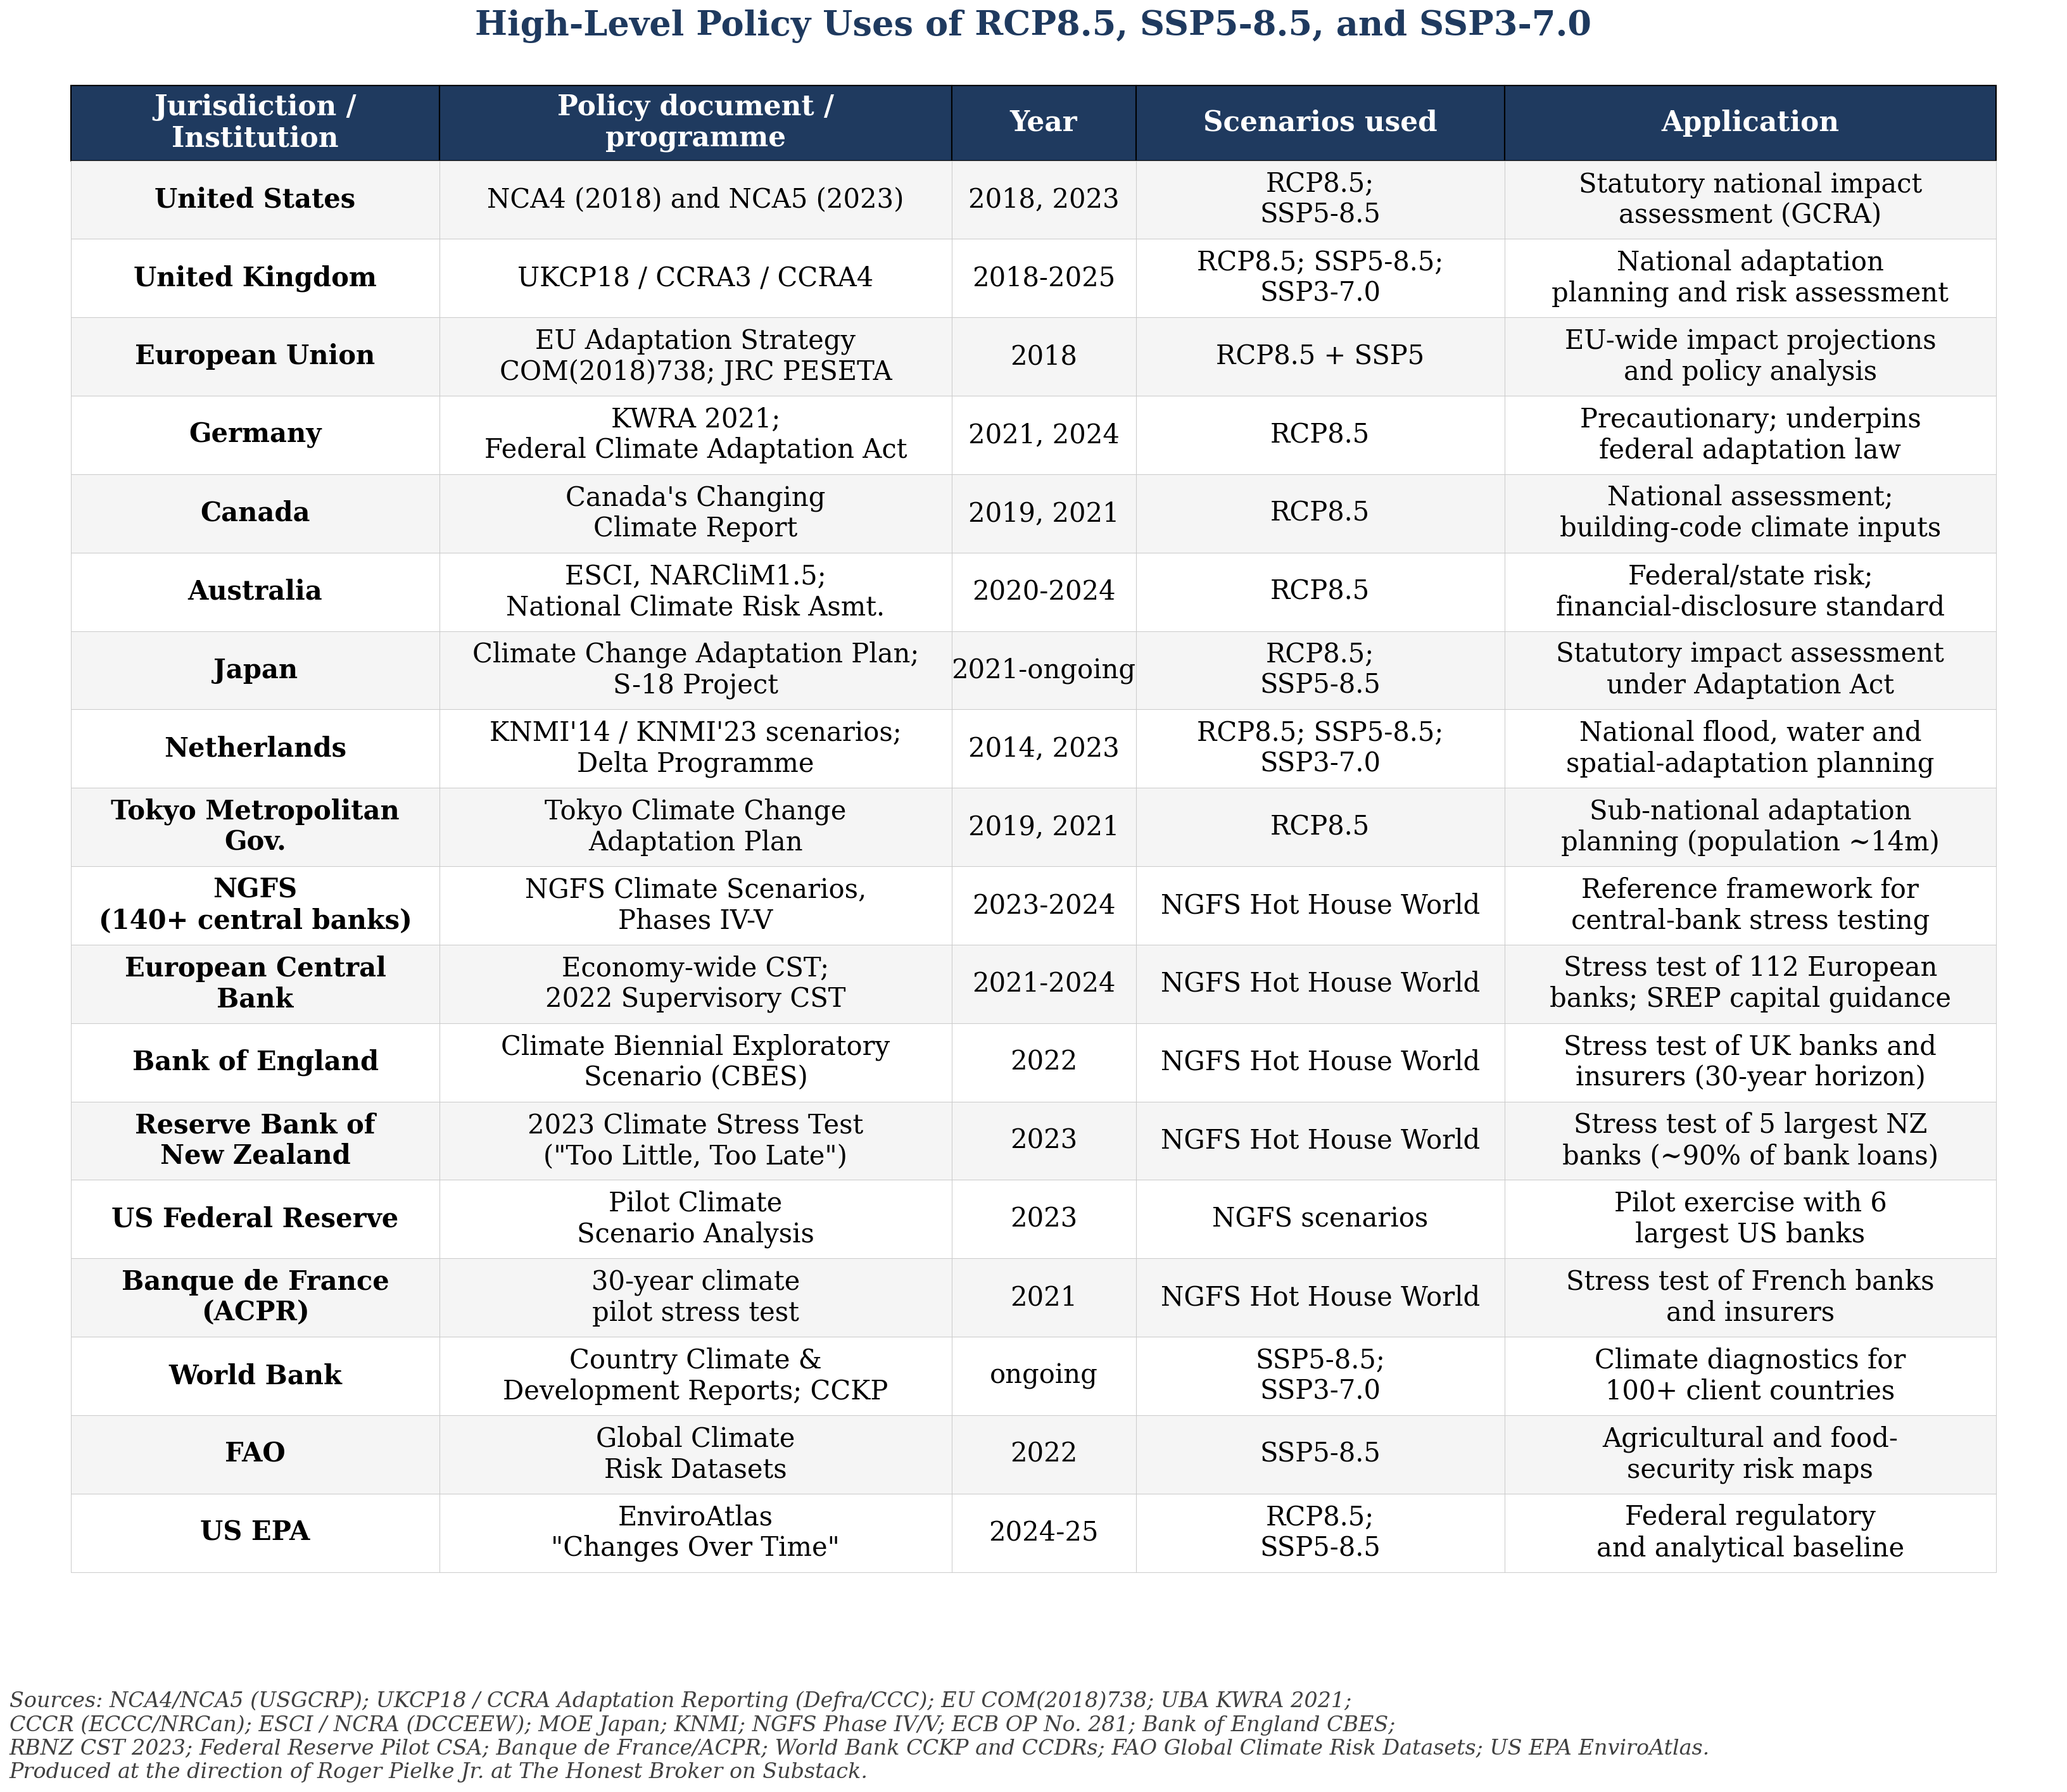
National climate impact assessments in the United States, United Kingdom, Germany, Canada, Australia, Japan, and the Netherlands all use RCP8.5 or SSP5-8.5 as a reference scenario. The Network for Greening the Financial System framework, used by more than 140 central banks, has utilized a “Hot House World” scenario calibrated to RCP8.5 physical risk into the bank stress tests run by the European Central Bank, the Bank of England, the Reserve Bank of New Zealand, the Banque de France, and the US Federal Reserve. The World Bank’s Climate Change Knowledge Portal, which provides the climate diagnostics that feed into the Country Climate and Development Reports for more than 100 client countries, defaults to SSP5-8.5 and SSP3-7.0.
The abandonment of the high-end legacy scenarios by CMIP7 will need to propagate through this entire infrastructure. The policy machinery built on RCP8.5 and the other implausible scenarios is systemic.
The new CMIP7 ScenarioMIP framework represents a real course correction, but with more work to do. SSP5-8.5 is gone. SSP3-7.0 has a successor that is less extreme but arguably remains implausible. The middle of the set is more pessimistic than trajectories of current and announced policies. The plausibility vacuum at the heart of the architecture has yet to be addressed.
All this means that users of climate models and model output based on legacy scenarios will now face decisions about if and how they’d like to realign with the latest scientific understandings versus continuing to rely on outdated research.
Furthermore, there are no doubt many — hundreds if not thousands — of studies in the publication pipeline that depend upon the upper end scenarios. Editors and reviewers should ensure that they are properly characterized as exploratory and are not intended to be interpreted as projective.
We’ve known since 2017 that upper end climate scenarios are fatally flawed. Nine years later, that understanding has now become officially recognized. That is good news.
We can debate whether nine years is short or long for the overturning of scientific understandings with massive economic and policy implications. But today, that overturning is undeniable.
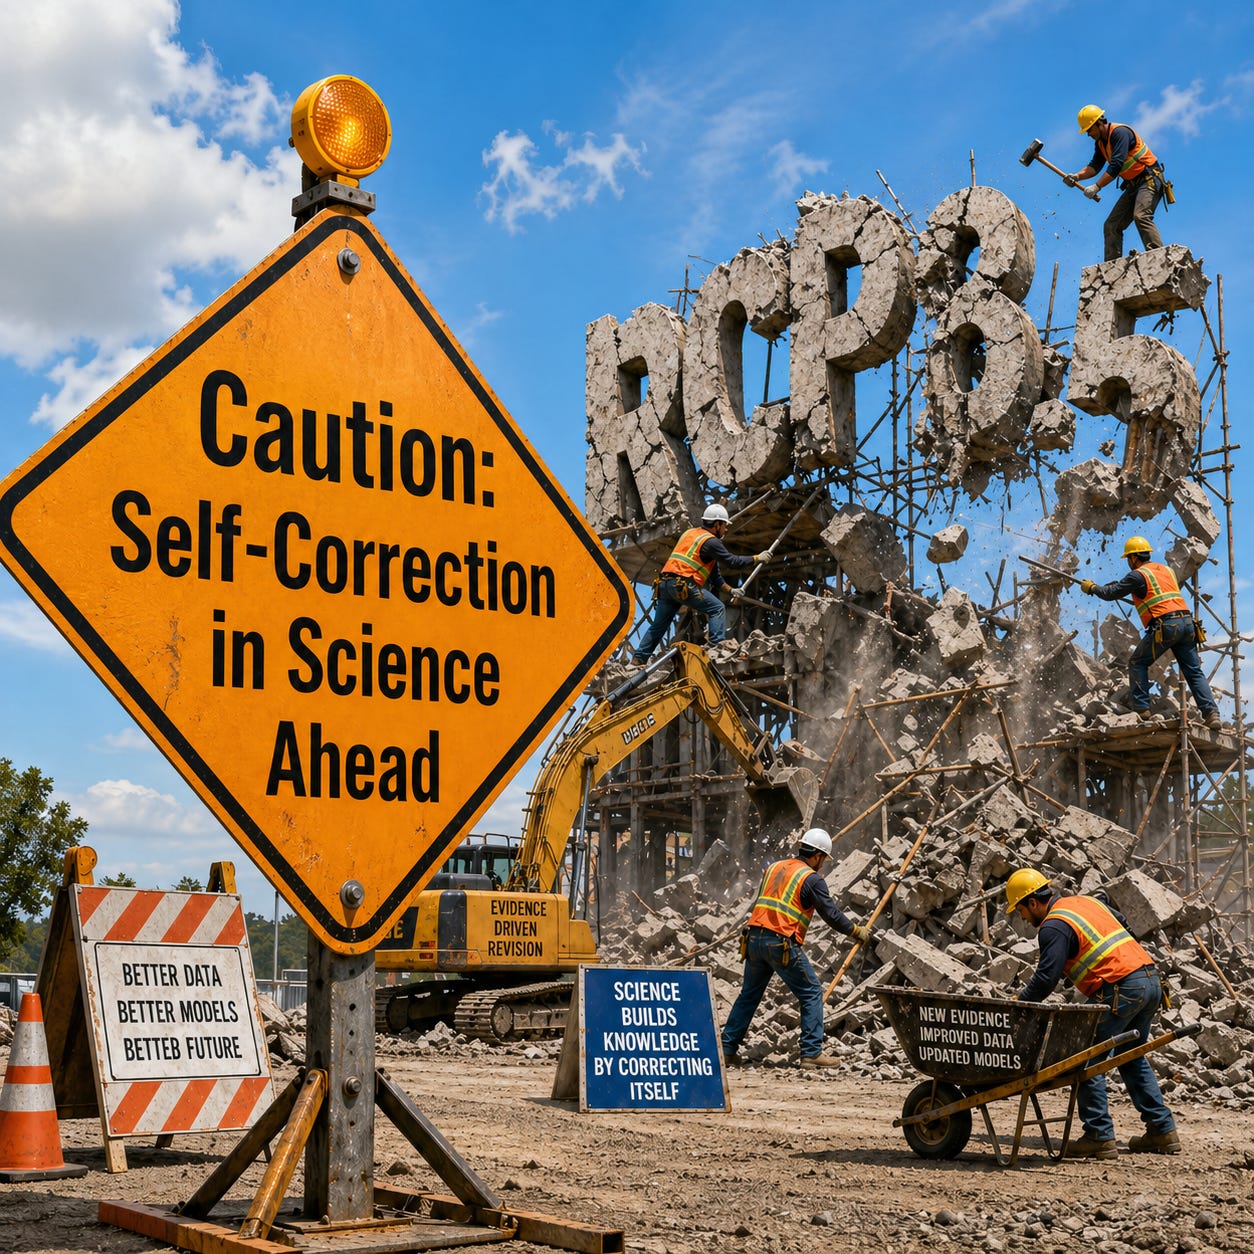
Science is self-correcting. What matters now is what happens next.
Comments, questions, suggestions, critique, debate, discussion — All welcome!
Before you go: Please click that “❤️ Like” button. More likes means more readers of THB. Thanks!
Note: The annual subscription for THB increases to $100 on June 1.
Don’t wait — Lock in your support at a lower level!
The quantitative analyses in this post and production of figures and tables were performed under my direction by Anthropic’s Claude Optus 4.7. A discussion of methods can be found in the PDF below. After the jump, paid subscribers can access an Excel spreadsheet with all of the data in the figures and tables in this post and a Python script that will reproduce all computations in this post. This is work in progress. Comments welcome!