By Richard Baldwin, Professor of International Economics, IMD Business School, Lausanne. 11 September 2026. Factful Friday.
Introduction.
Washington and Brussels denounce Beijing’s industrial subsidies while running large subsidy programmes of their own. But what are the subsidies really doing?
Did China’s subsidies actually boost its exports in strategic sectors? What were the spillovers on other nations’ exports? What effect did the US anti-subsidy tariffs have?
That’s the topic of today’s Factful Friday and it’s based on an important new IMF working paper (Rotunno, Ruta and Verma, 2026). The paper estimates the cash subsidies paid by the ten biggest subsidisers over 2015-23, runs them through a trade model with economies of scale, and then adds the actual tariffs.
Two things to know before looking at the charts. The subsidy numbers count direct grants and state aid only; tax credits and cheap loans are excluded, so the CHIPS and IRA credits are outside the count and every subsidy figure below understates total support. And “strategic” is the paper’s label for the eight sectors that contain at least one product on the US Census Bureau’s advanced-technology list. That is a broad net (it catches fabricated metals and chemicals as well as electronics). The annex has the details.
Who subsidises what.
Chart 1 shows direct subsidies to goods sectors as a share of value added. China’s rate rose from about 1% in 2015 to 2.7% in 2023. The US went from 1.1% to 1.7%, the EU from 0.4% to 1.0%. Averaged over the period, China subsidised at 1.8% of value added, the US at 1.3% and the EU at 0.6%. In dollars, and these are my rough translations using approximate goods-sector value added, that is something like $100 billion a year for China, $35 billion for the US and $15 billion for the EU.
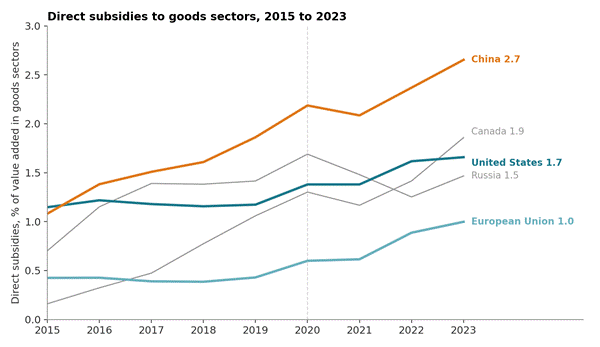
Chart 1: Direct subsidies to goods sectors as a share of value added, 2015 to 2023, five largest subsidisers. Source: Rotunno, Ruta and Verma (2026), Figure 3(b), authors’ data.
The less obvious half of the story is aim. Chart 2 splits each country’s subsidy rate between the paper’s strategic sectors and everything else. China put 3.3% of value added into strategic sectors and 1.2% into the rest. The US did the opposite: 0.6% into strategic sectors and 2.1% into the rest, mostly agriculture and mineral products. The EU is the same shape at a lower level, 0.3% versus 0.9%. So the US out-subsidises Europe two to one and spends most of it on farms and cement. (Mineral products here means the non-metallic kind, cement, glass and ceramics, not critical minerals.)
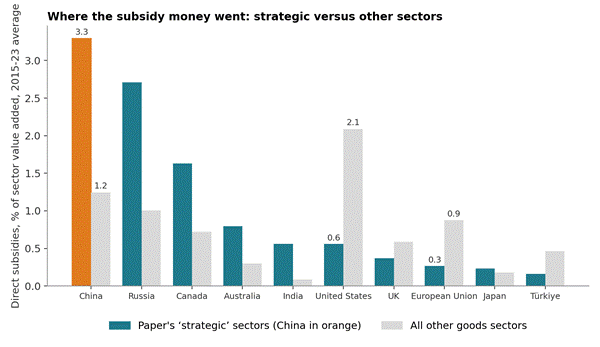
Chart 2: Direct subsidies as a share of sector value added, 2015-23 average, strategic versus other goods sectors, ten largest subsidisers. Source: Rotunno, Ruta and Verma (2026), Figure 4(a), authors’ data.
Why aim matters: scale effects.
The composition of subsidy spending really matters. Some sectors see gains from scale economies when the subsidies expand them; sectors like machinery and electronics. Others are just flat so the subsidies boost output but not productivity; sectors like agriculture and mining.[i]
The model captures this with a scale elasticity: the percentage rise in a sector’s productivity for a 1% rise in its size. Chart 3 ranks the paper’s 19 goods sectors by that elasticity, using the estimates the model runs on, and marks where each of the three big players put its three largest subsidy increases between 2015 and 2023.
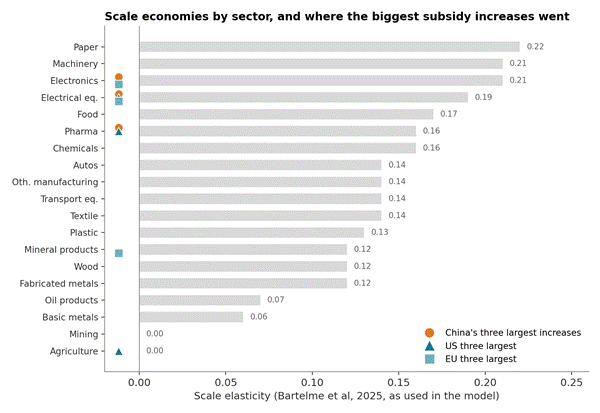
Chart 3: Sectoral scale elasticities used in the model (Bartelme et al, 2025) and the three sectors in which each economy’s subsidy rate rose most, 2015-23. Source: Rotunno, Ruta and Verma (2026), Table A.1 and Figure A.7(b); the top-three sectors are read off the figure.
China’s three, electrical equipment, electronics and pharmaceuticals, all sit in the top band, with elasticities of 0.16 to 0.21. Two of the EU’s three are there too, but the third is mineral products at 0.12. The US’s three include pharmaceuticals and electrical equipment, but its single largest increase went to agriculture, where the elasticity is zero. A subsidy dollar in agriculture lowers the price and that is the end of it. A subsidy dollar in electronics lowers the price, pulls in workers, and makes the sector more productive as it grows.
What the subsidies did.
Chart 4 shows the model’s long-run answer when all ten subsidisers and the rest of the world implement their estimated 2015-23 subsidy changes at once. As the chart shows, China won in terms of exports. The subsidies lowered US, EU and rest-of-world exports in these sectors.
China’s exports in strategic sectors rise by 10% and its imports in those sectors fall by 7%. Everyone else loses: US strategic exports fall by 1.3%, EU exports by 0.9%, and the rest-of-world aggregate, which includes Korea, by 3.5%. (When China alone subsidises, its exports rise by 12%; the all-country outcome tracks the China-only one closely, which tells you whose subsidies are doing the work.)
Beggar-thy-neighbour is what this is called.
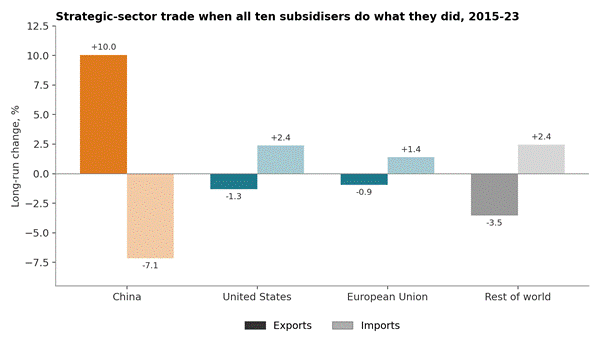
Chart 4: Long-run change in strategic-sector exports and imports when all ten subsidisers and the rest of the world implement their 2015-23 subsidy changes, per cent. Source: Rotunno, Ruta and Verma (2026), Figure 5(d), authors’ data.
Two consequences. China’s share of world strategic exports rises from 27% to 29% and its trade surplus in those sectors rises by about 30%, to $0.7 trillion. The gains are concentrated in electronics, where China’s exports rise by about 20% and its share of world exports goes from 39% to 45%. US electronics exports fall by 7% and, in the model, US electronics employment by 6%; because scale matters, the shrinking sectors also get less productive. The subsidies also cost China something: resources move into the targeted sectors and out of the rest, so China’s exports of textiles, farm products and food fall and its imports of them rise. That is what specialisation looks like in a general-equilibrium model.
What the tariffs did.
There have been two rounds. In 2018-19 the US raised its average tariff on imports from China from 3% to 16% (import-weighted, at 2015 weights) and China retaliated. From February 2025 the US raised tariffs on China again and, from April, on everyone; by March 2026 the average US tariff on China stood at 31% and China’s on the US at 27%. The paper layers each round on top of the subsidies and asks what changed. Chart 5 shows the answer for strategic sectors.
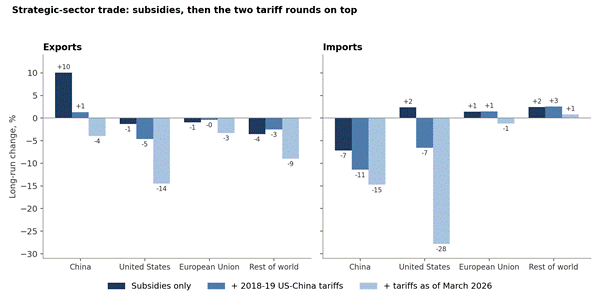
Chart 5: Long-run change in strategic-sector exports and imports under subsidies only, subsidies plus the 2018-19 US-China tariffs, and subsidies plus US and Chinese tariffs as of March 2026, per cent. Source: Rotunno, Ruta and Verma (2026), Figure 10, authors’ data.
Take the 2018-19 round first. It bit hard on bilateral trade: China’s strategic exports to the US swing from a 12% gain under subsidies alone to a 30% loss, and US strategic exports to China fall by about 30%. It clipped China’s aggregate gain, from 10% to about 1%. But it did not raise American exports. In the authors’ words, US tariffs on China “fail to raise US exports in both strategic and other sectors, while imports go down”. US strategic exports fall by about 5% with the tariffs, against about 1% without them, and the world market share China gave up went to the EU and the rest of the world. The US share did not recover.
The 2025 round is bigger and, for the US, worse. China’s strategic exports end up 4% below where they started, so the subsidy gain is gone. But US strategic exports fall by 14% and US strategic imports by 28%, with little of that demand switching to other suppliers. American strategic-sector output does not go abroad; it goes home, with domestic sales up about 13%. The rest of the world’s strategic exports fall by 9% and the EU’s by 3%. China’s exports to non-US markets still grow, just a little less than before. The tariff wall works as a wall. It does not work as a weapon.
Summary and concluding remarks.
The title says it all. China’s subsidies worked in terms of exports. They raised China’s strategic exports by about a tenth, cut its imports, pushed its share of world electronics exports from 39% to 45%. These were part of China’s national development plan, so politically, this counts as a win.
Economically, not so much. At least not on static welfare measures. Subsidies raise real wages in most countries, and most of all in China, because the money went to sectors with strong scale economies. But real wages are not welfare. Once the fiscal cost of the subsidies and the terms-of-trade effects are counted, real income falls globally and in most countries, China included. Adding the tariffs makes the bill larger: with the March 2026 tariffs on top of the subsidies, world real income is 0.3% below baseline and China’s is 0.7% below. The one exception is the US, whose real income edges up by 0.2% under the 2025 tariffs because tariff revenue outweighs the wage loss. The authors are explicit that this hinges on nobody but China having retaliated. The annex chart has the country detail.
Another thing you should take away from today’s column: the US is spending its subsidy cash on old economy sectors, on sectors where scale economies do not boost the impact. The top three export increases for China came in electronics, pharma and machinery. For the US, it was agriculture & fishing, textiles and food. That is not something China did to America; it was the American political system allocating citizens’ taxes politically, not economically.
From an economic, standard welfare perspective, both policies lowered world real income. A subsidy war with a tariff war on top is a negative-sum game, and the model says so in numbers. There is a standard solution to negative-sum, non-cooperative outcomes. It’s called an agreement. I am working on a proposal along those lines, a sort of arms-control pact for industrial subsidies, aimed at stopping the subsidy-tariff-export-control spiral from blowing up. More on that another Friday.
And that’s it for another Factful Friday!
References.
Bartelme, D, A Costinot, D Donaldson and A Rodríguez-Clare (2025), “The textbook case for industrial policy: Theory meets data”, Journal of Political Economy 133(5): 1527–1573.
Bown, C P (2021), “The US–China trade war and Phase One agreement”, Journal of Policy Modeling 43(4): 805–843.
Ju, J, H Ma, Z Wang and X Zhu (2024), “Trade wars and industrial policy competitions: Understanding the US-China economic conflicts”, Journal of Monetary Economics 141: 42–58.
Rotunno, L, M Ruta and P Verma (2026), “Industrial Policy and Trade Tensions in Strategic Sectors”, IMF Working Paper WP/2026/154.
Annex: the study, the scenarios and the charts.
The subsidy estimates. The authors estimate the relationship between the dollar value of subsidies and the count of subsidy measures using the New Industrial Policy Observatory data for 2023-24, then apply it to Global Trade Alert policy counts to back-cast subsidy values for 2009-23. Only direct transfers (grants, state aid, capital injections) are counted; tax breaks and preferential loans are excluded. The sample is the ten largest subsidisers over 2015-23 (China, the US, the EU, Russia, Canada, the UK, Türkiye, Australia, Japan and India) plus a rest-of-world aggregate. Subsidy rates are expressed as a share of sectoral value added from the OECD inter-country input-output tables.
Strategic sectors. The paper defines them as the eight OECD input-output sectors that contain at least one product on the US Census Bureau’s Advanced Technology Products list: electronics, pharmaceuticals, chemicals, machinery, electrical equipment, transport equipment, fabricated metals and other manufacturing. The share of advanced-technology products within these sectors ranges from 42% (electronics) to 3% (chemicals, other manufacturing), so the label is broad.
The model. A multi-country, multi-sector general-equilibrium trade model with external economies of scale, in the Caliendo-Parro lineage as extended by Ju et al (2024). Eleven economies, twenty sectors (nineteen goods sectors plus services), calibrated to 2015 OECD inter-country input-output data. Scale elasticities are from Bartelme et al (2025) and range from 0.06 to 0.22 in manufacturing; they are set to zero in agriculture, mining and services. Results are long-run reallocations with aggregate trade balances held fixed, and subsidies are financed by lump-sum taxes. None of this is observed data; it is a simulation of what the estimated subsidy changes would do once fully worked through.
Scenarios used in this column. All body charts use the scenario in which all ten subsidisers and the rest of the world implement their 2015-23 subsidy changes, because the tariff runs are built on that base. Under the China-only scenario China’s strategic-sector exports rise by 12% rather than 10%; the paper reports that the two scenarios track closely for most countries. The no-scale comparison (10% versus 5%) is from the paper’s text and Figure A.9(a).
Tariffs. The 2018-19 US-China tariff changes are from Bown (2021), aggregated to sector level at 2015 import weights. The March 2026 tariffs are from the WTO-IMF Tariff Tracker and cover US and Chinese tariff changes since February 2025, including the April 2025 US tariffs on all trading partners. In both tariff scenarios China’s tariffs change only on imports from the US; tariffs on other countries are held at 2015 levels.
Data provenance. Charts 1, 2, 4, 5 and the annex chart are built from the authors’ data files for the corresponding figures. Chart 3 combines Table A.1 (scale elasticities, column 6) with the three top-increase sectors per country read off Figure A.7(b). The bilateral figures (China’s exports to the US, US exports to China, US domestic sales), the electronics world shares, the employment effects and the world real-income figure are taken from the paper’s text.
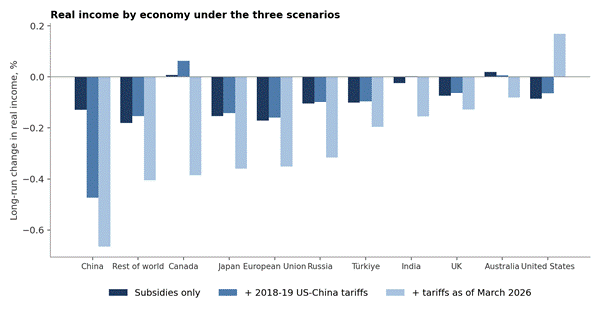
Annex chart: Long-run change in real income by economy under subsidies only, subsidies plus the 2018-19 US-China tariffs, and subsidies plus tariffs as of March 2026, per cent. Source: Rotunno, Ruta and Verma (2026), Figure 11(b), authors’ data.
[i] The model puts a number on how much this matters. When the authors switch off economies of scale and rerun the all-country scenario, China’s strategic-sector export gain falls from about 10% to about 5%. Half the effect comes from the productivity that scale delivers once labour piles into the targeted sector; the subsidy starts the reallocation and scale finishes the job. It is also why the study finds, uncomfortably for the critics, that China’s subsidies are the ones best aligned with the market failure the model is built around. Beijing is not going to abandon a policy that works this well.