DuckDB 2.0 is out. If your team runs 1.4 or 1.5, should you upgrade now or wait for 2.0.1? How unusual was the issue and contributor activity after launch? We investigated using GitHub data we collected with vgi-github, the GitHub connector for VGI.
By comparing issue and contributor activity across 46 DuckDB-owned, user-facing repositories around 2.0, 1.4 and 1.5, we found that more people filed issues each day around 2.0, including more first-time reporters. Relative to each release’s baseline, we found a smaller rise in core-engine issue intake than at 1.5. Client and installer repositories received more issue reports than their baselines predicted during the first week. Those repositories are places to examine specific reports when planning an upgrade.
We counted issue reports across all versions and issue types. We have not classified which reports identify regressions introduced by 2.0, so we cannot turn these counts into a defect rate.
3 November update · Preliminary report. We now have 13 complete days of observations, including release day, through 2 November 2026 UTC. The initial issue surge has eased while contributors remain active. The matched first-week comparisons below cover 21 October 2026–27 October 2026; the trend charts extend through the latest observed day.
We benchmarked the issue spike against recent releases.
We counted 266 new issues in 2.0’s first week, 21 October 2026–27 October 2026, including release day. DuckDB’s issue activity was already growing, and increasingly common AI agents make it easier to write and submit reports. We compared recent releases against their own baselines to account for changing activity, although we cannot identify how many of these reports involved AI.
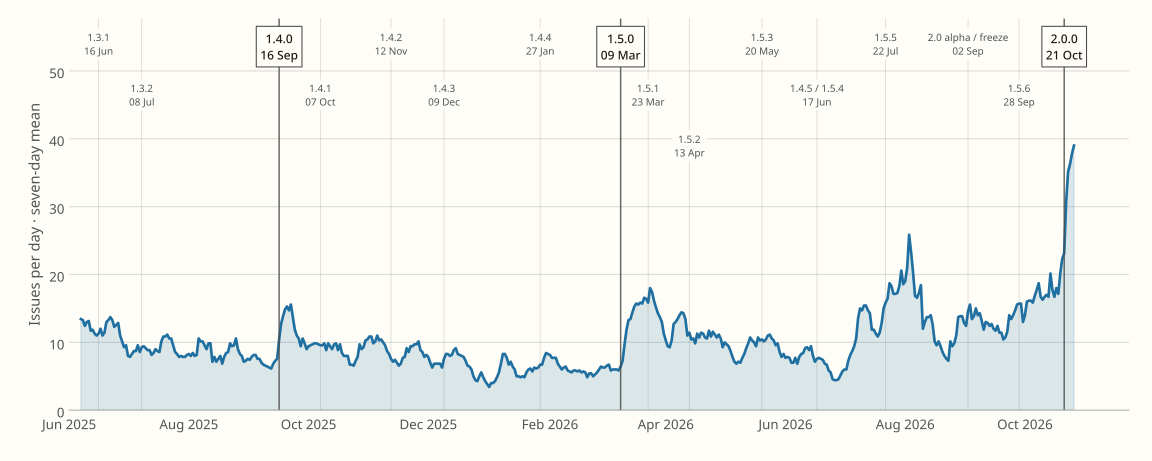
We smooth daily counts with a trailing seven-day mean. Dark gray lines and boxed labels mark 1.4.0, 1.5.0 and 2.0.0; smaller labels identify patch releases and the 2.0 alpha announcement. Daily counts ↓
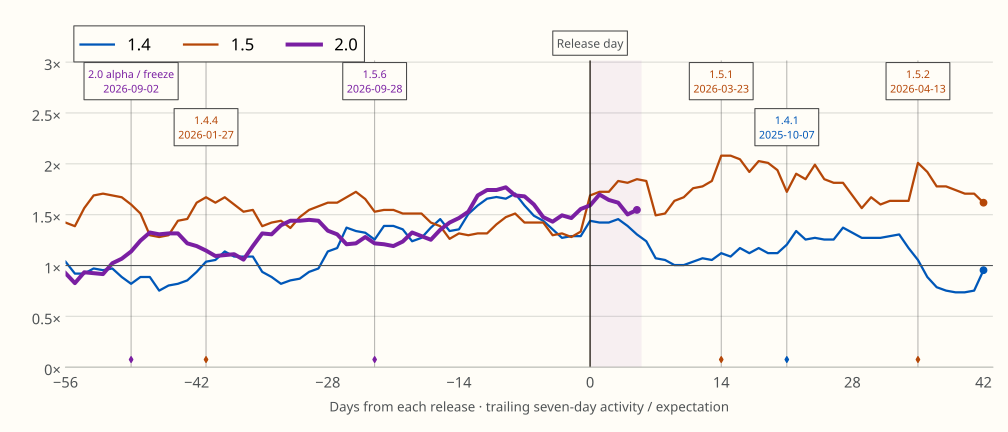
To make the comparison meaningful beyond raw counts, we benchmarked each release against its own pre-release activity. Our baseline uses the average for each weekday in weeks 12 to 9 before release, so we compare a post-release Monday with earlier Mondays. We divide observed activity by that expectation: 1× means activity matched the baseline; 2× means twice the expected activity.
We align all three releases on day zero. This accounts for different starting levels and weekday patterns, but cannot isolate changes in adoption, reporting habits or workloads.
In the matched first week, we found issue intake at 2.7× expected for 2.0, compared with 2.5× for 1.5 and 1.7× for 1.4. Accounting for the baseline narrows the gap between 2.0 and 1.5.
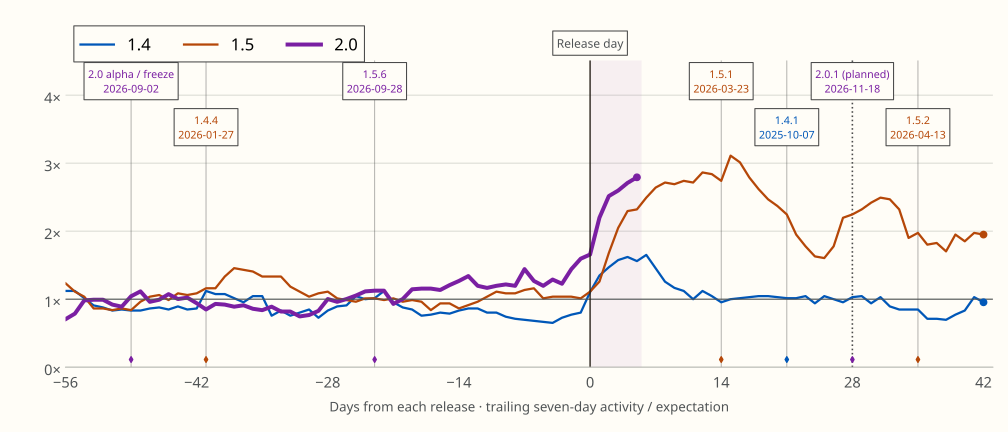
We divide trailing seven-day activity by its expected total. Before day 6, the curve includes pre-release days; the first-week comparison uses days 0–6. The dotted line marks the planned 2.0.1 release on 18 November 2026, day +28. Lines stop at observed data.
The initial surge has eased.
During the latest seven days, 27 October 2026–2 November 2026, issue intake was 1.55× normal, down from 2.72× in the first week. First-time reporting remained elevated at 2.20× normal, compared with 3.95× in the first week. These are ratios of seven-day totals to weekday-matched expectations.
Across each release’s first 13 days, including release day, issue intake was 2.15× expected for 2.0, 2.76× for 1.5 and 1.34× for 1.4. The increase has been less sustained than 1.5’s. Using the final four pre-release weeks as the baseline keeps the same ordering: 1.71× for 2.0, 2.62× for 1.5 and 1.62× for 1.4.
More people are filing issues.
In the first week, we found first-time reporting at 4.0× its expected level after 2.0, against 2.2× after 1.4 and 2.1× after 1.5. “First-time” means their first observed issue anywhere across the 46 repositories. Someone who previously filed against the engine does not become new again by filing against Python.
In that first week, daily reporter participation reached 3.1× baseline, while issues per reporter fell to 0.9× baseline.
Most first-time reporters filed in one repository: 76 of 81. Only 5 filed in more than one. Collectively, they filed across 19 repositories during the matched first-week window. These counts deduplicate people across the whole window. Reporter counts by repository breadth ↓
We have not measured whether these reporters represent a wider mix of users or workloads. An established DuckDB user can also file a first issue.
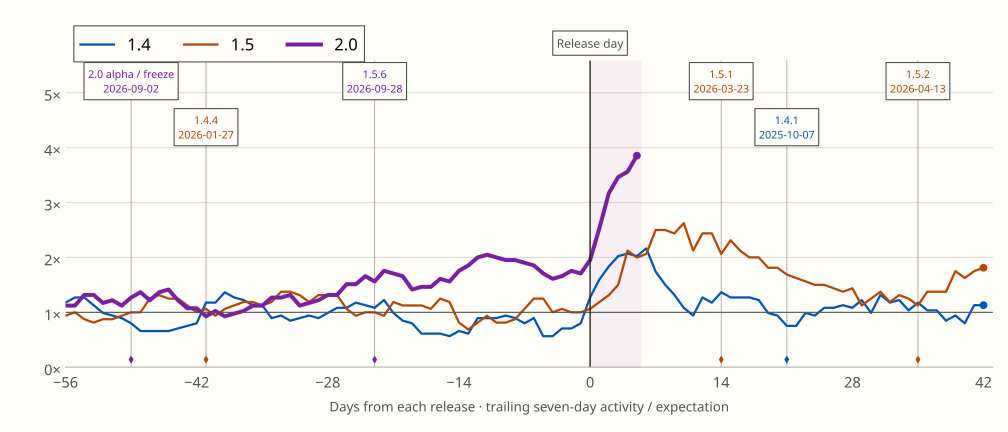
Trailing seven-day actual / expected activity. We count distinct people each day and exclude bots and unavailable identities. These are daily counts, not whole-week distinct-person totals.
Nearly half of first-week issues were outside the core engine.
We found 142 of the 266 issues in the core repository, or 53 percent. Clients, extensions, ecosystem projects and documentation accounted for the rest.
Our 2.0 core baseline predicted 56.25 issues, giving 2.52× expected activity. At 1.5, we counted 42 issues against 13.5 expected: 3.11× baseline. The engine’s increase was smaller at 2.0, despite the higher raw count.
We counted 29 client and installer issues against 12.25 expected, or 2.4× baseline. We repeated the comparison using the final four pre-release weeks: the core increase remained smaller than 1.5’s, and clients stayed above baseline at 1.9×. We cannot claim a larger client response than 1.5’s, because that ordering reverses between baselines. Both calculations ↓
Core engine
142
Language clients & installers
29
Extensions
41
Ecosystem
26
Documentation
28
We group all issue types and versions by the repository where reporters filed them. This does not identify which component caused a problem. “Ecosystem” comprises DuckLake, pg_duckdb, dbt-duckdb and duckdb-skills.
If you use Python and Iceberg, start with reports in those repositories. These links open issues from the matched first-week window. We list sparse baselines separately because a few reports can produce a large multiple when the expected count approaches zero.
Above expected activity
Sparse baseline
Language clients & installers: Rust, WebAssembly, Node.js (Neo), Install scripts, Python CLI.
Extensions: PostgreSQL extension, MySQL, Spatial, Excel, duckdb-avro, duckdb-aws, Delta.
Ecosystem: dbt adapter.
The first list has more issues than expected and at least one expected issue. The second has less than one expected issue or no established baseline. These are descriptive groupings, not confirmed regressions.
What is happening while users wait for a patch?
We tracked PR openings and daily participation by people with a merged PR. We chose people over raw merged-PR totals because an integration bundle can carry many changes in one PR.
PR openings, net of known supersession, moved from 2.1× baseline in the four weeks before 2.0 to 1.8× in the first week afterward. Merge participation stayed close: 1.47× before and 1.54× in the first week afterward. In the latest seven days, merge participation was 1.52× baseline, while net PR openings were 1.55×. Contributors remained active; these counts do not identify which changes maintainers will ship in 2.0.1.
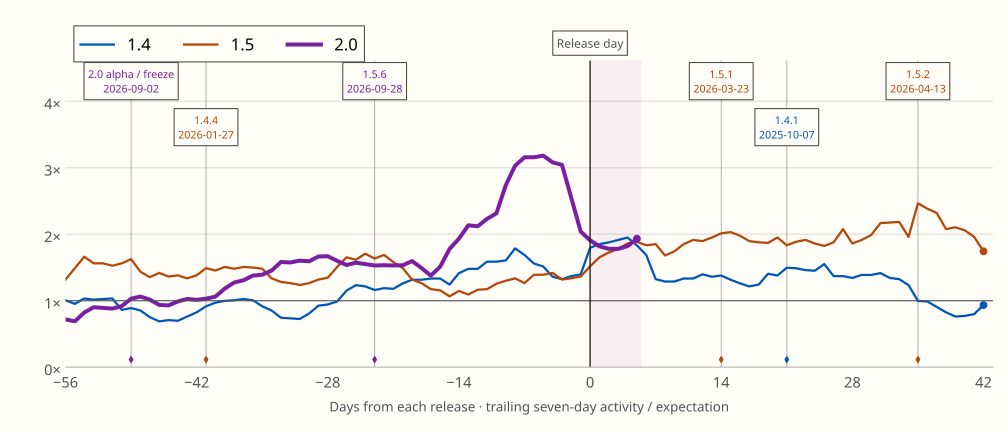
We count PRs opened by people and exclude known superseded or landed-elsewhere PRs. We classify supersession only in the core repository.
We count distinct PR authors each day and plot a trailing seven-day ratio. A bundle’s submitter did not necessarily author every change it contains.
In the first week, we counted 131 issue closures, including 68 for issues opened before release. We have not classified fixes, duplicates or other closure outcomes, so dividing closures by new issues would not give a resolution rate.
So, when should you upgrade?
The engine’s issue surge is smaller than 1.5’s once we account for activity before each release.
These counts do not tell us how severe the reported problems are or what business impact they have. A smaller surge does not necessarily mean a less disruptive release.
The initial reporting surge has eased. Clients and installers had more reports than usual during the first week, so we would start evaluating 2.0 now while paying particular attention to the clients and installers you use.
We would be more cautious about 2.0.1 if new reports stay high or we see no evidence of fixes.
Our current closure counts do not tell us how quickly maintainers fix confirmed bugs.
At Query Farm, we’re shifting our extension and development work to the DuckDB 2.0 branch. We’re watching progress on the 2.0 branches closely and working diligently on the first Haybarn release for DuckDB 2.0.
We’ll keep this report updated as more data becomes available.
Method and data
We analyzed 46 user-facing DuckDB repositories through 2 November 2026 UTC. This preliminary report includes the engine, clients, extensions, ecosystem projects and documentation. We excluded the automated fuzzer, registries and CI tooling. First-week comparisons cover days 0–6 for all three releases. The dated update additionally compares their first 13 days and 2.0’s latest seven-day trend.
We calculate weekday expectations from days −84 to −57 before each release. For window and trend ratios, we divide summed actual activity by summed expected activity. We retain raw daily bins, including day zero, and smooth the calendar with trailing seven-day means.
We also checked the final four pre-release weeks as a baseline. That gives 2.0 issue intake of 2.1× expected and first-time reporting of 2.3×. Our main baseline precedes 2.0’s alpha announcement; 1.5’s includes quieter year-end holidays.
With the alternative baseline, we find core intake at 2.18× for 2.0 versus 3.29× for 1.5. Clients and installers give 1.93× versus 2.15×; the main baseline gives 2.37× versus 2.24×. Changing the baseline reverses the client comparison.
We exclude bots and unavailable identities from people counts. We deduplicate people by GitHub user ID across the selected repositories and determine first issues separately from first PRs. The core history has 17 unresolved records, which can affect first-observed dates. We classify supersession only in the core and use latest closure timestamps without reconstructing reopen cycles. Repository moves and filing habits can affect comparisons. We withhold ratios for zero expectations or unestablished repository baselines.
GitHub links open live pages; downloads preserve our snapshot. Release dates come from DuckDB’s official calendar, checked on 3 November 2026. Planned dates can change.
Working with DuckDB
If you need help with a DuckDB integration, application or upgrade, discuss your project with Query.Farm or email us a brief.
Subscribe to the Query.Farm newsletter for future analysis and notes on building with DuckDB.