We are in a housing crisis, and more specifically, a land crisis. While the US has plenty of spare land in low-value locations (we’ll never run out of land in rural Nevada and North Dakota), we have a limited amount in highly desirable locations close to jobs and amenities. At the same time, legal, infrastructural, and institutional constraints prevent those locations from being used in a way that meets that demand. When demand and supply cannot meet, prices rise–not because there’s not enough housing anywhere in the United States, but because not enough housing is built on scarce urban land, where people desire it the most.
Some still doubt that we really have a housing crisis, so let’s start by establishing two things: a) what we specifically mean by “housing crisis” and b) that we definitely have one.
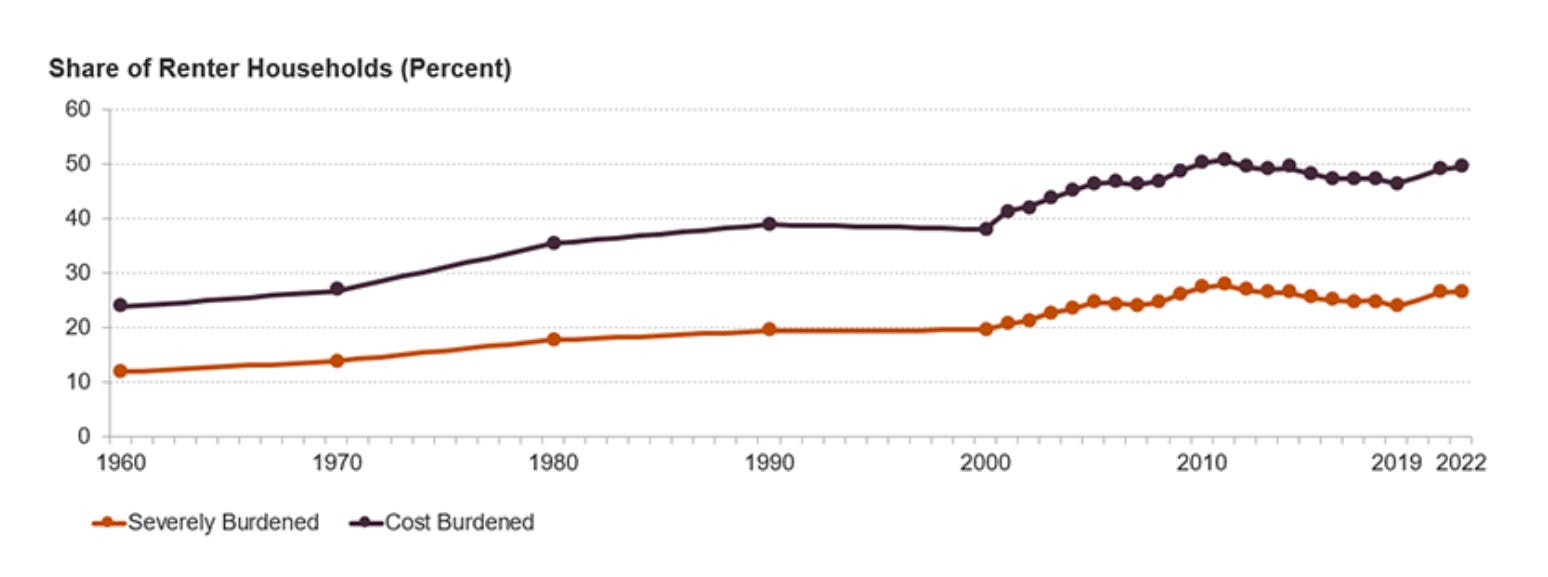
When we say “housing crisis,” we specifically mean housing affordability crisis–people are spending much more of their incomes on housing than they were in the past.
Here’s the evidence: a rising share of renters today are severely rent-burdened, paying over 50% of their income on housing. This share is trending near record highs not seen since the Great Recession, and has nearly doubled since 1970.
A central feature of the housing affordability crisis is the growing gap between what households earn and what housing costs. One way to see this is by comparing wages to home prices over time. The figure below shows an index of weekly wages alongside the Case-Shiller Housing Price Index, which tracks changes in the prices of existing single-family homes. Since the early 2000s, home prices have risen faster than wages. This divergence means that buying a home requires an ever-larger share of household income, placing upward pressure on housing costs throughout the market.
The trend did not begin with COVID, nor did it arrive as a sudden shock, but has been growing for a long time. To understand how the housing affordability crisis came to be, we must first understand the persistent shifts which contributed to it over time.
What the Housing Crisis Is Not
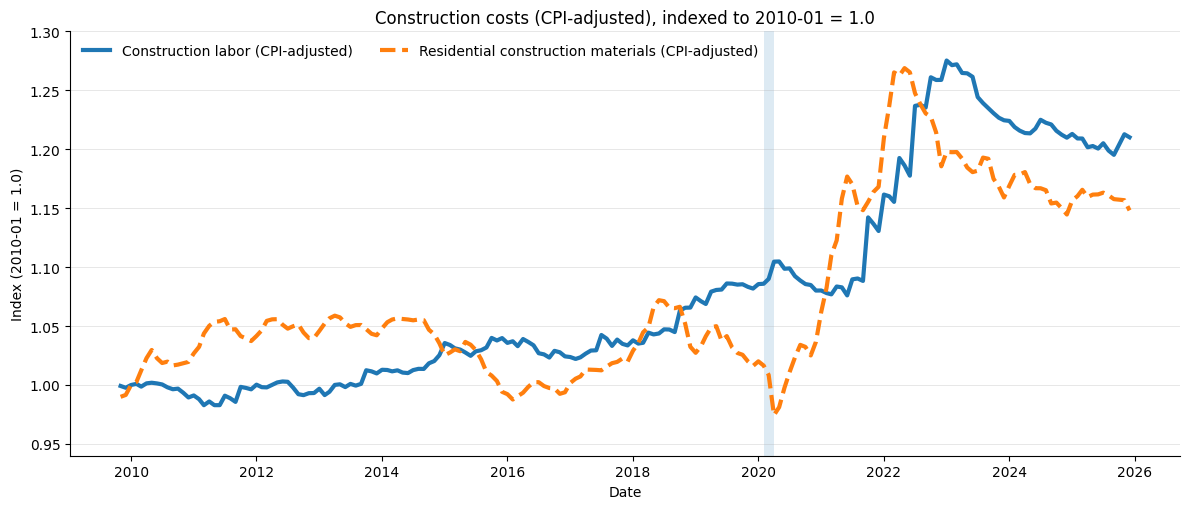
A natural explanation for rising housing costs is that housing has simply become more expensive to produce, or that we stopped building enough of it overall. If this were true, we would expect either rising construction input costs, or a sustained decline in aggregate housing supply relative to population.
At the national level, the data do not support this story. Real residential construction input costs were largely flat throughout the 2010s, prior to the post-COVID supply-chain shock. While costs rose sharply after 2020, housing is a slow-moving asset, and these increases arrive too late to explain a crisis that has already been underway for decades. This series tracks inflation-adjusted producer prices for goods inputs to residential construction (materials and related goods) as well as construction labor costs.
We can get a clearer picture by looking at the number of housing units per capita:
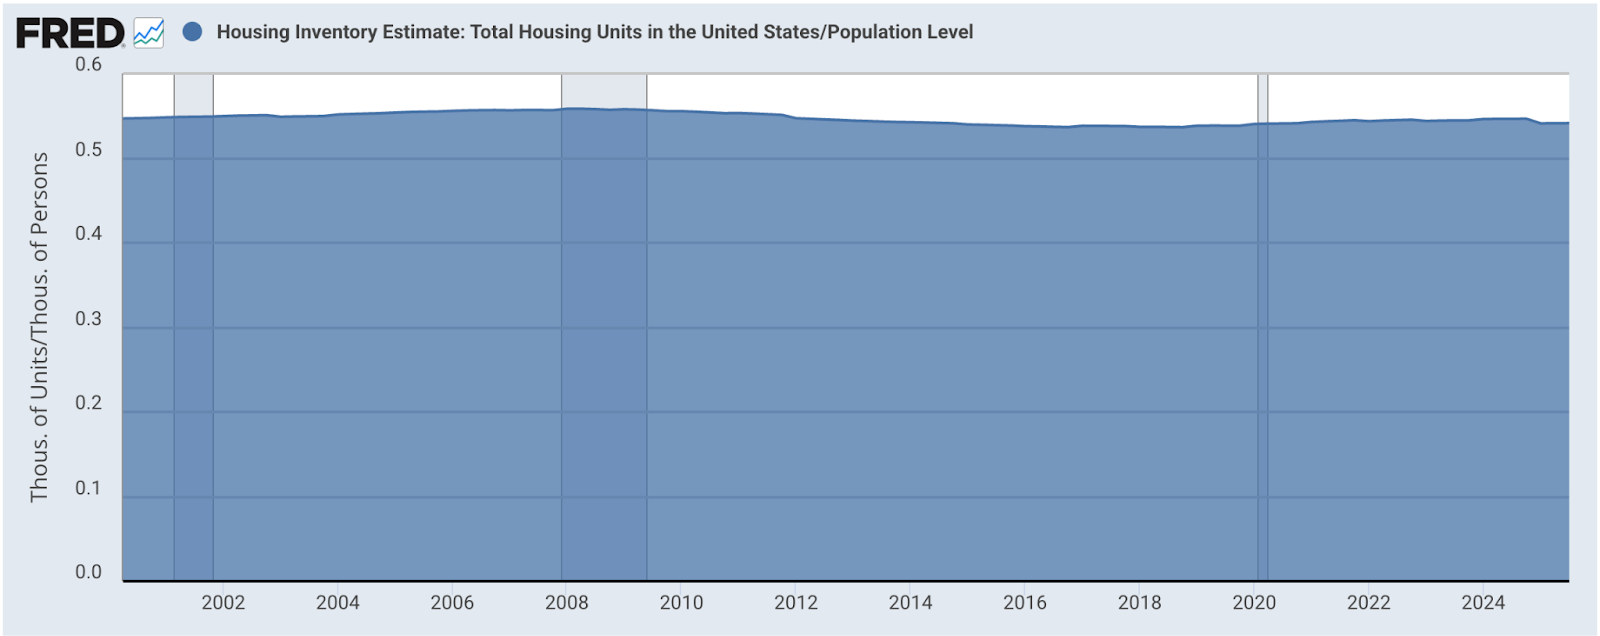
The United States did experience a decline in housing units per person following the Great Recession, when construction collapsed in the face of increasing population. However, that decline stabilized more than a decade ago. For roughly the past twenty years, per capita housing supply has remained relatively steady, fluctuating within a narrow range rather than trending downward.
This distinction matters. The level of housing units per capita today may be lower than its mid-2000s peak, but the change over time does not align with the worsening of housing affordability. If rising rent burdens were driven primarily by an ongoing national shortage of housing units, we would expect to see a continued decline in this measure. We do not.
Taken together, these figures suggest that the housing crisis cannot be explained by a recent collapse in total physical housing supply, nor a sustained increase in costs of construction labor and materials.
If the housing crisis is not driven by aggregate supply, then it must be driven by demand. The question is, what is driving that demand? Or better yet, where is that demand concentrated?
The answer: America’s urban centers. Why then are we not meeting demand in these, the most valuable locations in the US?
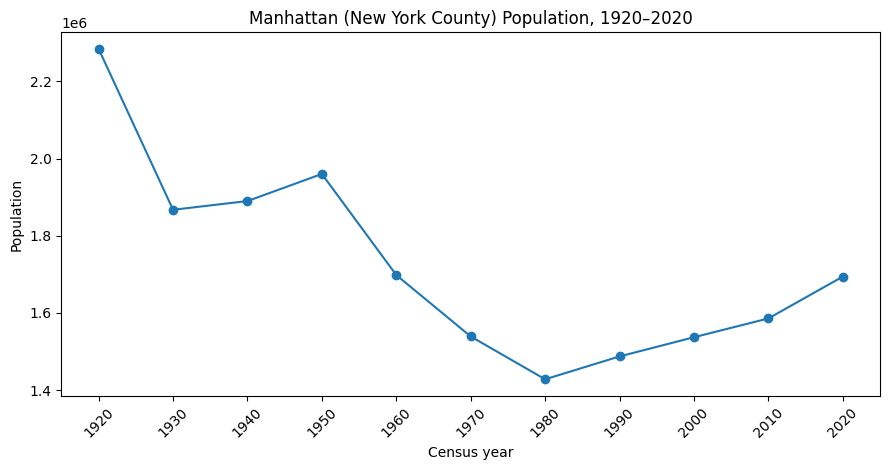
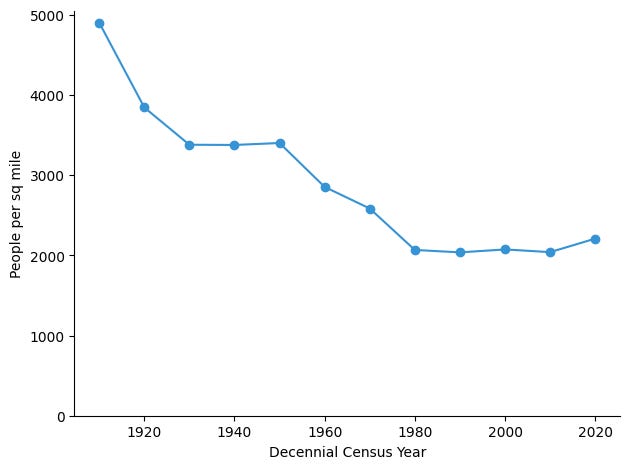
The answer lies in America’s deliberate policy of de-densifying these places over the last century. American cities were once far denser than they are today; Manhattan, for instance, is almost half as dense as it was in 1920, despite renewed demand for urban living.
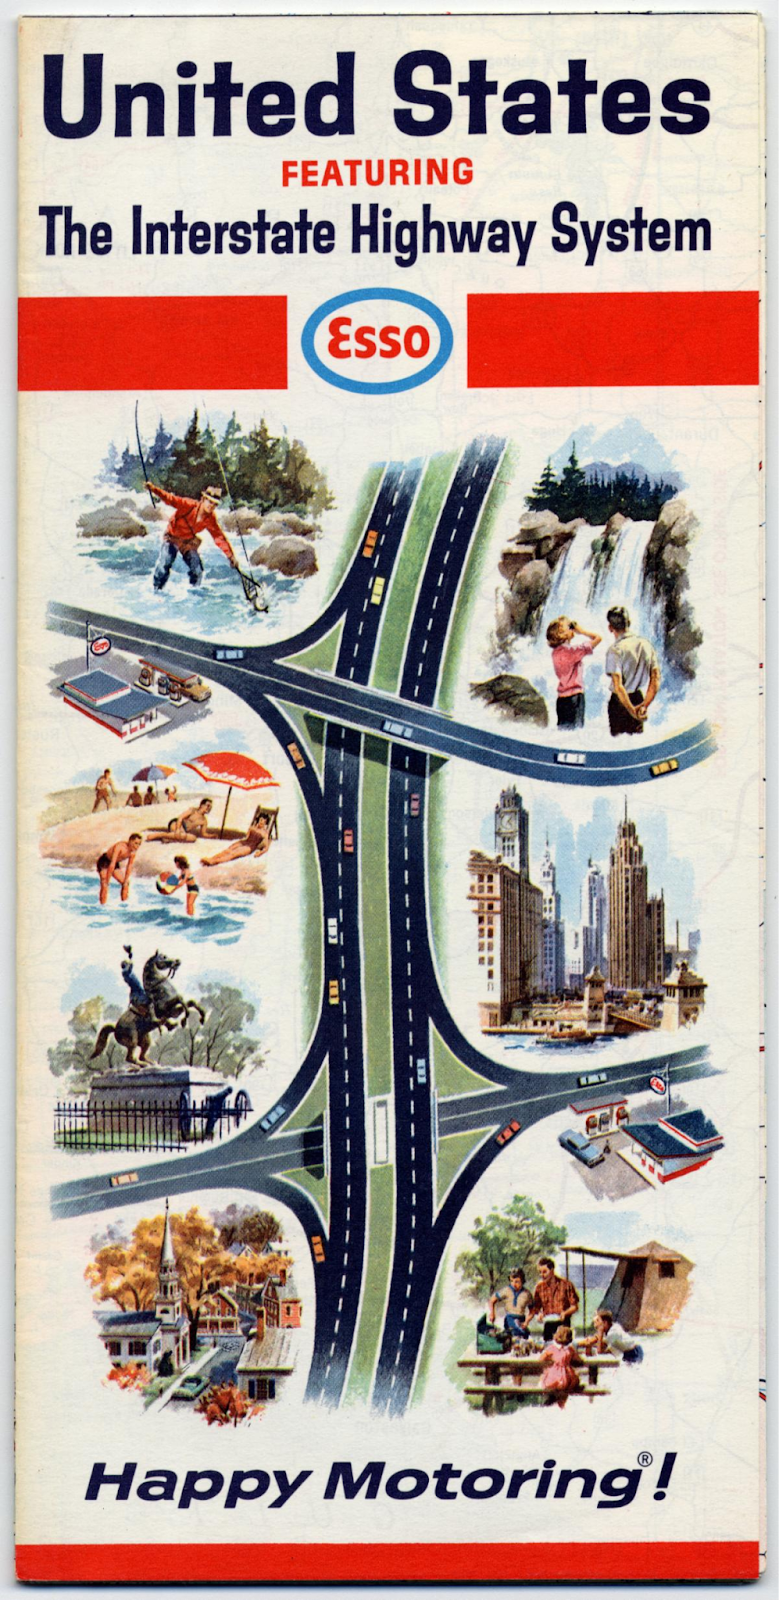
One major force was technological – with the mass manufacturing of the automobile, living farther from city centers became feasible for the first time. However, the decline in urban density over the 20th century was driven just as much by top-down policy as it was by invention and market forces. The Federal-Aid Highway Act of 1956 funded the massive expenditures of the modern interstate system. Oil companies celebrated this transformation, viewing highways as engines of mobility and growth. And indeed they were as they expanded the frontier, America’s traditional solution to housing affordability.
The heavy hand of government wasn’t just limited to highway building, either; deliberate urban renewal policies—which brought along zoning, building codes, and the elimination of single-room occupancies—reinforced the de-densification of American cities, limiting how many people cities could house, even as natural market demand resurged.
The result was a long period of de-densification. And, the broader trend is also visible when looking not at a single city, but at the average population density experienced by a U.S. resident over time. This is a graph of population-weighted density answers a simple question: how dense is the place where the average person lives?
The result shows a dramatic decline in population-weighted density from the early 1900s through around 1980, followed by a long period of relative flatness, when the era of rapid outward expansion largely ended.1
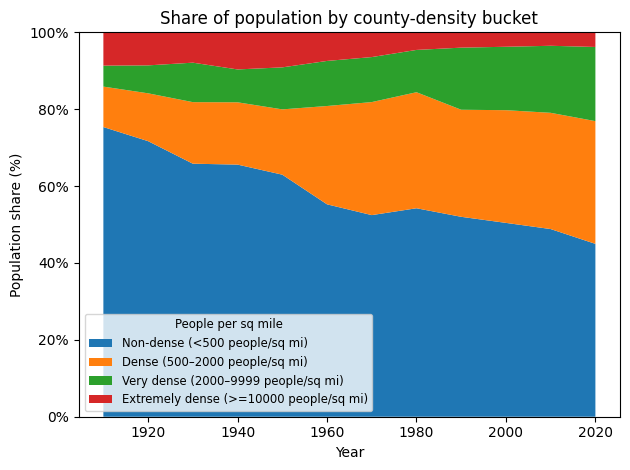
Flat averages, however, hide important shifts. “The great de-densification” can also be thought of as “the great averaging,” as both dense cities and sparse rural areas began to empty out, in favor of semi-dense suburbs and exurbs:
Today, demand has re-concentrated in job-rich regions, even as the systems that once accommodated growth have stalled and shrunk.
The re-concentration of housing demand did not happen for a single reason, but the simple version is that proximity got more valuable while outward expansion got more expensive.
One factor is transportation. During much of the twentieth century, suburbanization was supported by rapid expansion of road infrastructure, which has slowed in modern times. While vehicle miles traveled continued to rise, the total mileage of public roads grew much more slowly after around 1980. The result is congestion: longer commutes, higher time costs, and diminishing returns to living farther from employment centers.

As congestion increases, time becomes more scarce. Time spent commuting is time not spent in work, caregiving, or leisure. For higher-income households in particular, the time value of money rises with wages, making long commutes increasingly costly even if housing located further away is cheaper in nominal terms. This increases demand for living closer to job centers.
Credit markets have also shifted. In the wake of the Great Recession, mortgage lending tightened substantially. A growing share of outstanding mortgages—and especially new originations—have gone to borrowers with very high credit scores, reflecting stricter underwriting standards, particularly after the 2008 financial crisis.
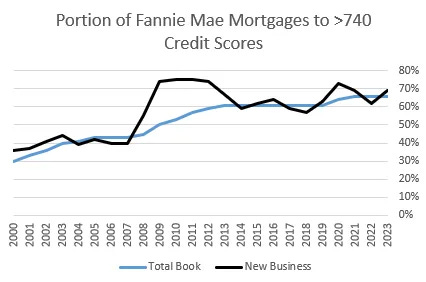
Kevin Erdmann has written extensively about this shift and its implications for housing markets, arguing that tighter credit has constrained access to homeownership and reshaped housing demand. One consequence is that more households remain renters for longer periods of time. Renters, in turn, are more likely to live near job centers, where access to employment, transit, and amenities is more immediate.
Labor market dynamics reinforce this pattern. Over time, college-educated workers have increasingly selected other college-educated workers for romantic partners. The proportion of couples in which both spouses have a college degree has increased from around 5% in the 1960s to around 25% now:
Coordinating two careers makes proximity to dense employment centers essential, compounding the cost of long commutes.
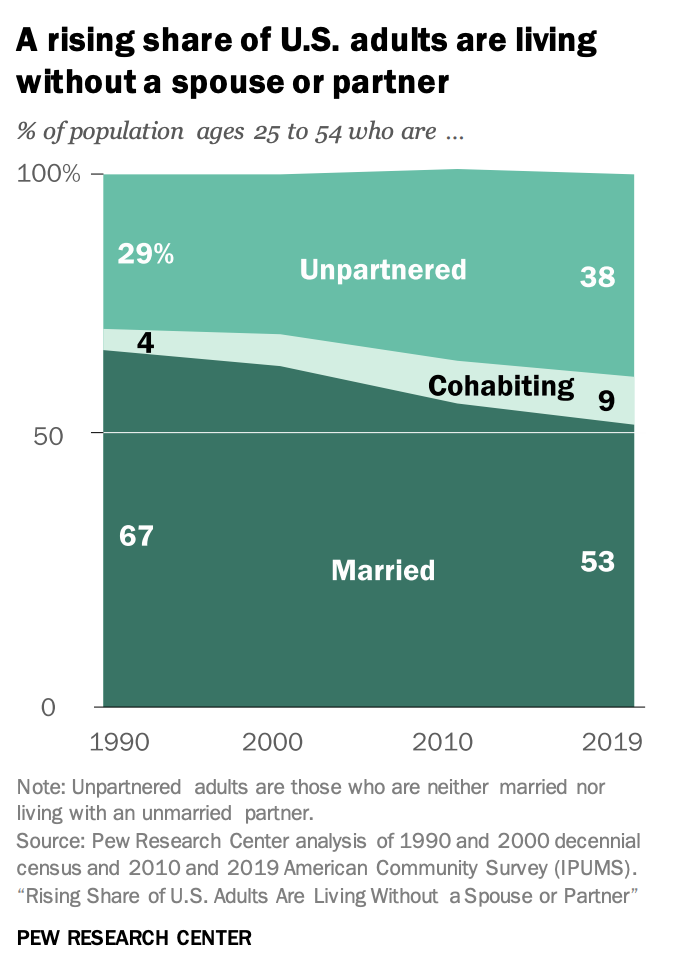
Household structure has also shifted. Marriage rates have declined, coupling patterns have changed, and a growing share of adults live without a spouse or partner. This increases the number of households relative to population and changes residential preferences. Single adults are more likely to locate in urban areas, where jobs, services, and social networks are closer together.
This is not a comprehensive list of all forces at play. Transportation constraints, credit conditions, labor markets, and household structure influence one another, and housing prices themselves may also feed back into these dynamics. No single factor controls the housing market by itself, but all plausibly push demand towards dense, job-rich locations.
If housing costs were rising simply because buildings were becoming more expensive to construct or maintain, we would expect prices to be reflected primarily in structures. Instead, much of the increase shows up in land.
The financial burden on households is increasingly a tax on location rather than a payment for better or more expensive buildings. As reflected in the indices below, the CoreLogic National House Price Index has dramatically detached from the Fixed-Weighted Price Index for Houses under Construction, which tracks the actual cost of materials and labor. While the inflation-adjusted cost to physically produce a house has remained relatively stable for decades, the total market price of homes has surged to nearly six times its 1980 value.
This growing “wedge” is the manifestation of the land crisis. Because physical construction inputs are not driving the price spike, the gap represents the “location premium”---the rising value of land that occurs when demand for a specific area is high but the supply of housing on that land is strictly capped.
Researchers from the Federal Housing Finance Agency (FHFA) have constructed a database of land values at the local level using sales and construction data across the country. This gives us access to understand the time trends of land values, though at an admittedly zoomed-out level. Their data shows that over the past decade, the share of residential property value attributable to land has risen, particularly in urban areas. In rural areas, the land share has declined over the same period.
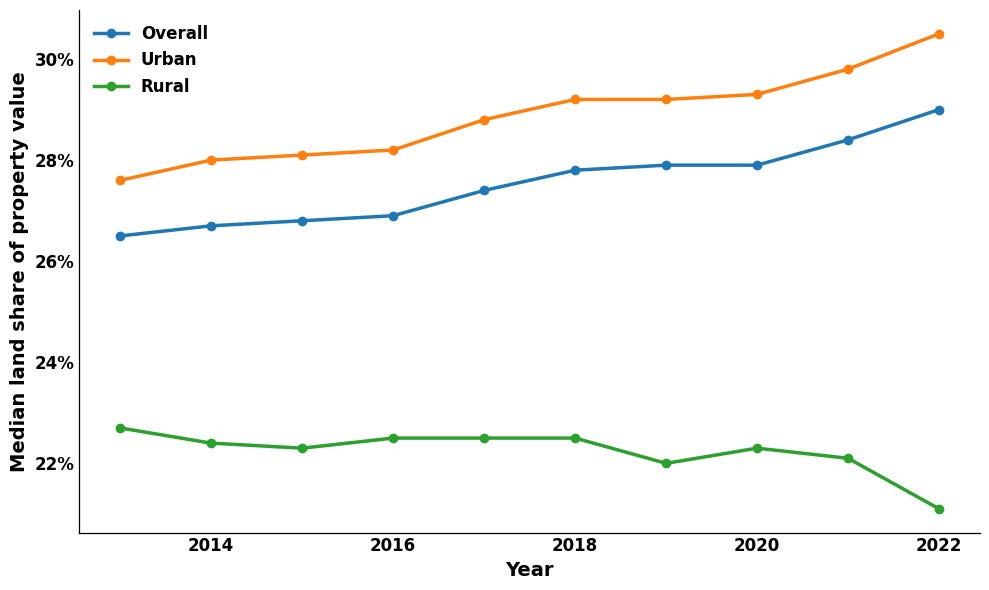
This pattern is revealing. When rents rise without material improvements to buildings, what is increasing is not the value of the structure but the value of the location. When a homeowner’s property tax assessment rises despite no changes to the home itself, that increase reflects land value.
Land value rises when access to a place becomes more valuable and supply cannot expand to meet demand. Zoning, permitting, and building codes constrain how intensively that land can be used, while speculation on future land appreciation may further amplify price pressures.
The housing crisis, viewed through this lens, is not simply a failure to build enough housing. It is a failure to allow high-demand land to absorb more people. Rising housing costs are the price signal of that constraint.
From the stagnation of transportation networks and the tightening of credit markets to the shifting dynamics of labor and household structures, modern economic life has ruthlessly re-concentrated demand into specific, job-rich regions. These pressures act as a funnel, boosting the value of land where housing density has failed to keep pace with the influx of people.
High prices persist because the constraints on that land persist. We cannot overcome the housing crisis without first dealing with the land crisis that underpins it.
We can start by allowing more housing to be built where demand is highest. Zoning has existed largely since urban renewal, and matters more today than ever as demand for urban areas increases. However, upzoning is not enough as it does not address the roots of land speculation. In many urban cities, vacant land or parking lots already empty despite having developable capacity.

The increase in land prices has benefitted landowners and speculators alike at the expense of the renters. To address the land crisis, we should address land speculation head on.
We need to consider land leasing. By shifting toward a system where the community retains a stake in the land, we can ensure that the “location premium” benefits the public rather than just private windfalls.

We need to shift taxes to land value. It is a policy failure to allow the most valuable land in our economy to be used for surface parking lots while people are priced out of the city. We must create structural incentives that encourage land to be put to a good use. This includes shifting the incentives for the large surface parking lots sitting on valuable land in our downtown areas.

The housing crisis isn’t an inevitable fact of nature; it’s a policy choice. By loosening the land constraint, we can finally build the dense and affordable communities the 21st century demands.