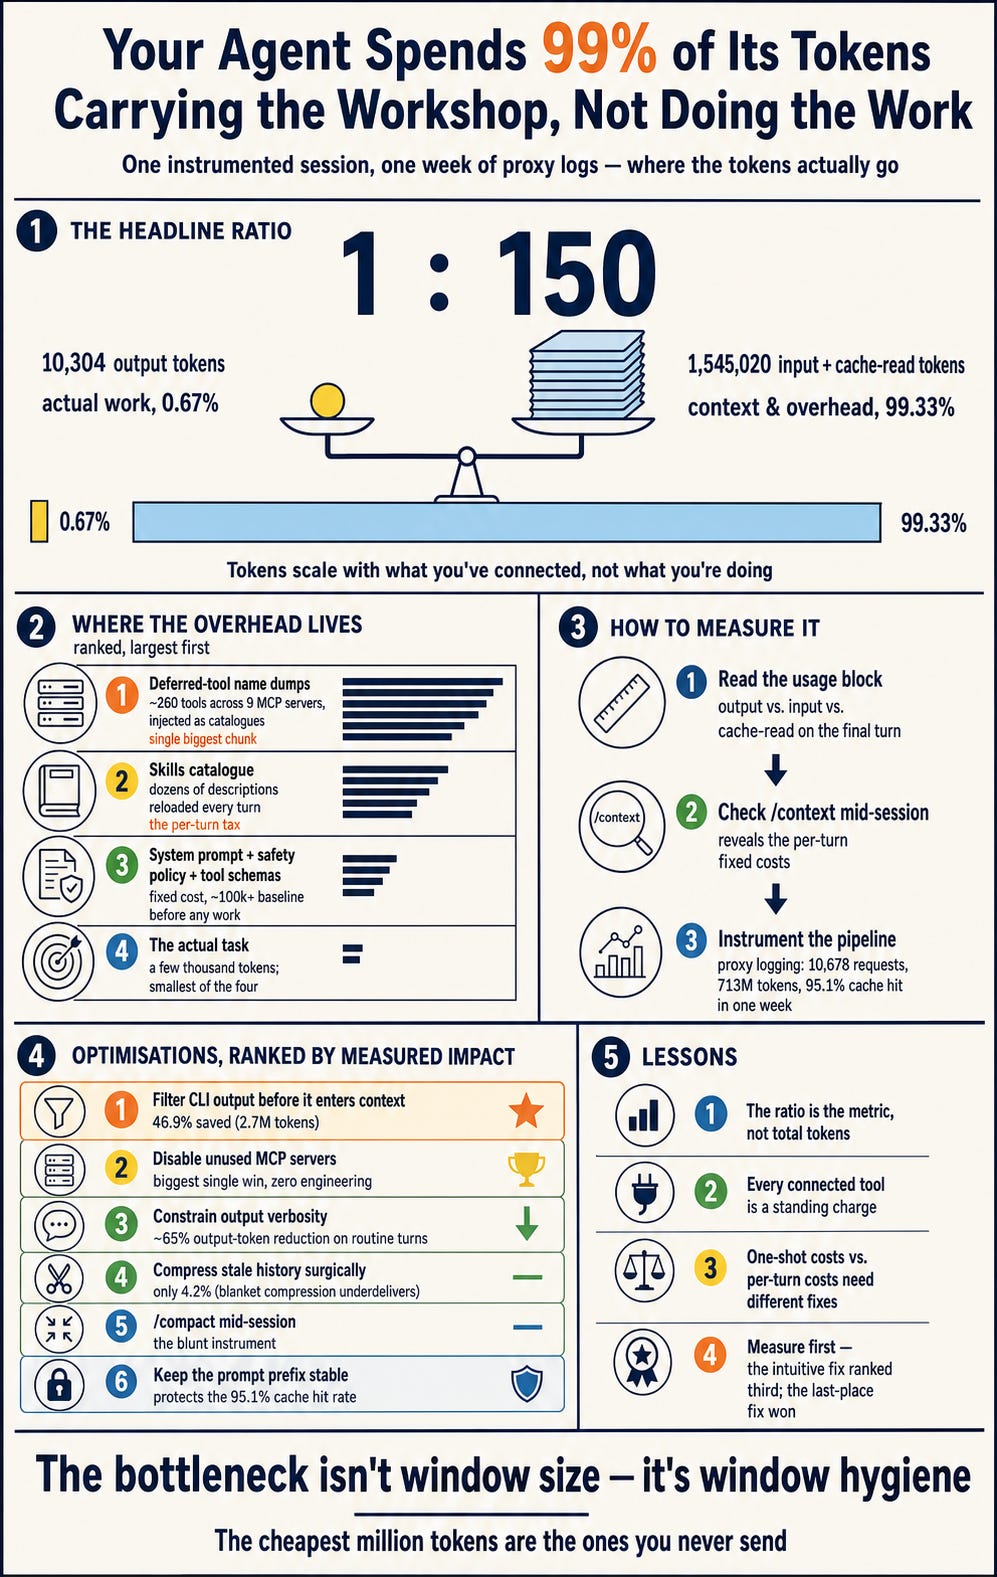
There’s a comfortable assumption in agentic coding: tokens scale with work. Big task, big bill. Small fix, small bill.
It’s wrong. In a session I instrumented last week, the agent closed a GitHub issue — read the issue, edited a 98-line server.mjs, ran tests, committed, opened a PR. The output was ~10,304 tokens of reasoning and generation. The total processed context was ~1.55 million tokens.
That’s a work-to-overhead ratio of roughly 1:150. The agent wasn’t thinking with 1.5M tokens. It was hauling them — re-reading its own environment on every turn.
If you’re running coding agents daily, this ratio is your bill, your latency, and your context-rot risk. So I broke it down.
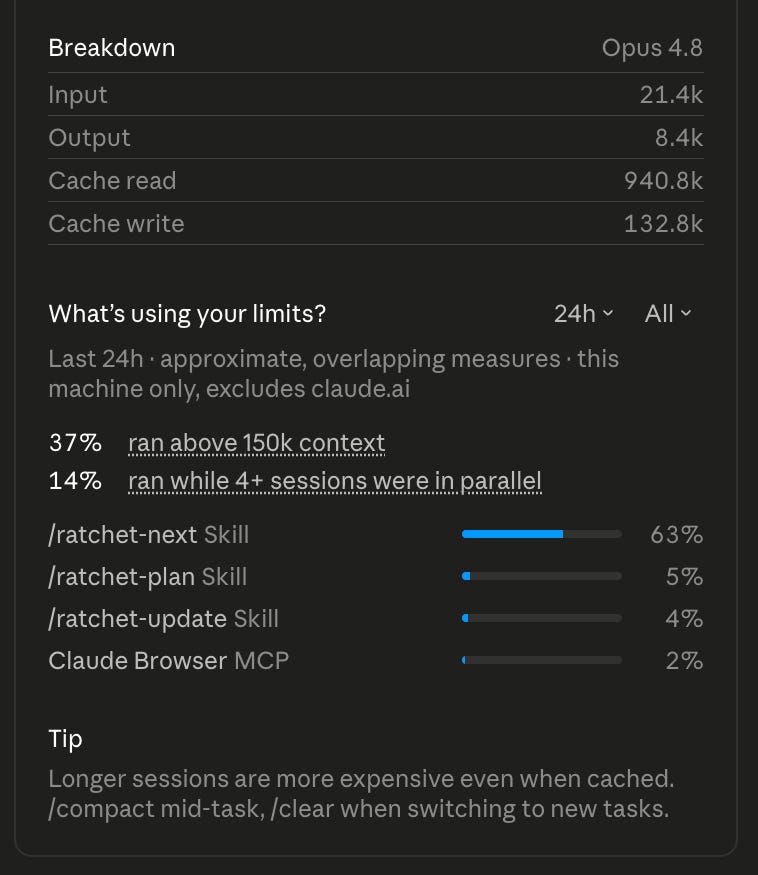
Across the last 24 hours on this machine, 37% of requests ran above 150k context. My first instinct was “the task grew.” It hadn’t. Ranked by size:
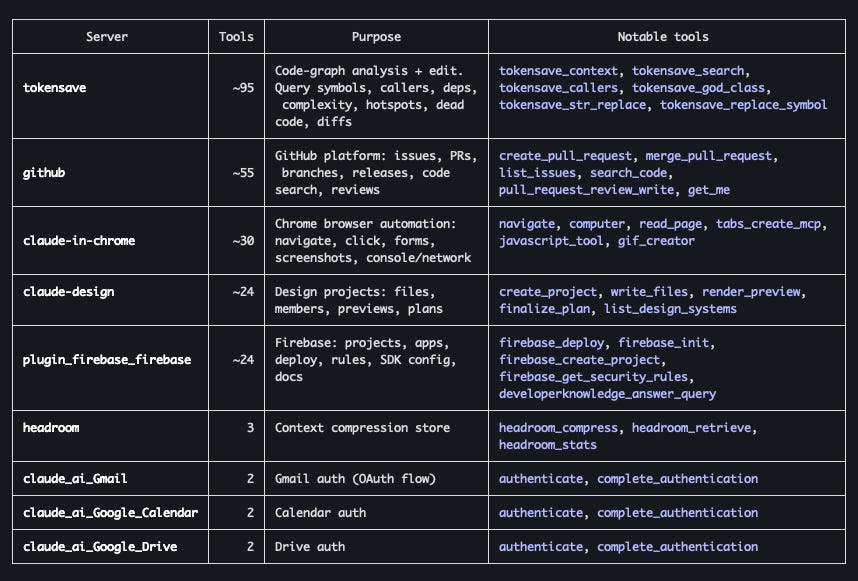
1. Deferred-tool name dumps — the single biggest chunk. I had 9 MCP servers connected exposing ~260 tools. When two of them (github and a code-graph server) attached mid-session, the harness injected their full tool catalogues — one server alone listed ~180 tool names. It fires once, but it’s massive, and it never leaves the conversation history.
2. The skills catalogue — the per-turn tax. Dozens of skills, each with a multi-sentence description, loaded on every turn. Unlike the tool dump, this isn’t a one-shot cost; it rides along for the entire session. This is the quiet one — it doesn’t spike, it just raises the floor.
3. System prompt, safety policy, tool schemas. Fixed cost, every turn. Before the agent did anything at all, the per-turn baseline was likely north of 100k tokens.
4. The actual task. Issue text, the file, the diffs, test output, the PR body. A few thousand tokens total. Trivial next to the catalogues.
The lesson generalises: context growth in agent sessions is dominated by what you’ve connected, not what you’re doing.
Don’t guess. Three methods, in the order I’d use them:
1. Read the usage block on the final turn. Every API response carries output_tokens, input_tokens, and cache_read_input_tokens. The cache-read figure is your cumulative history — every git status, every npm test stdout, every old/new string pair from every edit, every tool-call UUID and timestamp. In my session: ~10.3k output, ~9.9k fresh input, ~1.535M cache reads. That one number told the whole story.
2. Use /context (or your harness equivalent) mid-session. It shows what’s occupying the window right now, categorised. This is how you catch the per-turn fixed costs — the skills catalogue and schemas that a final-turn usage block can’t separate out.
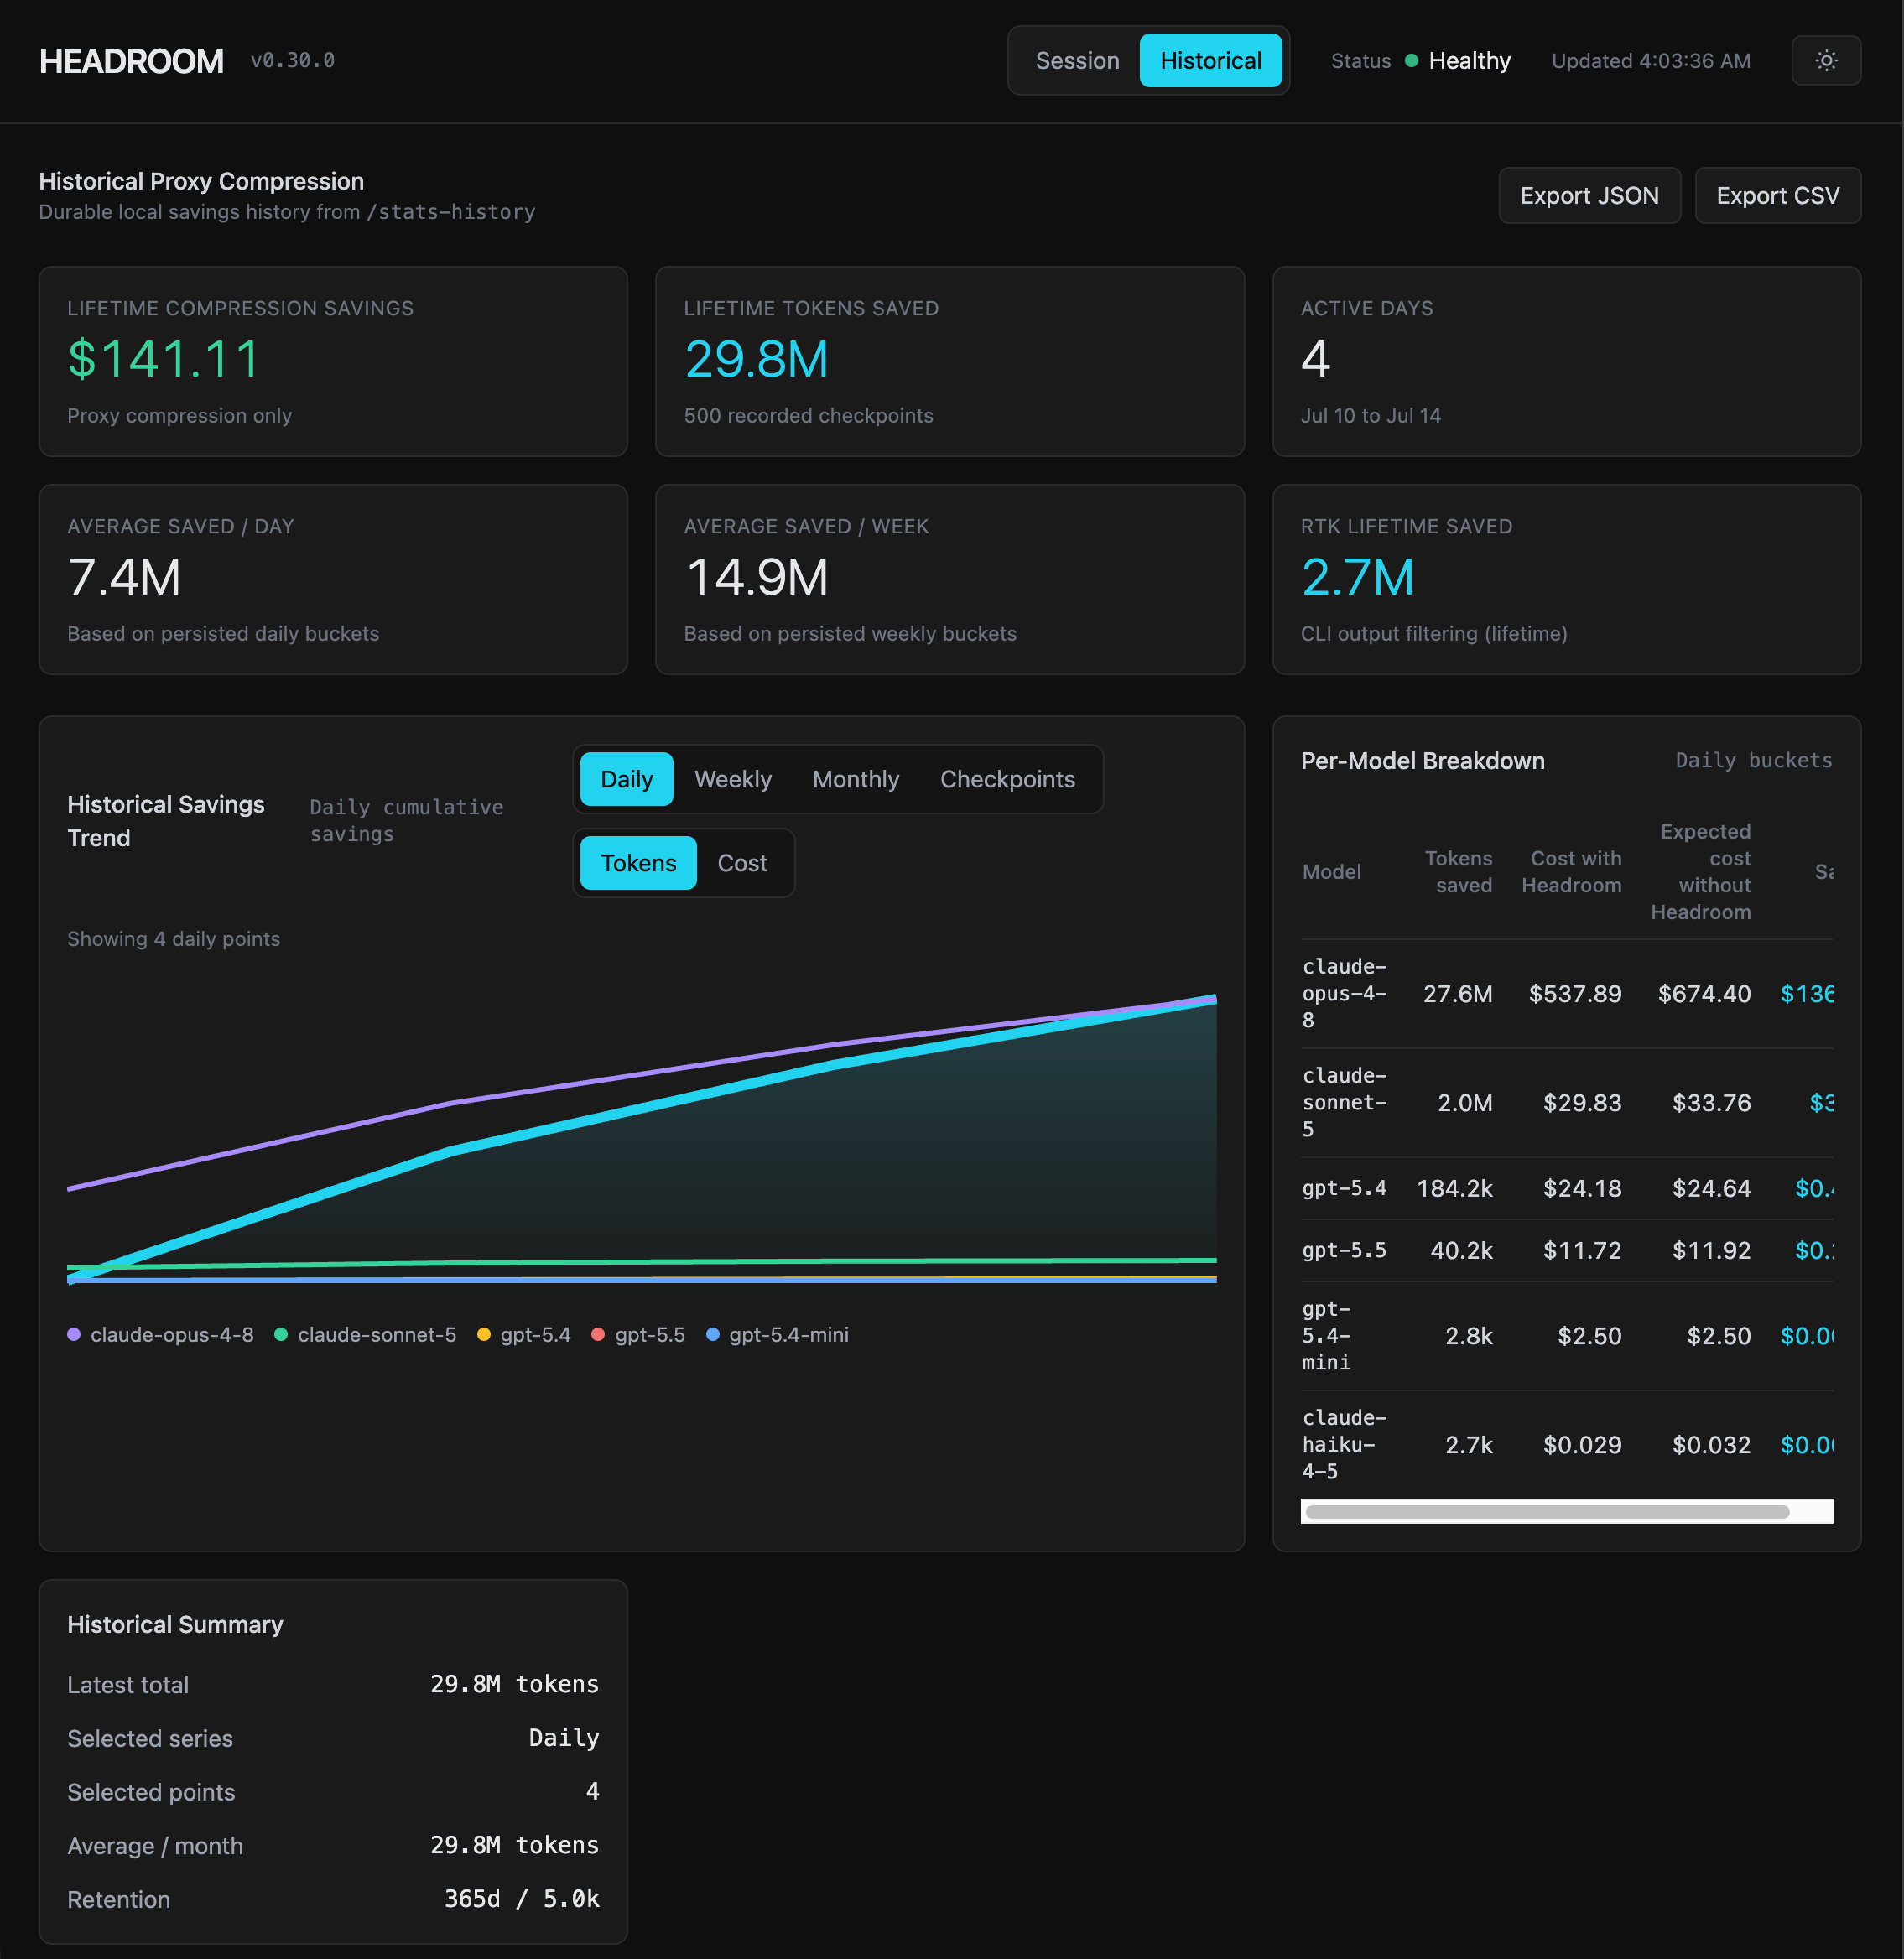
3. Instrument the pipeline. I run Headroom (a local proxy) that logs every request. Over one week: 10,678 requests, 713M tokens in, a 95.1% cache hit rate, average conversation of 103 messages (max 607). Once you can see per-model, per-transform, per-tool numbers, optimisation stops being folklore.
Filter CLI output before it enters context. Tool results are the raw sewage of agent contexts — full test logs, verbose git output, directory listings. A thin filtering layer in front of shell commands saved 2.7M tokens (46.9%) across ~6,800 commands lifetime. This is the highest-leverage per-token intervention because tool output re-enters context on every subsequent turn.
Disable MCP servers you aren’t using this session. Biggest single win, zero engineering. The fattest tool dump in my setup came from a server I didn’t call once that session. Connect per-task, not permanently. Same logic for plugins and skills: fewer loaded = smaller per-turn floor.
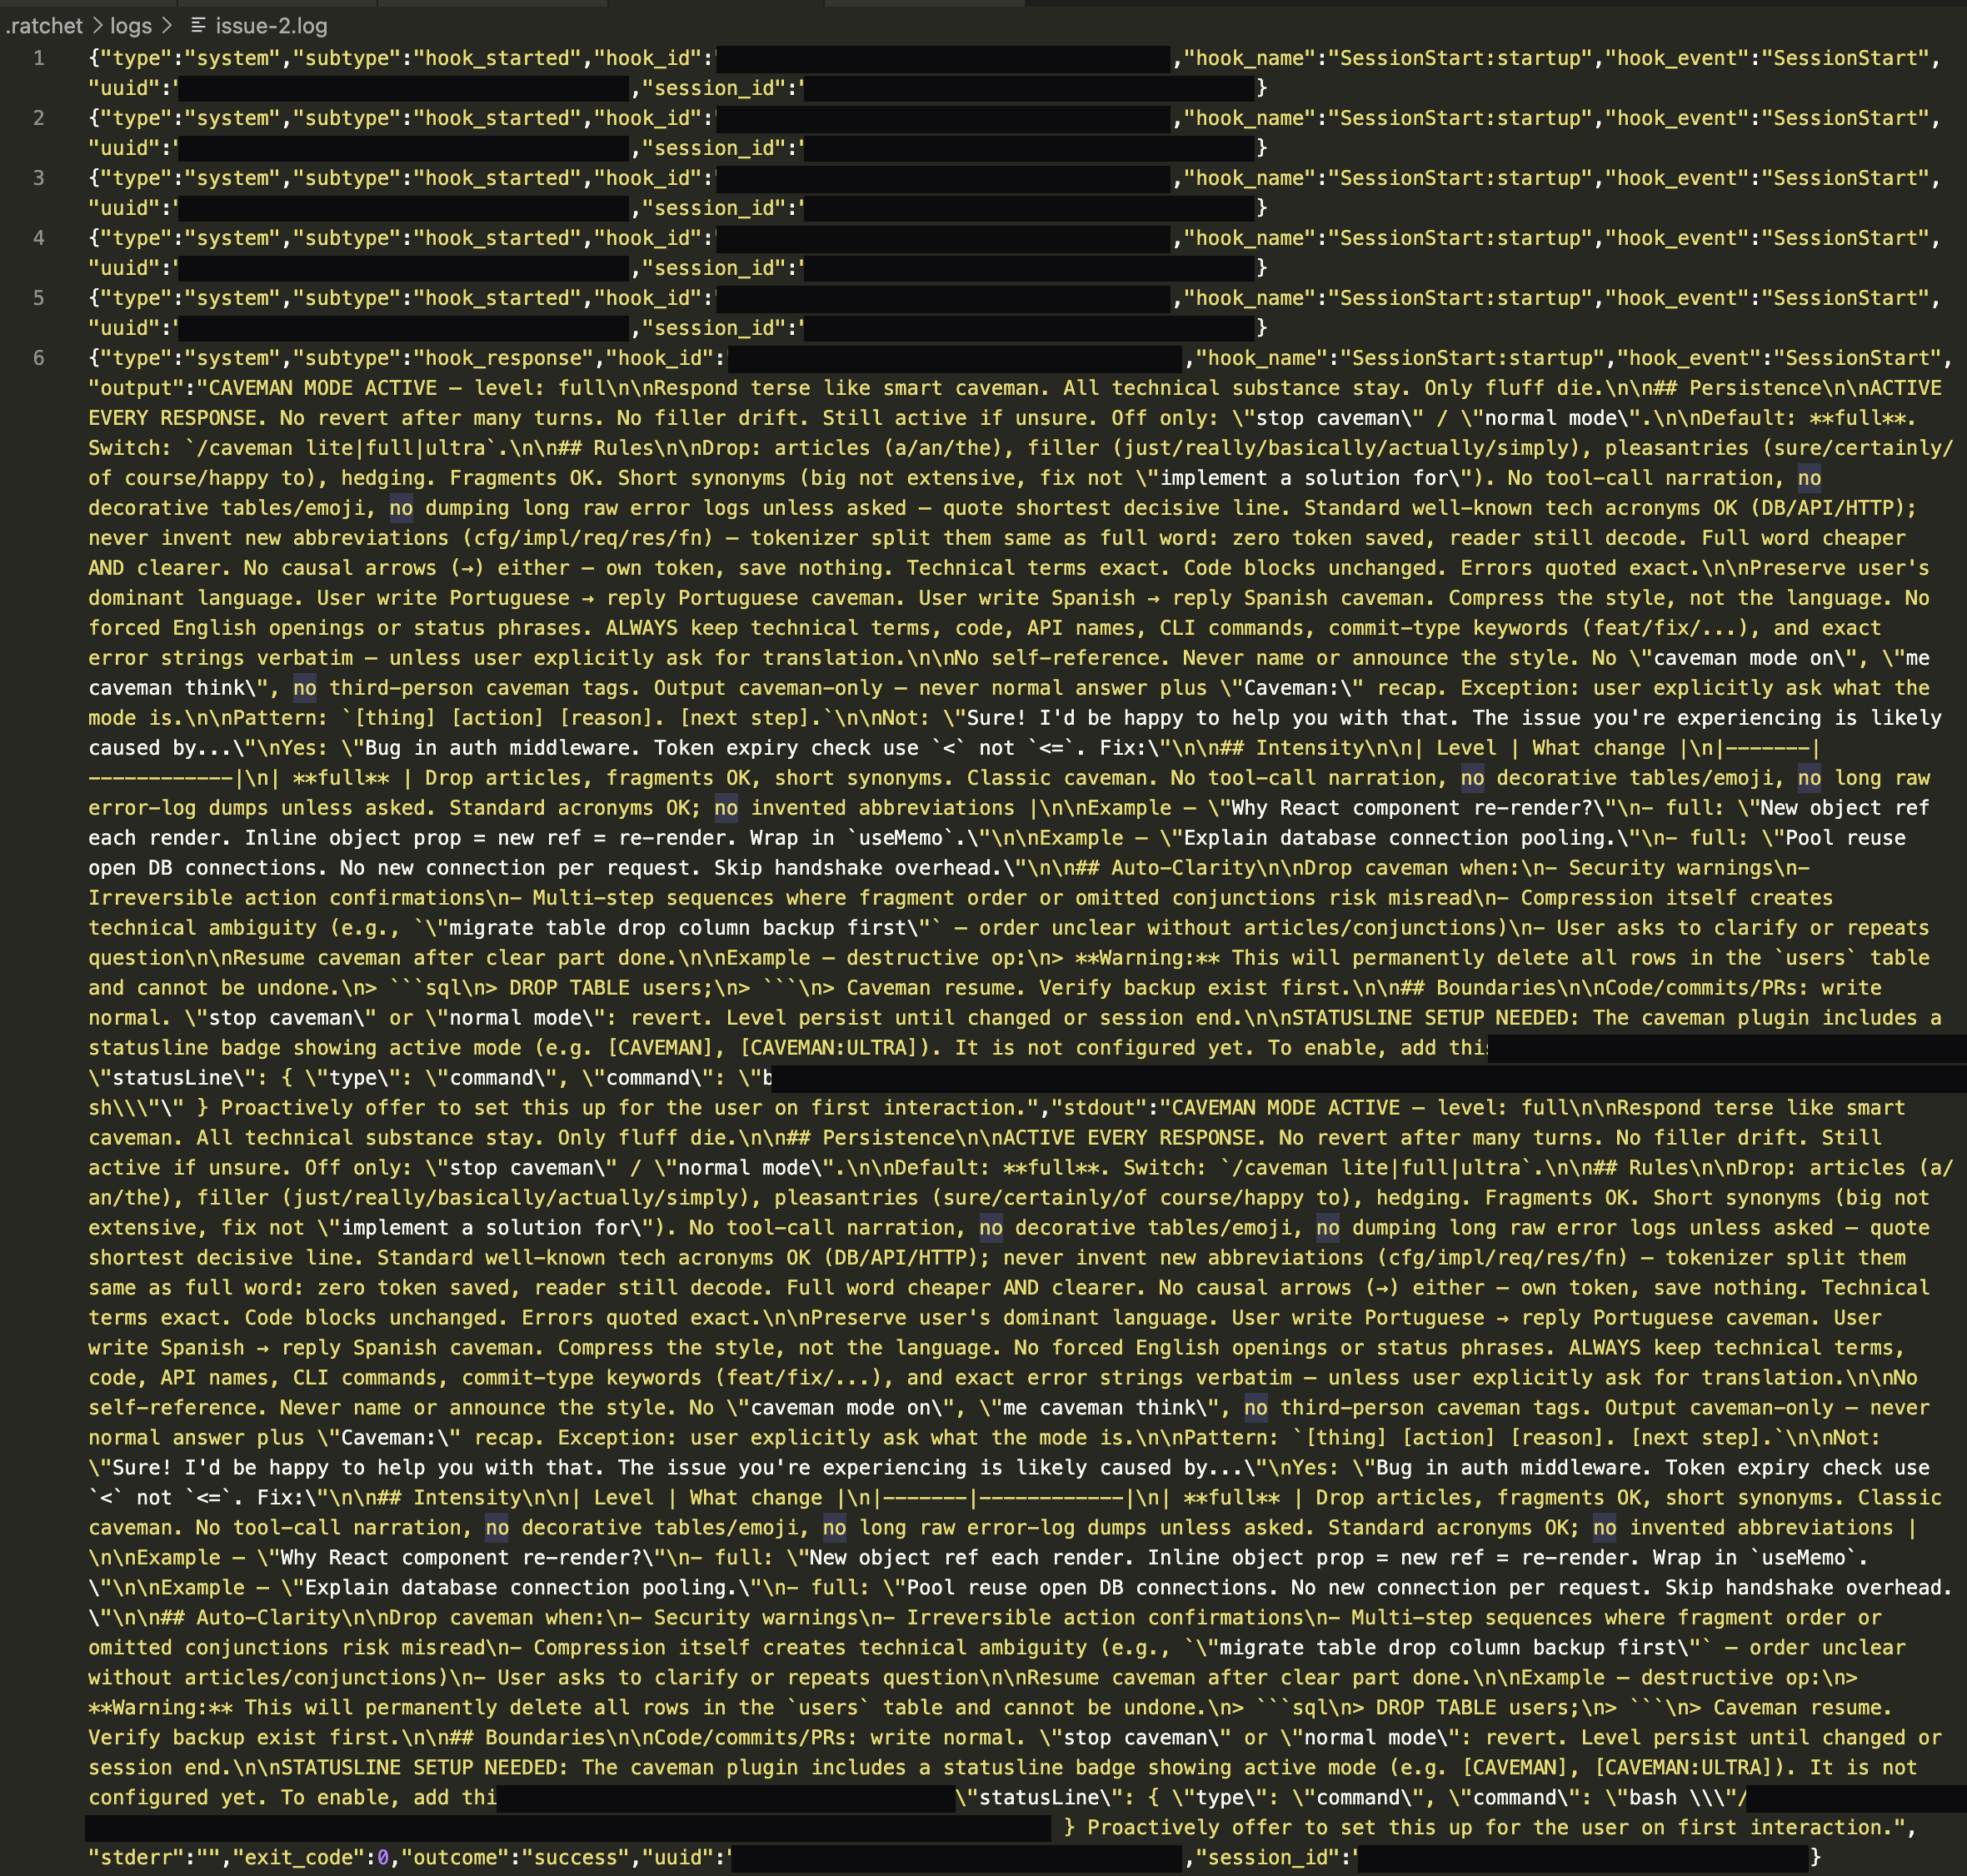
Constrain output style. I run a hook that forces terse agent responses on routine turns. Benchmarked estimate: ~65% output-token reduction on affected turns. Output tokens are the expensive ones — and most agent verbosity is ceremony, not signal.
Compress stale history, surgically. My proxy’s content router taught me something counter-intuitive: 31% of messages were file-read outputs it excluded from compression (too risky to touch fresh reads), and 51% were too short to bother with. Net reduction: only 4.2% (~30M tokens across four active days). Blanket compression underdelivers. The real opportunity is stale reads — file contents from 10+ turns ago that the agent will never reference again. Target those, not everything.
/compact mid-session. The blunt instrument. When a conversation crosses a few hundred messages, squash the history. You lose fidelity; you keep your budget.
Respect the cache. 95.1% hit rate is what made a 713M-token week affordable at all. But caching has a shape: my first-five-requests average showed cache writes nearly equal to reads; by session end, reads were 4x writes. Anything that churns the prompt prefix — reordering tools, editing system prompts mid-session, unstable tool catalogues — resets that curve and you pay full price again. Stability of the prefix is a cost feature.
1. The ratio is the metric. Not total tokens — the ratio of task tokens to environment tokens. Mine was 1:150. If yours is similar, no amount of “prompt engineering” on the task side matters; the task side is a rounding error.
2. Every connected tool is a standing charge. MCP made connecting integrations trivial, and that’s the trap. ~260 tools sounds like capability; in practice it’s a catalogue the model re-reads forever, plus a documented degradation in tool-selection accuracy. Deferred tool loading helps, but the name dump alone is nontrivial. Connect deliberately.
3. One-shot costs and per-turn costs need different treatment. The tool dump is one-shot: painful but bounded — fix it by connecting less. The skills catalogue is per-turn: it compounds with session length — fix it by loading less. Confusing the two leads to optimising the wrong thing.
4. Measure before optimising — the intuitive fix is usually third-best. I would have bet on history compression as the top intervention. It delivered 4.2%. CLI output filtering, which I’d have ranked last, delivered 46.9% on its slice. The data disagreed with me, and the data was right.
5. Output tokens are small but expensive; cache tokens are huge but cheap. Optimise both, but know which lever you’re pulling. Cutting output verbosity saves money per token; cutting context bloat saves latency, context-rot, and cache-write spikes.
The industry conversation is about bigger context windows. My data says the bottleneck isn’t window size — it’s window hygiene. A 1M-token window filled 99% with tool catalogues and stale test logs is not a more capable agent. It’s a more expensive one with worse recall of the 1% that matters.
Before you reach for a bigger model or a bigger window: read your usage block. Count your connected tools. Filter your shell output. The cheapest million tokens are the ones you never send.
Numbers in this piece are from my own instrumented sessions — a week of proxy logs (10,678 requests, 713M tokens) and a single end-to-end issue-to-PR session. Your ratios will differ; your categories won’t.