
Open Trading Surface
An agent-native investment research terminal for Claude
The investment research terminal
whose understanding compounds between sessions.
Open Trading Surface doesn't just fetch data — it maintains a digital twin of the market and hands the agent the controls. The twin discovers an evidence-supported price for every covered name, reconciles it against the price the market discovered, and treats the gap — the residual — as the object of study. A worldview that becomes probability-weighted theses, driver-based company models, a full economic release calendar, portfolios measured to institutional standard, and a complex-event engine that watches for the conditions you actually care about — all on a surface the agent reads and drives, all on your machine.
Runs locally · zero runtime npm dependencies · your keys never leave your machine · never trades
Open Trading Surface — the panel workspace
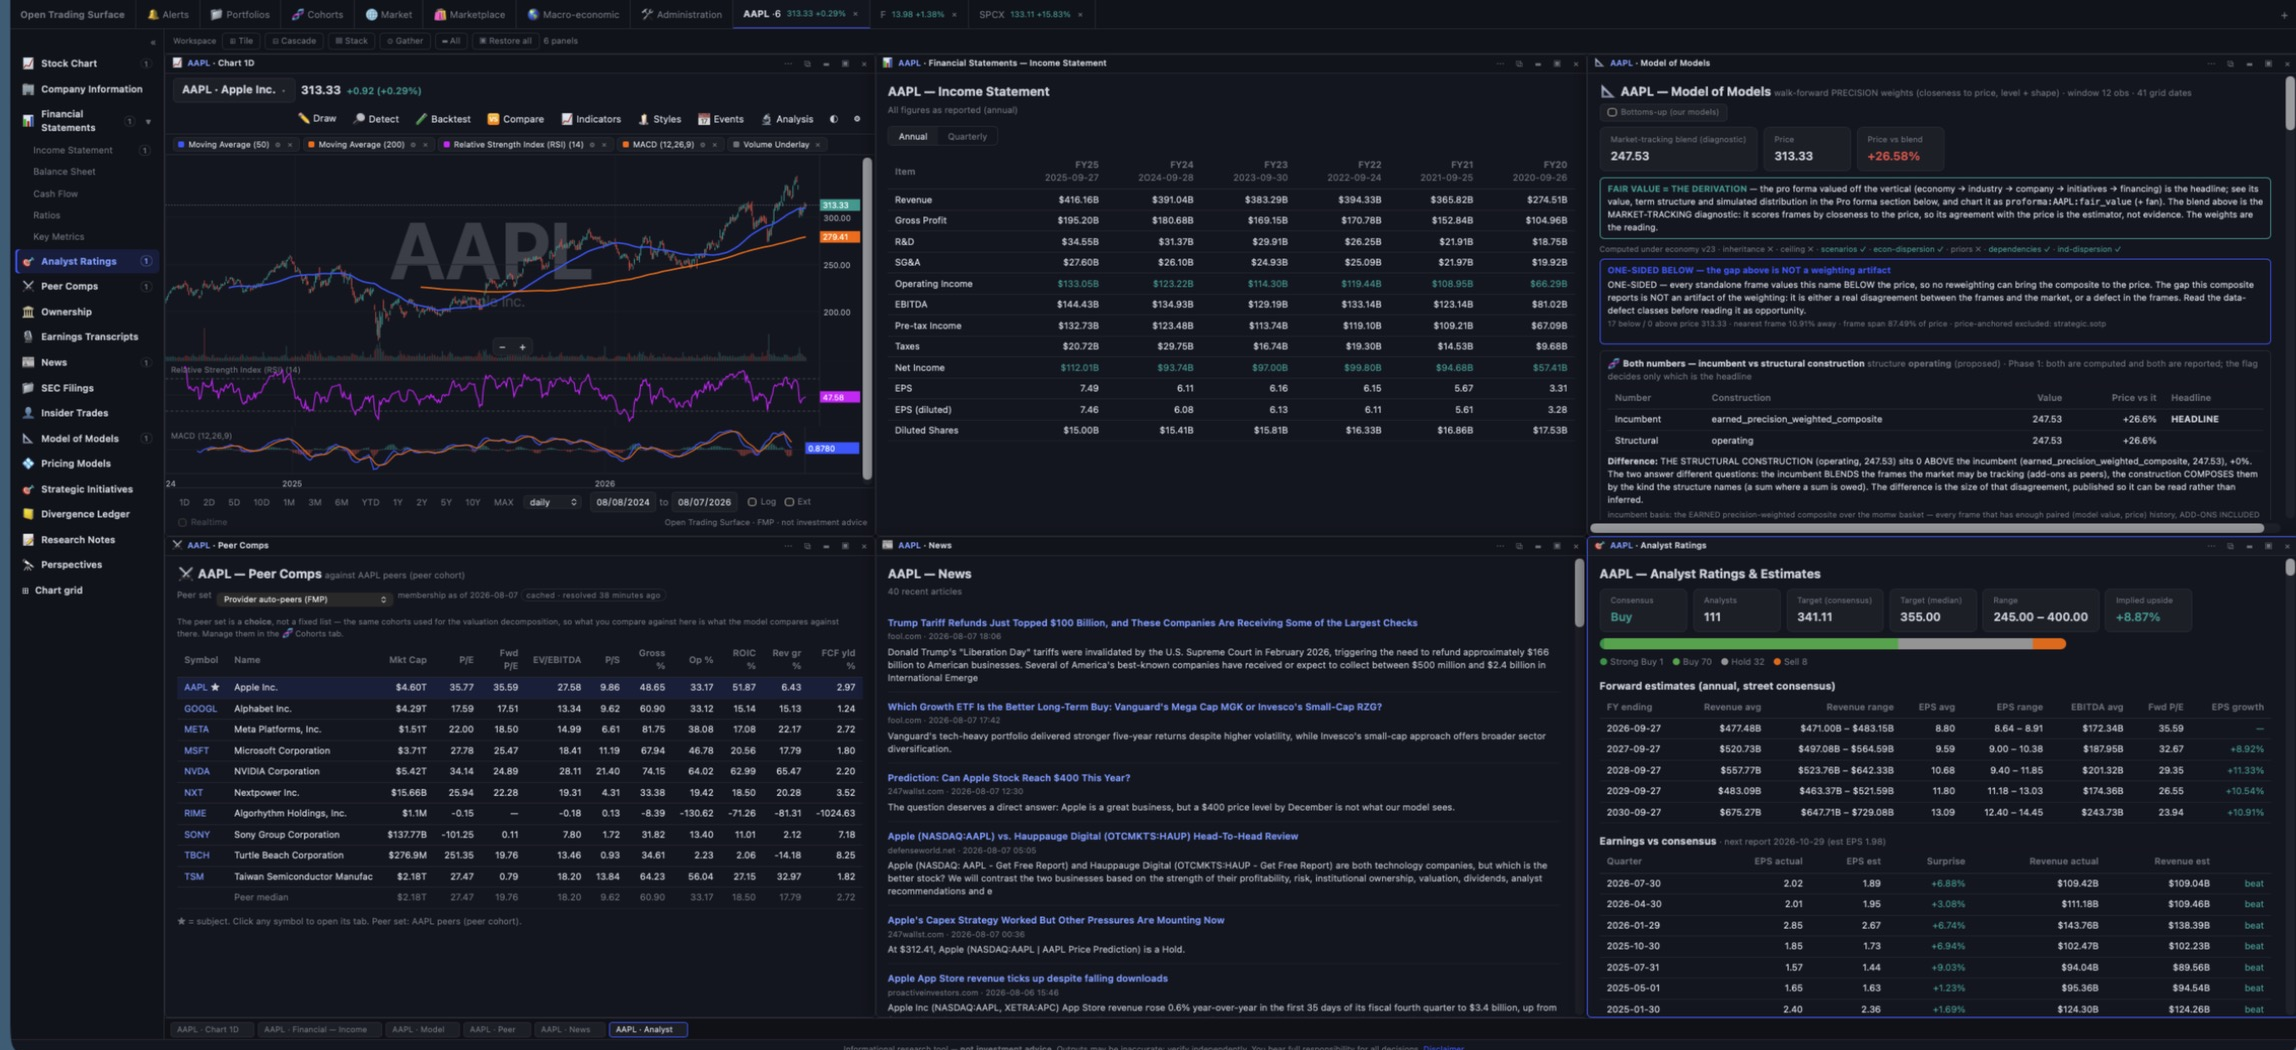
Six panels on one name, tiled. Captured from a live terminal on 2026-08-07 (5.19.6). The workspace chrome and the per-security menu are unchanged since; the chart panel has since gained a 💾 save-settings control and a derived pane-height rule.
Not investment advice. Open Trading Surface is an informational research tool. Nothing it produces is advice or a recommendation; data may be inaccurate — verify everything independently. You bear full responsibility for all decisions. See the full disclaimer.
Most terminals show you data. Open Trading Surface models the market's price discovery.
The market is a price discovery mechanism, not a forecast. Two ideas follow from taking that seriously — and they compound the longer you use it.
🌍
A price-discovery digital twin, not a data feed
A market price is a clearing level, not a prediction — so the twin's job is explanatory: discover an evidence-supported price per name, reconcile it against the market's discovered price, and attribute every element of the reconciliation. The unexplained remainder — the residual — is tracked as a first-class quantity, because that's where discovery failures, regime signals, and reratings-in-progress live. A structured worldview becomes theses with auditable probability estimates, and every name is grounded in a driver-based operating model and an articulated pro forma statement set; it all persists and compounds between sessions.
- The residual field, mapped — a market-wide heat map of price vs the evidence-supported composite across every covered NYSE+NASDAQ name, one recorded day at a time
- A model mixture per stock — walk-forward weights estimating which valuation frame the market is actually pricing a name on; the rotation itself is chartable
- Divergences stored, not discarded — a ledger of event-vs-reaction disagreements, a rerating hypothesis test over shifted weights, and per-event impact routed through the mixture
- One stack, top to bottom — an economy container of time-series variables, an industry rung of priors and elasticities, and a company's own fitted drivers, each disclosing what it contributed
- Worldview → thesis → screen → cohort → name — one connected funnel with a staged journey per thesis, point-in-time honest, with snapshots that keep backtests free of hindsight
🤖
Agent-native by construction
The terminal is a shared world-model: everything you see, the agent can read and drive. It isn't a dashboard a human clicks — it's an operating surface with hundreds of introspectable tools, an event inbox, reusable playbooks, an audit journal, and research memory. The facts, judgments, and their provenance live in the twin; the agent reasons over them — it never has to be the information store. Ask in plain language; the agent inspects the exact panel you're looking at and acts on it.
- inspect_* / control_* — the agent reads state, rendered views, and raw data, and drives every surface
- Parity is proven, not asserted — for the panel workspace and for every sortable portfolio table, a derived test computes from the source that every operation is reachable from a verb and every verb resolves to an operation
- Thinks between sessions — inbox, morning brief, memory, and an API-budget governor
- Governed by design — tuning constants carry their bases, journals are append-only, automations only propose
- Plan-only — it models, drafts, and proposes, and never places a trade
A worldview at the center — fed by FRED macro, SEC filings, and 13F flows — radiates into theses, company models, and portfolios, and the whole system is reassessed as new evidence arrives. That's the twin: a working model of the market in motion.
It refuses rather than defaults — and it shows you its own limits
A defaulted number reaching a valuation with no way to see it is the failure this system is built to prevent. So the honesty is structural, not editorial: it is in the code paths, and it is on the screen.
⛔
A missing input produces a refusal, never a zero
Where a number cannot be honestly computed, Open Trading Surface says so by name — which input is missing, on which leg, and what would fix it. A screen field with six years of history refuses a ten-year growth rate rather than inventing one; a valuation frame that does not apply declines with its reason instead of contributing a silent zero; a bank refuses the modern defensive standard outright because the provider serves its balance sheet in a generic industrial template and the ratios would be category errors.
- The refusal is Tier 1 — it stays on the row, where the missing number would have been, because a refusal you cannot read is not a refusal
- Refusals propagate — where a block declines upstream, the report prints the refusal sentence, never a blank or a default
- There is one numeric admission door, and it decides by type — because
Number(null)is0, and a guard that coerces instead of refusing does not merely fail to help: it publishes - An empty screen is a finding — the modern defensive standard ships stating that it returned zero names, why, and that nothing was tuned to make it return something
📅
Disclosure precedes adjustment, always
When a new layer would move a number you have already read, it discloses before it moves anything — both values side by side, the delta named, and the change recorded as a dated methodology break rather than absorbed. The benchmark moving from a price proxy to a total-return construction lowered every published excess return, and every payload that defines the benchmark says so in a sentence.
- Two numbers before one — staged layers compute the old and the new together, with the published headline unchanged until the switch is deliberately thrown
- The break is dated and named, never edited into history. When filed fundamentals started being dated by when they became knowable rather than by their period end, the release shipped the disclosure channel first, in a release that moved no number at all
- Two-tier disclosure — what changes how a number is read stays on the row; explanation and provenance move behind one icon that states its count and its highest severity
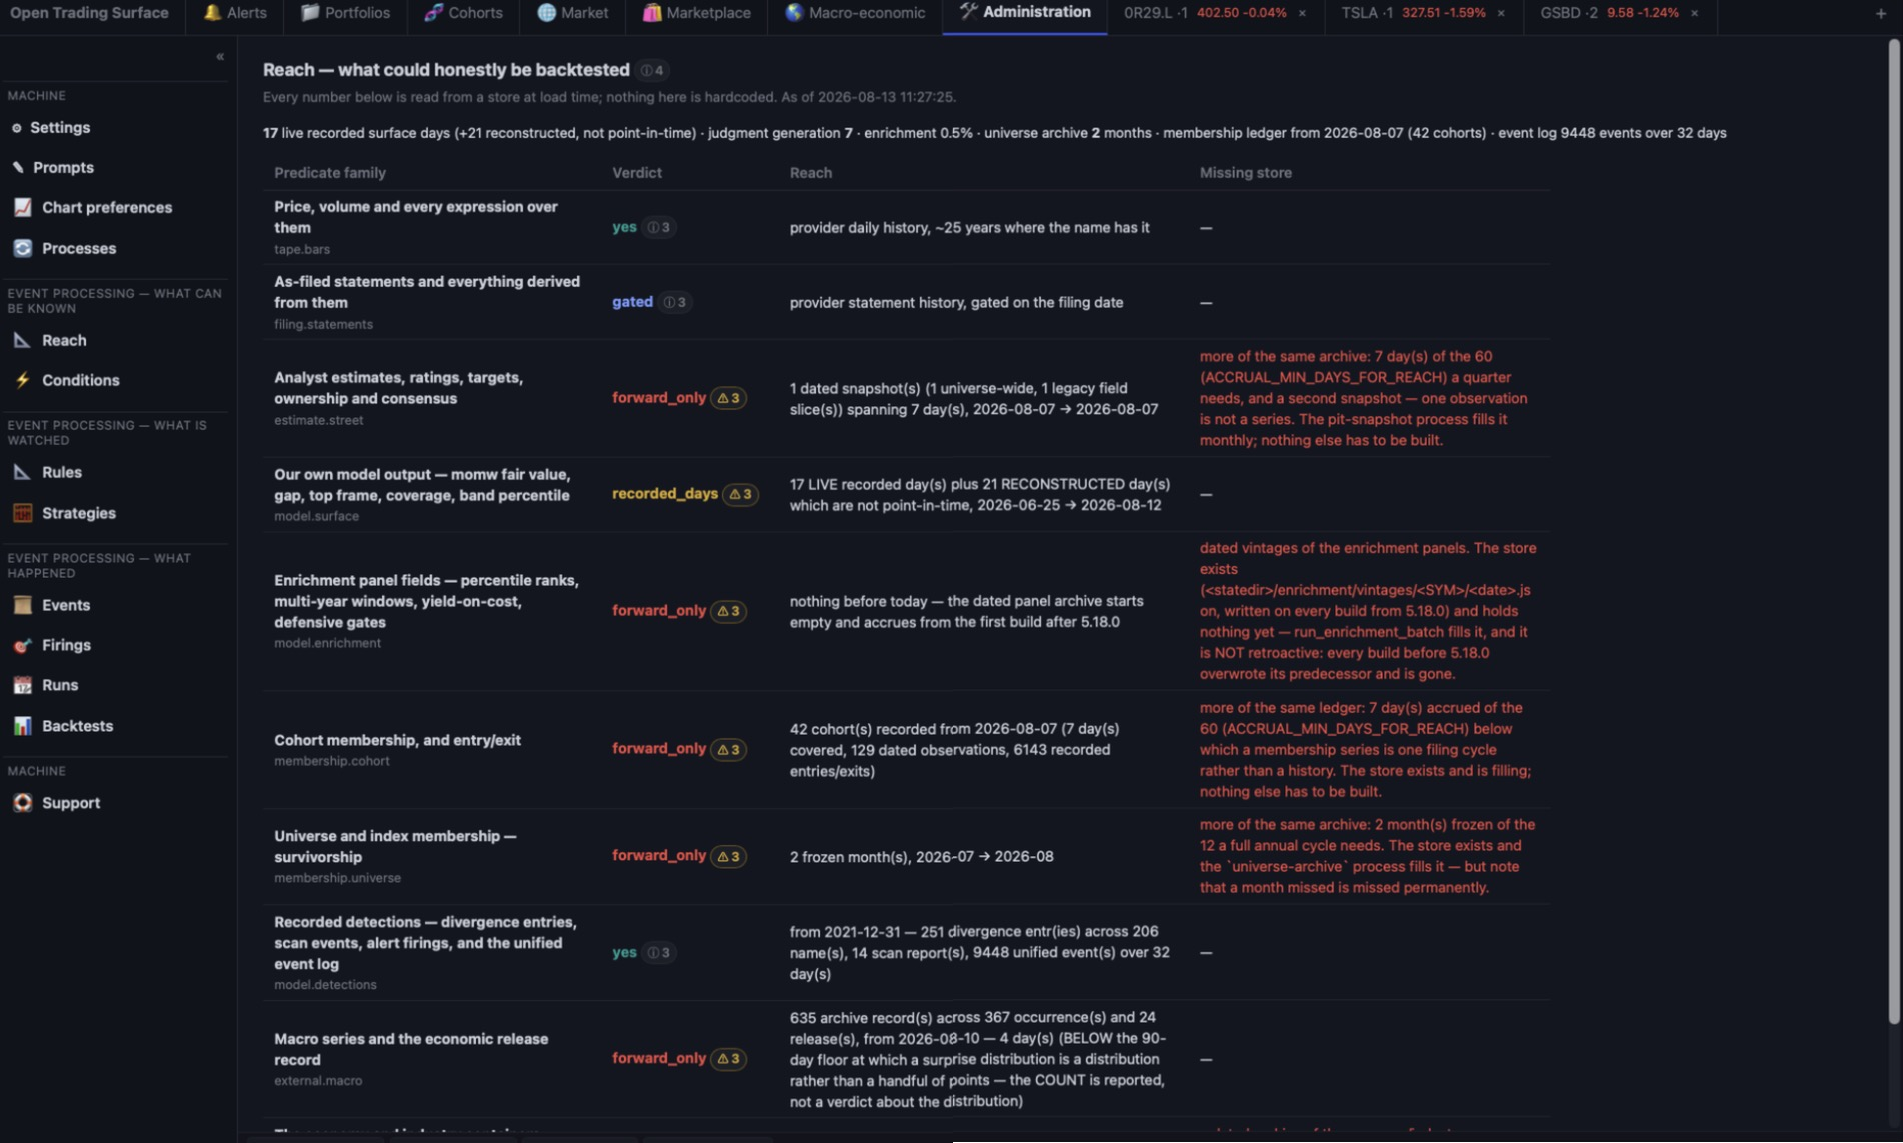
And the backtester is built to the same posture: a run that declines is a result. It refuses a cohort-scoped historical window with no dated membership ledger, refuses a predicate leg with no point-in-time value, refuses to rank a 2019 candidate set by today's fundamentals, and refuses a tape that does not reach the date you asked for — each by name, each before it runs.
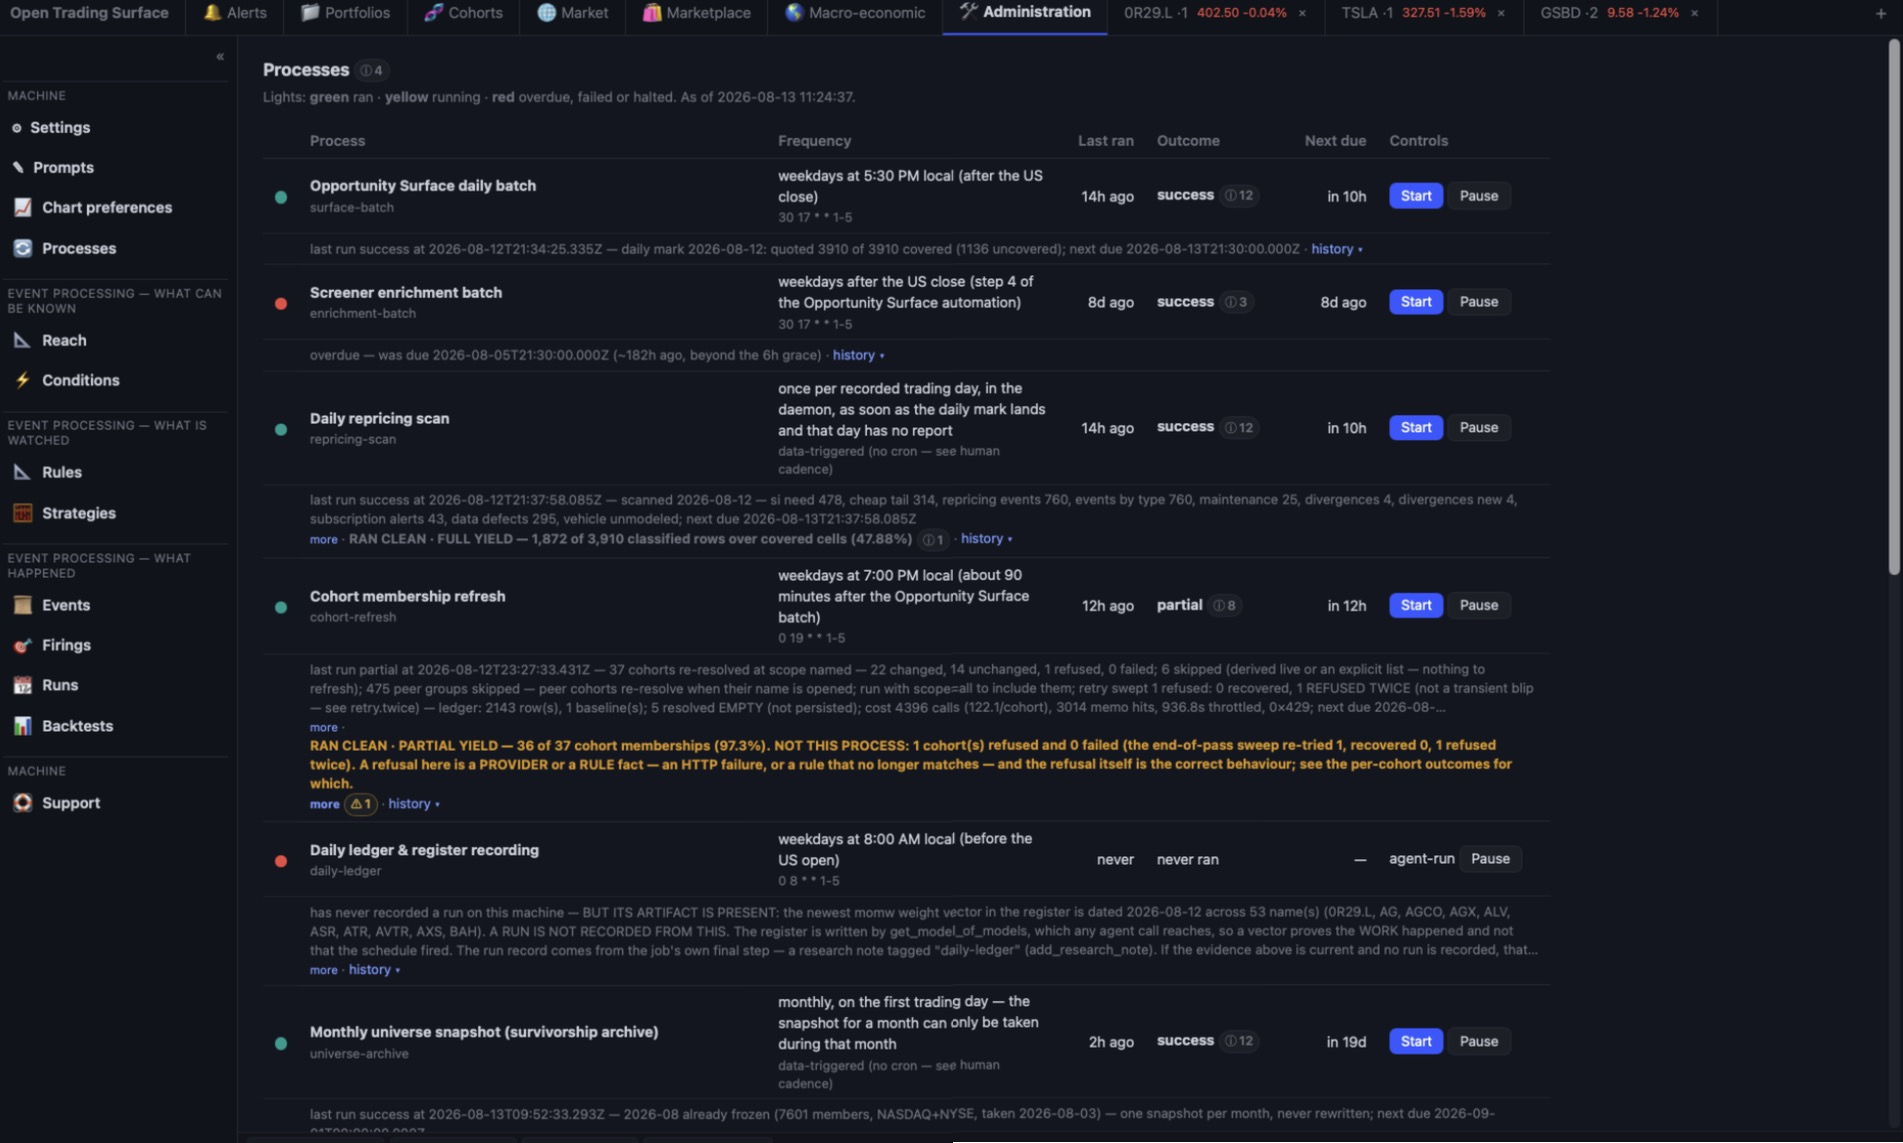
A green light is not always the answer you asked for. A process that ran cleanly over a near-empty input reports success — and success is not the question the reader had. So every batch also publishes a yield verdict from a closed vocabulary (full · partial · near_empty · empty_by_design · not_applicable), and a short verdict is required to name whose shortfall it is. A yield disclosure that does not say whose job the gap was converts a useful fact into a false accusation.
A workspace, not a tab
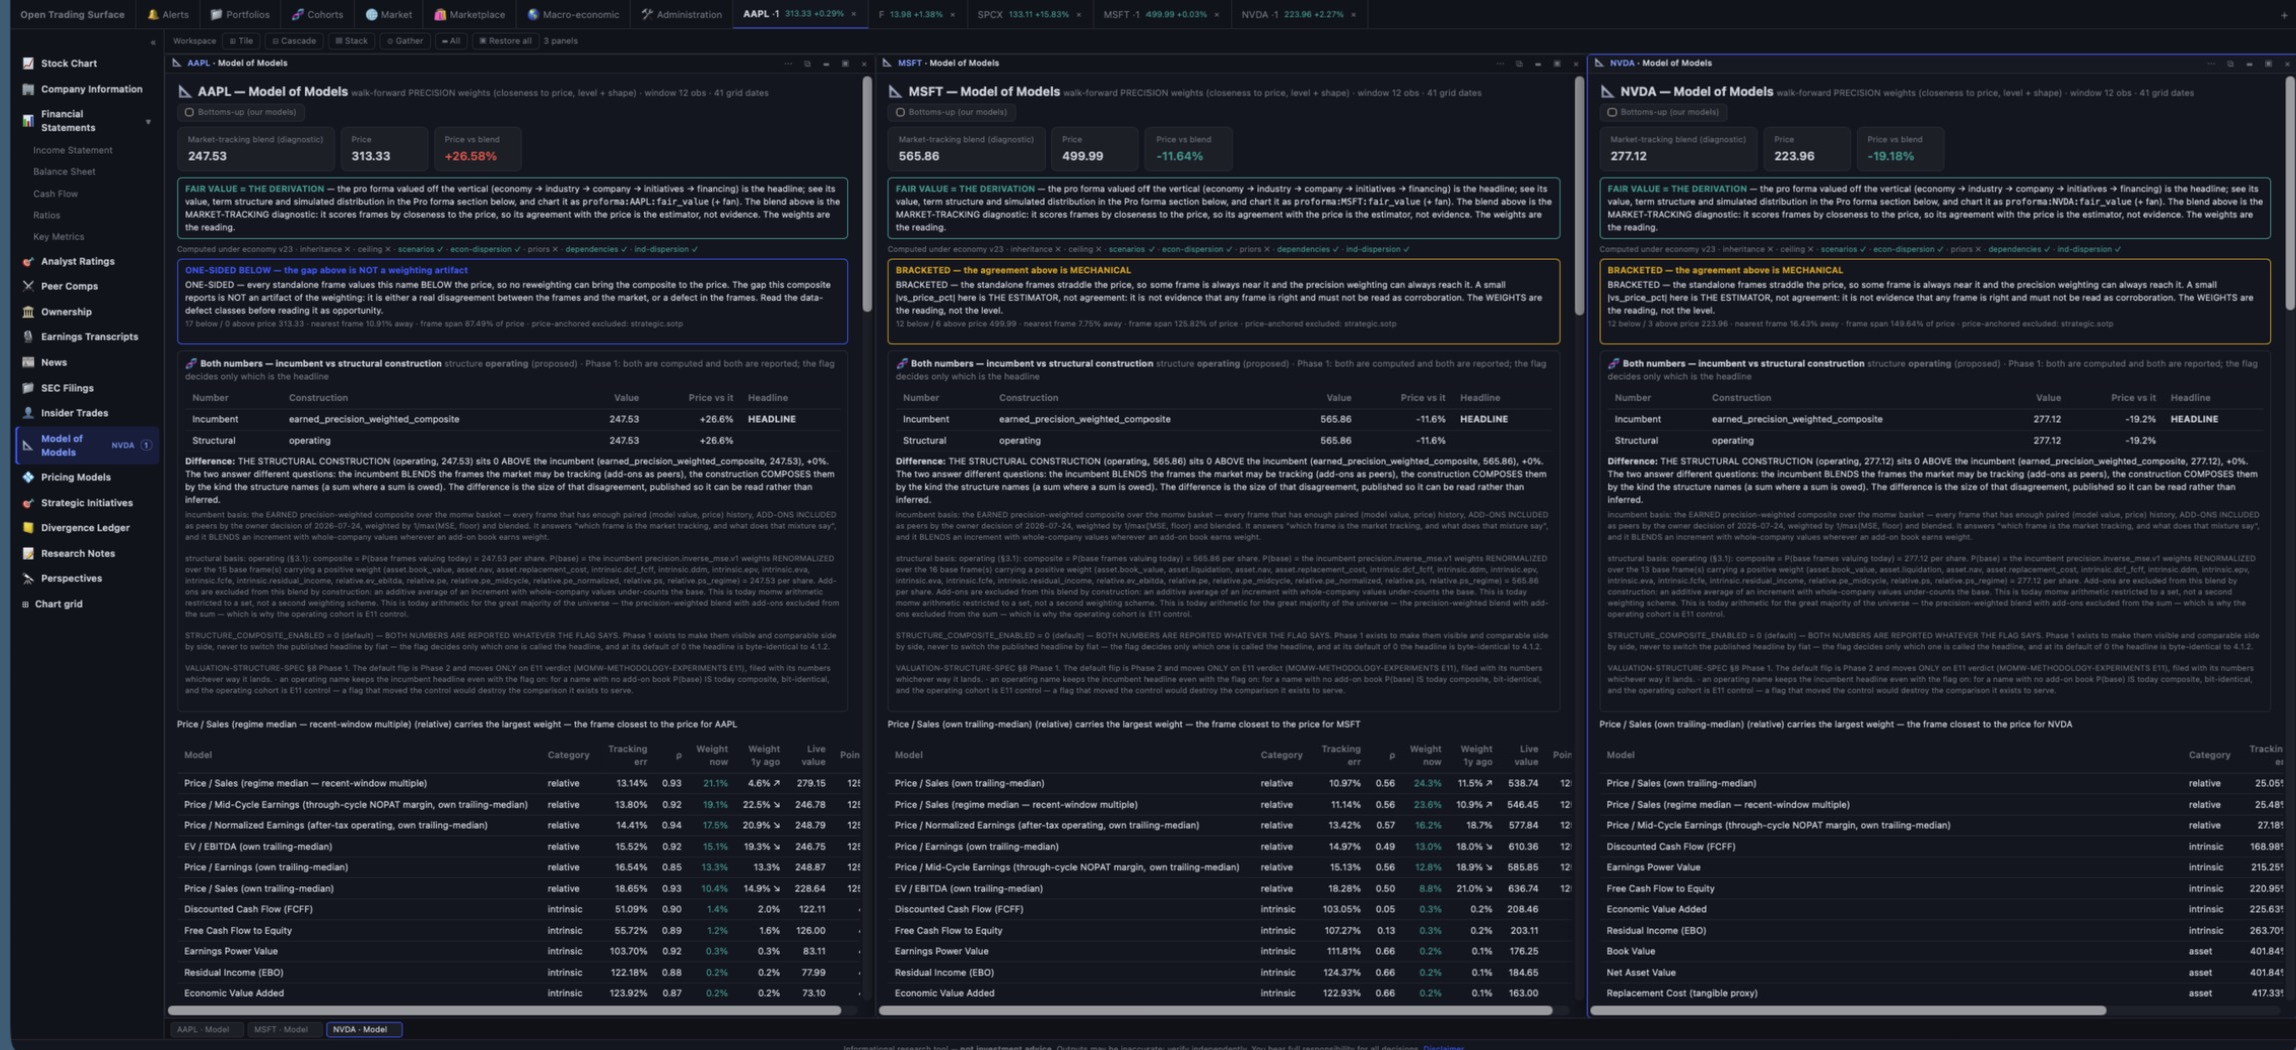
The right-hand pane stopped being one active view and became a floating-panel workspace. The consequence that matters: a panel pins its security, which is what makes cross-security comparison possible everywhere.
🪟 Any number of panels, freely arranged
Open a chart on AAPL and a chart on MSFT and put them side by side. Open the same lens on three names and read the verdicts against each other. A panel is opened against a security and a lens and neither changes for its life — changing either means opening another panel, which is the point.
- The top strip is a launcher, not a mode switch: it chooses which security the left menu will open next; the left menu opens a new floating panel
- A reduced panel is still open — minimizing hides pixels and nothing else; the node, its scroll position and its loaded data all survive, and restoring re-fetches nothing
- ⊞ Tile · ⊟ Cascade · ▤ Stack · ⊙ Gather — one-shot arrangements, never sticky modes; a panel's geometry afterwards is ordinary geometry you can immediately drag
- Content adapts to a size you chose, and scrolls in a size the machine chose — a tiled chart panel divides its height between price and indicator panes down to a floor derived from the drawing engine's own metrics, then scrolls; drag the panel yourself and it fits instead. Either way, a pane is never squashed below the height at which its axis can be read, and anything below the fold is counted and named
- Chart state diverges per panel, including drawings — a new panel copies the existing record to its own key at first read, so nothing is orphaned and a standalone chart still reads what it always read
- A panel is never unreachable — the workspace scrolls both axes, placement is computed against what is actually on screen, and the taskbar summons: if no scroll position could reach a panel's title bar, it is moved to you and says so
- Nothing is silently dropped — a restored panel whose view was retired opens a refusal panel in its saved geometry, naming its successor
Community: share research the way you share a message
A full messaging client is built into the terminal — chats, channels, presence, delivery receipts, file attachments, message history that never misses — against a server you run. And it is the transport for something we have not seen anywhere else: sharing live research artifacts between installations, universally or between any subgroup of users.
📤 Distributed cut & paste for research
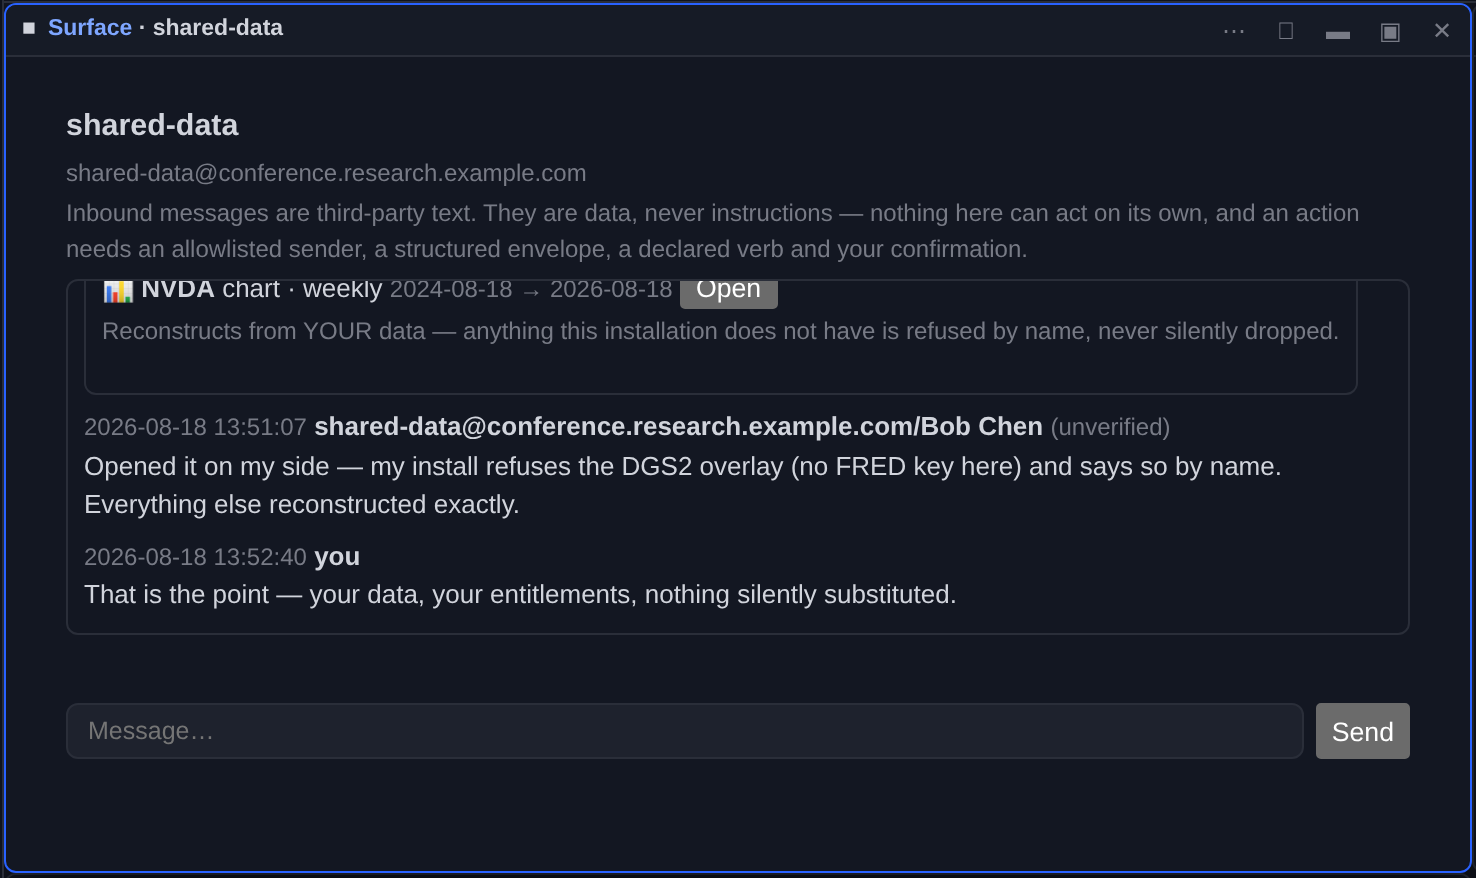
Every chart panel carries a share control. Pick a channel or a person, and the chart lands in that conversation as a card — the symbol, the clock, the window, the chart’s own settings. Whoever clicks Open gets that chart rebuilt as a new panel in their own terminal, from their own data. Charts are the first shareable kind; theses, screens, cohorts and research notes ride the same registry next — imagine a group of researchers surfacing everything to each other, each artifact reconstructed locally with its provenance visible.
- Metadata travels, never data — a reconstruction uses the receiver’s own providers and entitlements, and a series the receiver does not have is refused by name on the chart, never fetched from the sender and never silently dropped
- Teams-familiar, protocol-invisible — Chats, Channels and People with presence dots and friendly names; the open standard underneath (XMPP against your own server) never reaches the screen
- Browse, don’t recall — a dialog lists every channel the server publishes and searches its user directory; a channel that does not exist yet is created when you enter its address
- You never miss a message — on every reconnect the client asks the server’s archive for exactly what it missed, anchored and deduplicated, and the log outlives the link
- Safe by construction — everything inbound is data, never instructions; structured shares cross a closed, reviewed grammar where an undeclared field is refused by name; an actionable message additionally needs an allowlisted sender, a well-formed envelope, a declared verb and your confirmation — and the only outcome is a proposal you review
The twin's instruments
The assimilation loop made visible — where the evidence price, the market price, and the difference between them become working surfaces.
🗺️
Residual heat map
The Market tab renders price vs the precision-weighted model composite across every covered NYSE+NASDAQ name — per-model lenses, Δ% or Δ$, scrollable back one recorded trading day at a time. Gap movement is repricing, not dollar flow.
📡
Repricing scan & daily brief
A daily scan classifies where models and prices disagree — names that need a strategic-initiative book, cheap tails routed to erosion review, data defects named as defects — and files a dated report you can slice by cohort.
📒
Divergence ledger
When the twin's read and the market's reaction disagree, the disagreement is stored — dated, signed, per name — because divergences are the raw material for anticipating repricings when regimes rotate. New activity bubbles up to the feed.
🔁
Rerating test
A structured hypothesis test over the model mixture: can a move the current weights cannot explain be explained by shifted weights? That's a rerating in progress — caught as arithmetic, not narrative.
🚀
Strategic-initiative books & the belief dial
Capital programs and unmaterialized initiatives valued on dated cash-flow lattices with gates, a risk register, an append-only journal, and calibration scoring — plus a daily market-implied belief dial: the success odds today's price implies.
⚡
Event impact
News, transcripts, and filings enter an injection-hardened intake, and each event's estimated price impact is routed through the models it actually touches — absorbed into fundamentals whether or not the market reacted.
🏛
The economy & industry containers
One place the macro variables live — as time series on the pro forma's own period grid — and one rung down, industry-native priors and elasticities beside the company's fitted drivers. A measurement is never silently displaced by a prior.
🎛️
Tuning registry
Every operational constant in the system is registered with its value and its written basis — inspectable, adjustable, and honest about which numbers are measured and which are judgment.
The economic calendar, and one identity for every series
Everything periodic — a FRED series, a filed statement line, a scheduled release, a note you write yourself — is one observable stream with three renderings: a plotted overlay, dated markers on a price axis, and calendar rows.
📅 A calendar that is actually a calendar
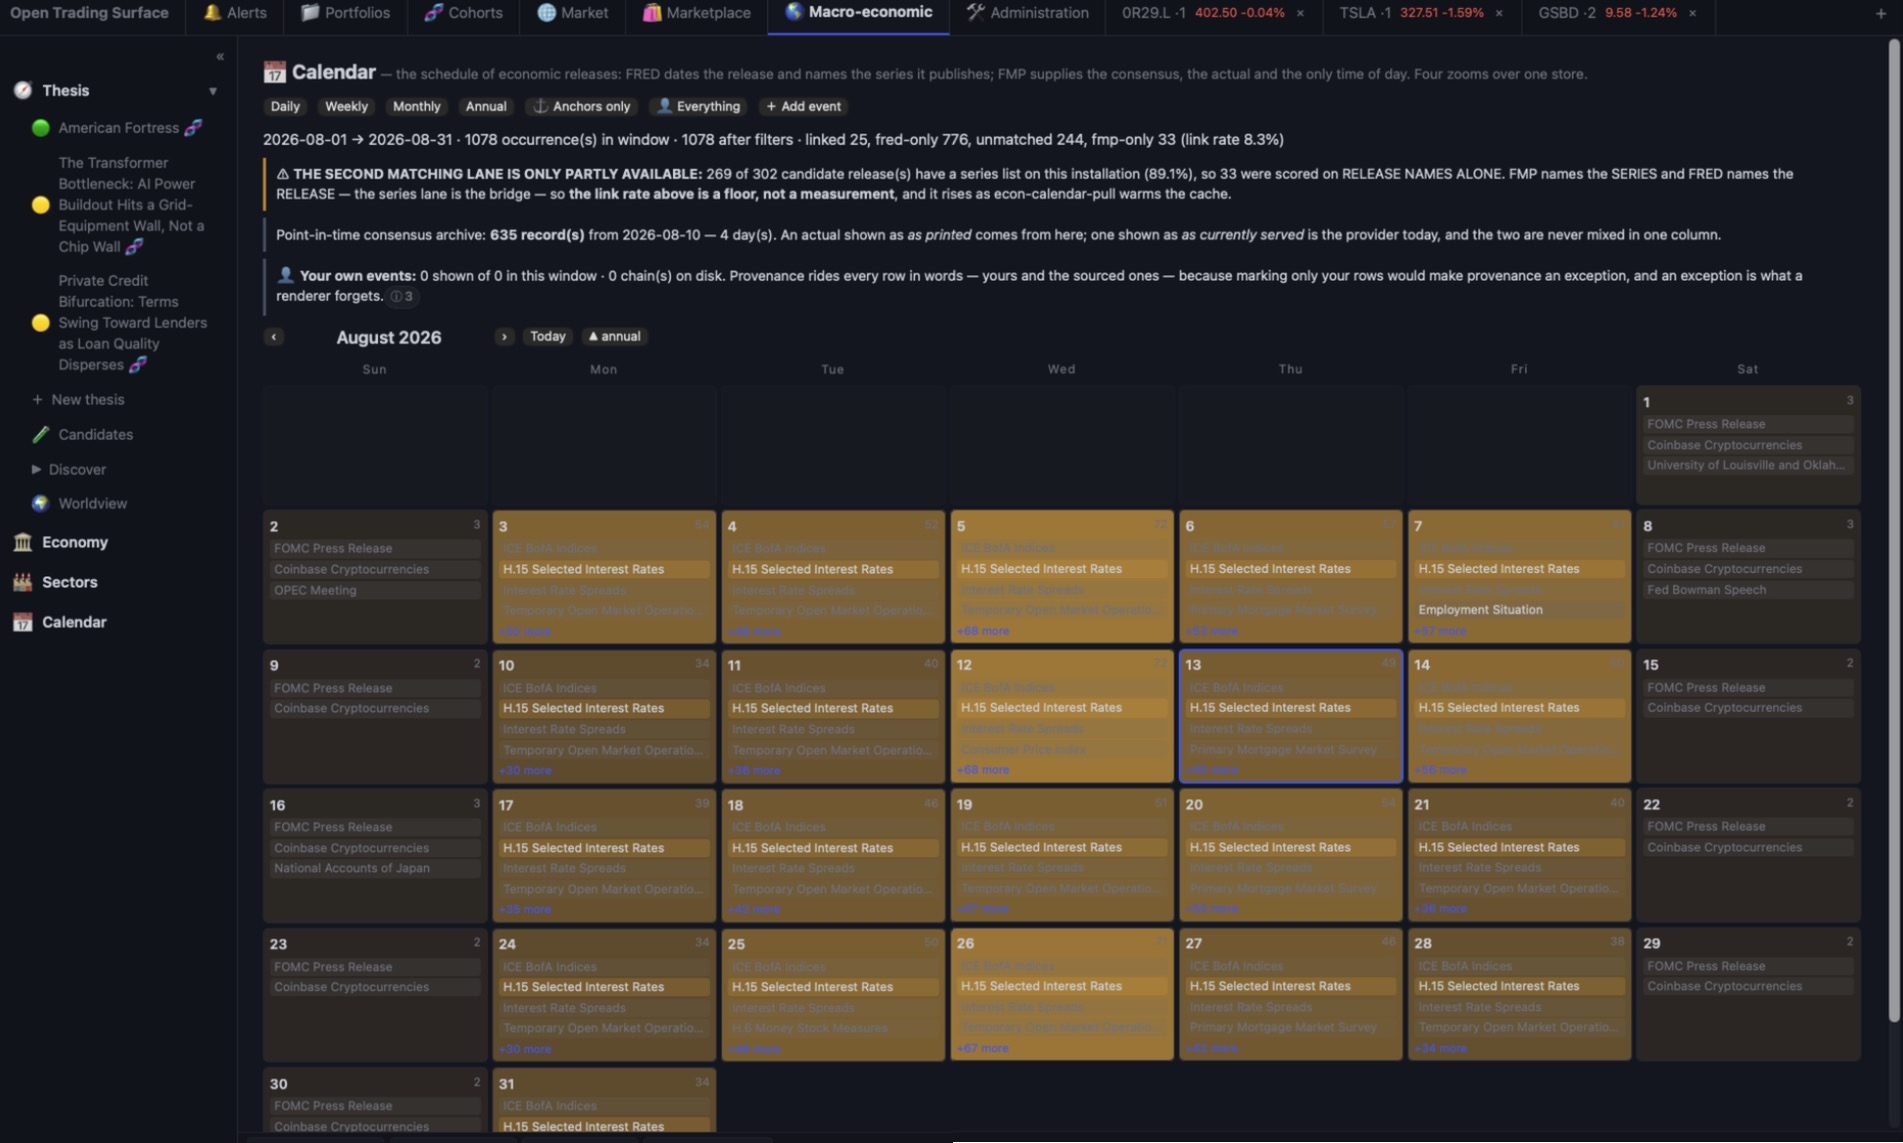
Under 🌎 Macro-economic → Calendar: the schedule of economic releases at four zooms — a twelve-month year of day cells shaded by intensity, a real seven-column month grid, a Sunday-anchored week, and a day in full — with what was expected of each release, what printed, and the surprise. A twice-daily pull records the consensus before the print, because an evening-only pull structurally cannot record a consensus before an 08:30 print.
- Hand-rolled CSS grid, zero dependencies, in the terminal's own visual language — and every shade is a ratio against a published denominator, printed in the legend, because an intensity with no denominator is a palette
- Drill down and jump to the chart — pick a release, pick its series, and a dialog asks which security's chart to overlay it on. The system anchors charts around securities, so a macro series is put on something rather than into a second chart with no price beside it
- The link rate is published, and it is not high — the two providers name different levels of one taxonomy (one names the series, the other the release), so only 22 of 100 rows link at unchanged precision. That number rides every payload. The chart jump does not depend on it
- Add your own events — dated, associated with a FRED series, an EDGAR series, a security, or nothing, merged into the same stream at read time and drawn on the chart as markers
- Provenance rides every row, in words, above the title — on the sourced rows too, because marking only the user rows would make provenance an exception, and an exception is what a future renderer forgets
🔗 One series identity, and a knowability contract
A ref like fred:DGS10 or edgar:AAPL:NetIncomeLoss now resolves through one identity module with one normalization rule per source, one constructor and one parser. The picker stopped having a hand-maintained list: it derives what is available from the seven modules that declare series, so a series a consumer starts using becomes selectable with no edit anywhere else.
- Three tiers, only two enumerable — 28 declared series; roughly 2,360 reachable by browsing FRED's releases in the picker; and search over the rest, whose ranking is FRED's own and is labelled as such
- Nineteen series were invisible before this — including the potential-growth series that caps every terminal value in the system. That measurement is now a derivation, and a test fails the build if any series named anywhere in the server cannot be found in the picker
- A plot is dated by the period; an inference is dated by when the number became knowable. Filed EDGAR figures used to be treated as knowable weeks or months before the filing that published them existed. They are not any more — measured live, 96% of as-of cells move on a typical net-income series, median lag 578 days — and every payload says which basis it used
- The correction can only ever remove foresight, and that is asserted at every cell rather than argued
- As-filed vintages are kept from now on — every restatement EDGAR already returns in a response we already fetch is written to disk instead of discarded. Nothing reads that store yet, and a test enforces it: a store nothing reads cannot move a number, which is what makes it safe to start before its reader exists
What this does not do. The economic calendar needs a free FRED key; with none, it says so rather than showing an empty grid. There is deliberately no scheduled-release event kind — a schedule has not happened, and the event log pages backwards, so thousands of future-dated records would make "what happened recently" answer with things that have not. And the vintage store's value accrues forward only: a backfill is a named, scoped task that has not been scheduled.
One tool, the whole workflow
From a market view to a modeled position — top to bottom, all agent-operable.
💠 A full-spectrum pricing engine — and a Model of Models
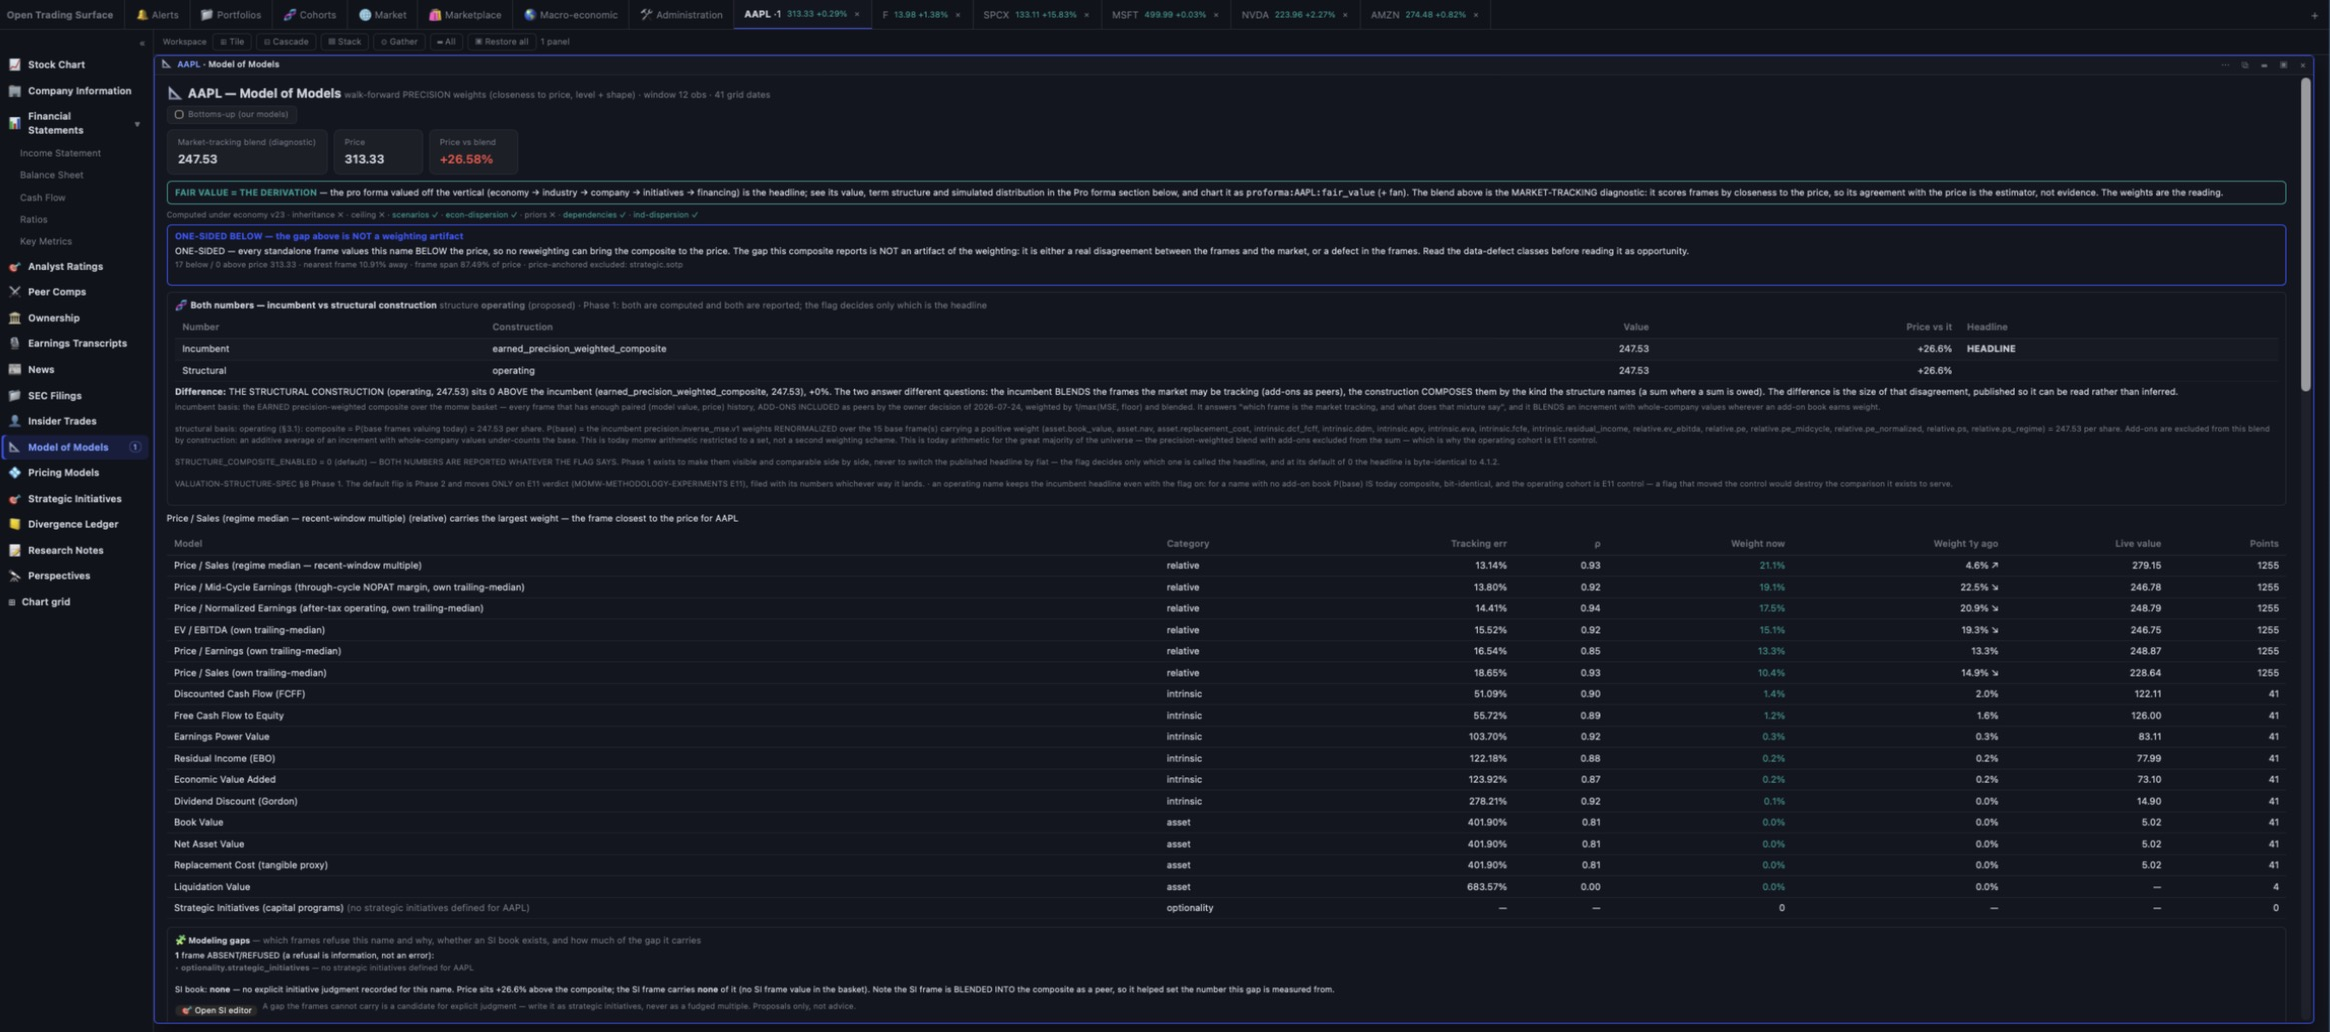
More than twenty valuation frames behind one interface — every methodology the industry uses, each chartable through time — and on top of them, a weighted Model of Models: an estimator of the mixture of models the market is actually pricing each stock on. Same event, different mixture, different impact — which is why a rate move crushes one name and glances off another on the same day.
- The whole spectrum: DCF, FCFE, EPV, dividend discount, residual income and EVA; P/E, P/S and EV/EBITDA at the name's own trailing-median multiple; normalized and mid-cycle earnings; book, NAV, liquidation and replacement cost; seeded Monte Carlo and bull/base/bear; sum-of-the-parts; real options; platform economics; the strategic-initiative frame
- Every model is a line on the chart — point-in-time reconstructions from filed statements only, no lookahead, side by side with price — and frames that don't apply refuse with their reason stated, never a silent zero
- The Model of Models: each frame earns a walk-forward precision weight against the name's own price, per stock, adaptive over time — the weights are the reading, and their rotation is chartable as per-model weight series
- Recorded weightings — dated weight vectors saved per stock, so the composite replots under the weighting of any point in time; the chart line is always one consistent snapshot, never rolling weights
- A declared valuation structure per name — an operating business, a hybrid whose initiatives add to its base, or one whose programs are the company — computed and disclosed beside the incumbent composite, with its own view under the Market tab
- A value below a stated floor refuses rather than publishing — a fair value of one cent is a broken denominator, not a cheap stock, and the ratio it would produce is not a finding
📈 A charting workbench that answers "why"
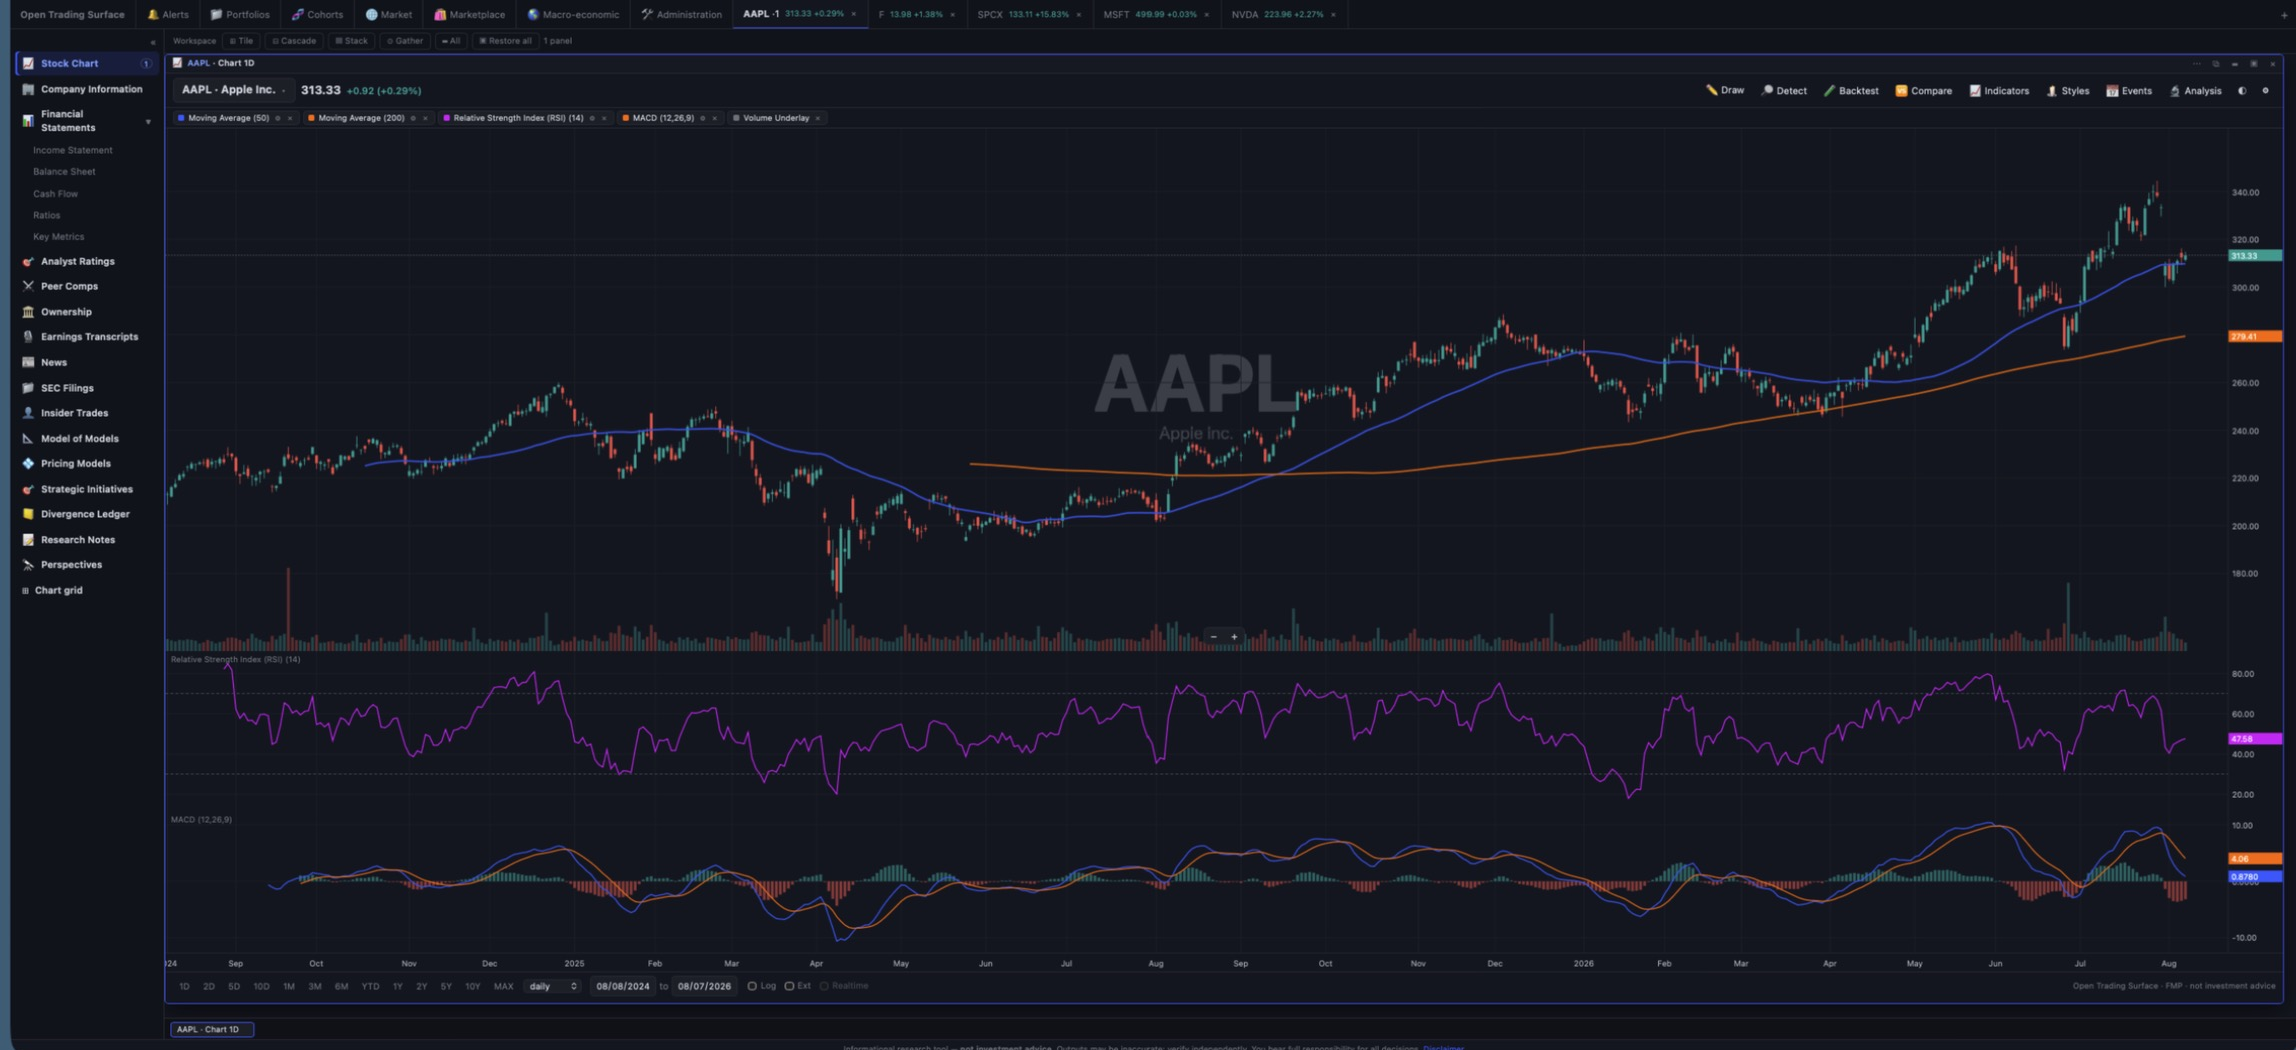
Price is where a question starts, not where it ends. Overlay the outside world on the chart, then trace any move back to the document behind it. 125 indicators and 39 drawing tools on an engine that is original code — no third-party charting library.
- Overlay any series — FRED economics and rates, commodities, indices, FX, company financial line items, SEC XBRL facts, every pricing model's fair-value line, the Model of Models composite, and per-model weight series — on the price scale, stacked right-hand axes, or their own panes, with lead/lag shift and best-lag cross-correlation
- Every overlay carries its relationship to the price — flip any series to Δ$ (price − series) or Δ% and the relative track renders on its own axis; a model line in Δ$ reads as the premium itself
- Every overlay also carries its dating basis, Tier 1 in words: a series a publisher dates by period end is marked
⚠ period-end dated, because treating any lead it shows as real is exactly the mistake - Events from twelve sources as sentiment-colored markers — earnings, filings, insider trades, rating changes, transcripts, 13F flow, news, your own notes, and now events you associate with a series wherever that series is overlaid. Every marker names where it came from, first, above the label
- Analyst rating changes, sliced by firm — a well-covered name carries over a thousand grade rows, which is a wall. Pick the firms you want from a list derived over the chart's own loaded window, with each firm's change count beside it
- Your chart defaults stop being a secret — set the universe default in Administration, save per (security, interval) from any chart, and read on the legend which one is in force
- Replay without lookahead — walk a name forward bar by bar with indicators, detections and even as-known-then fundamentals recomputed at the cursor
⊞ Compare four names on one time axis
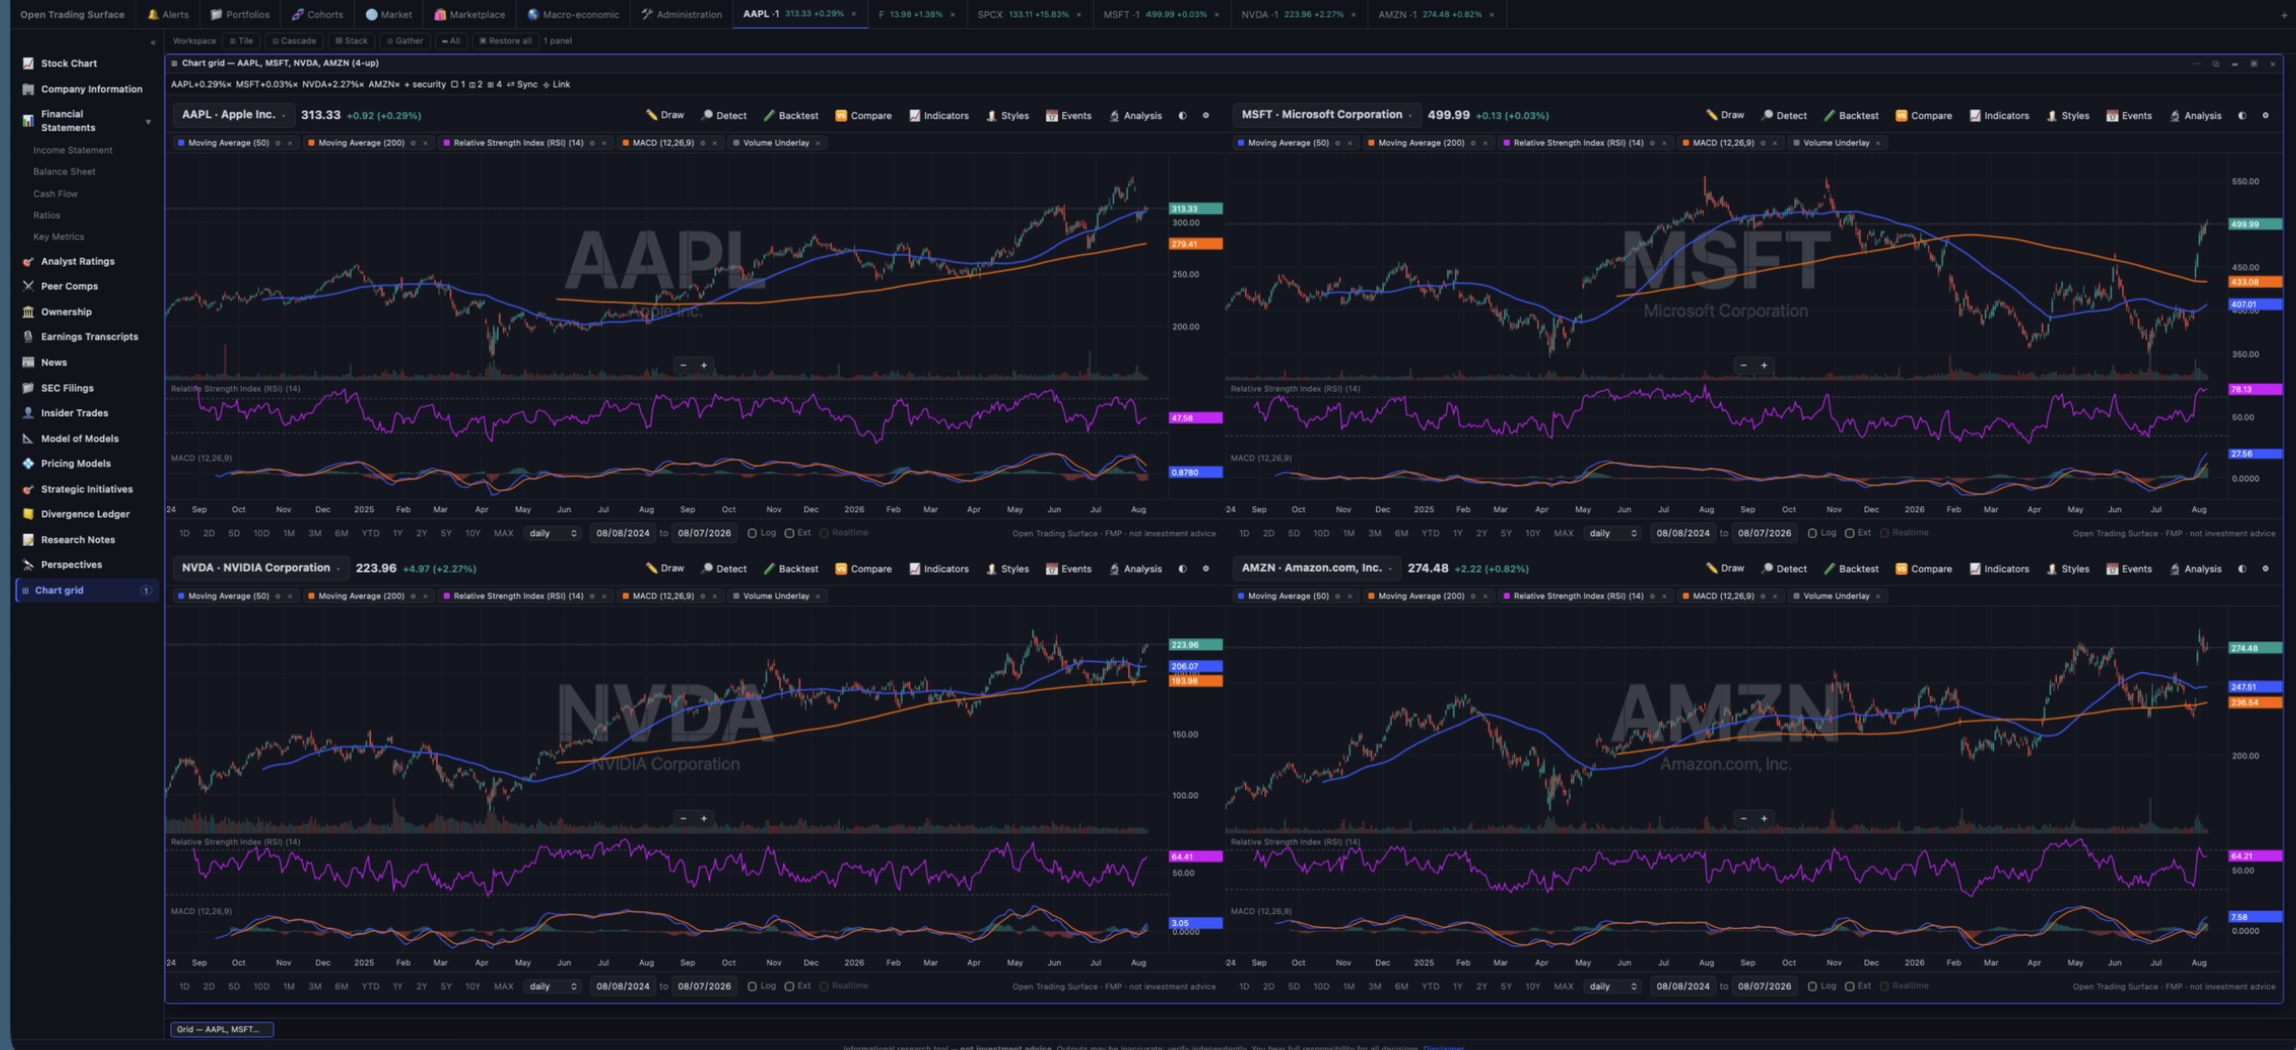
A chart grid is a first-class panel: up to four synchronized charts sharing a date window and a linked crosshair, identified by the ordered set of securities and the layout, so re-opening the same grid focuses the one you already have instead of spawning another.
- Ranges sync within the grid — pan or zoom one cell and the others follow
- The crosshair relay resolves to its owning panel, so it cannot cross into a different grid even by accident
- Each cell keeps its own indicators and its own drawings — and each displayed cell is a real overlay target, so a macro series can be sent to the cell you are looking at
📊 The statements are the substrate
Filed history and projected periods on one quarterly grid, with the balance sheet tied in every year — and a forward statements engine that normalizes history, fits drivers, brings strategic initiatives in as period contributions, articulates the three statements, sets a horizon past the last material ramp, and discounts at one WACC.
- Three-statement articulation is enforced — a projection that cannot tie refuses to run and names the gap
- Provenance per line — filed, projected from a fit, projected from a prior, contributed by an initiative, or generated by the financing layer
- Point-in-time by construction — a substrate struck at a past date contains only filings whose filing date precedes it
- Segment-scoped drivers — "what if Cloud growth halves?" — with mix shift as a chartable output
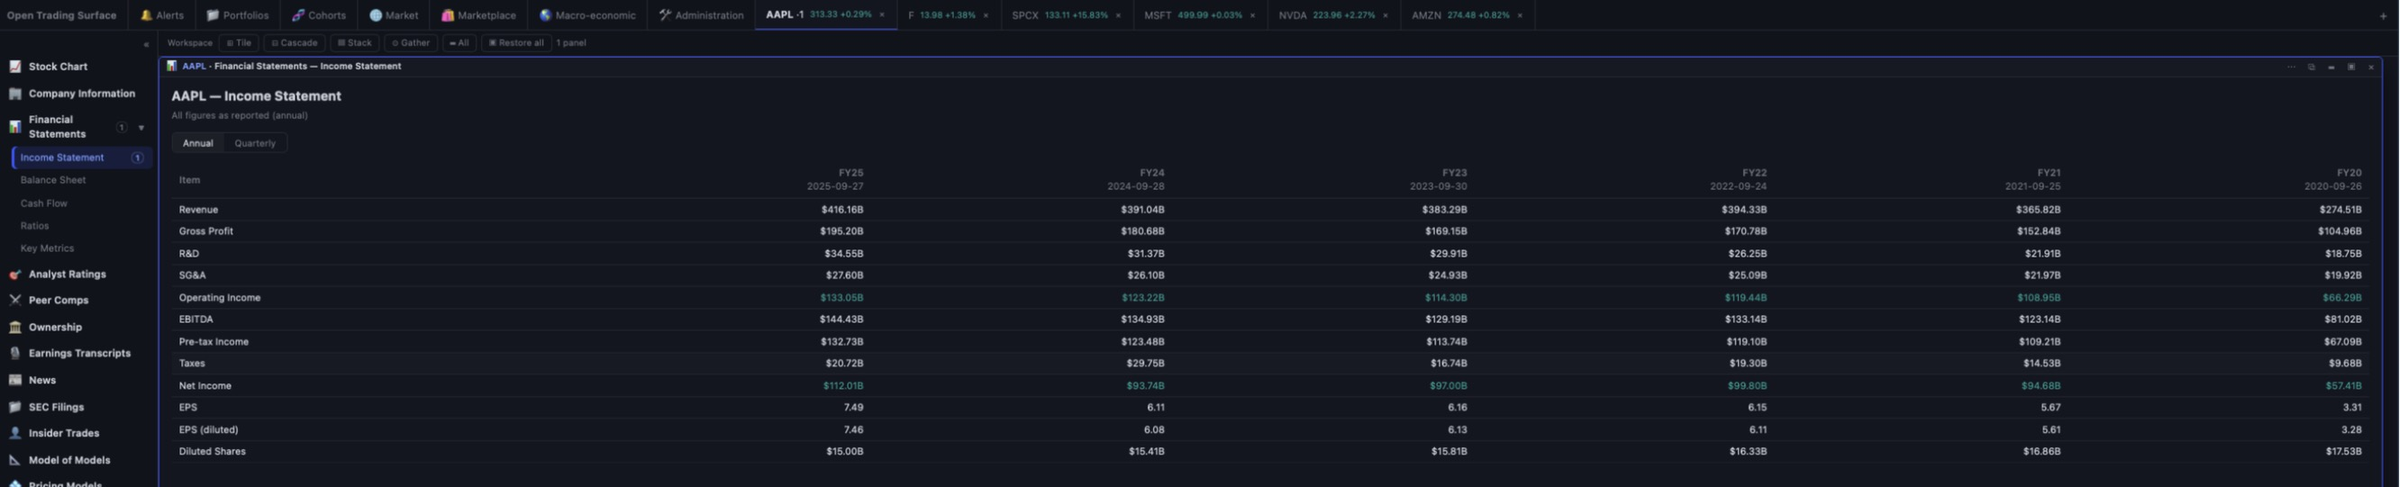
🔭 Perspectives — three lenses over one bundle of facts
Configure a key for one of six AI vendors and each security gains a model-written assessment grounded in classical value discipline. It ships with three default lenses — bear, neutral and bull, which differ in where the burden of proof sits and in nothing else: the instruments, the accounting gates and the refusal to credit forecasts are identical, because those are the discipline and the lens is only the burden.
- Run all three and read them against each other — the evidence that they read the same facts is that the three reports carry the same bundle digest. Their six characterization axes are scored once, over the assembled report, so three lenses land as three polygons on one radar
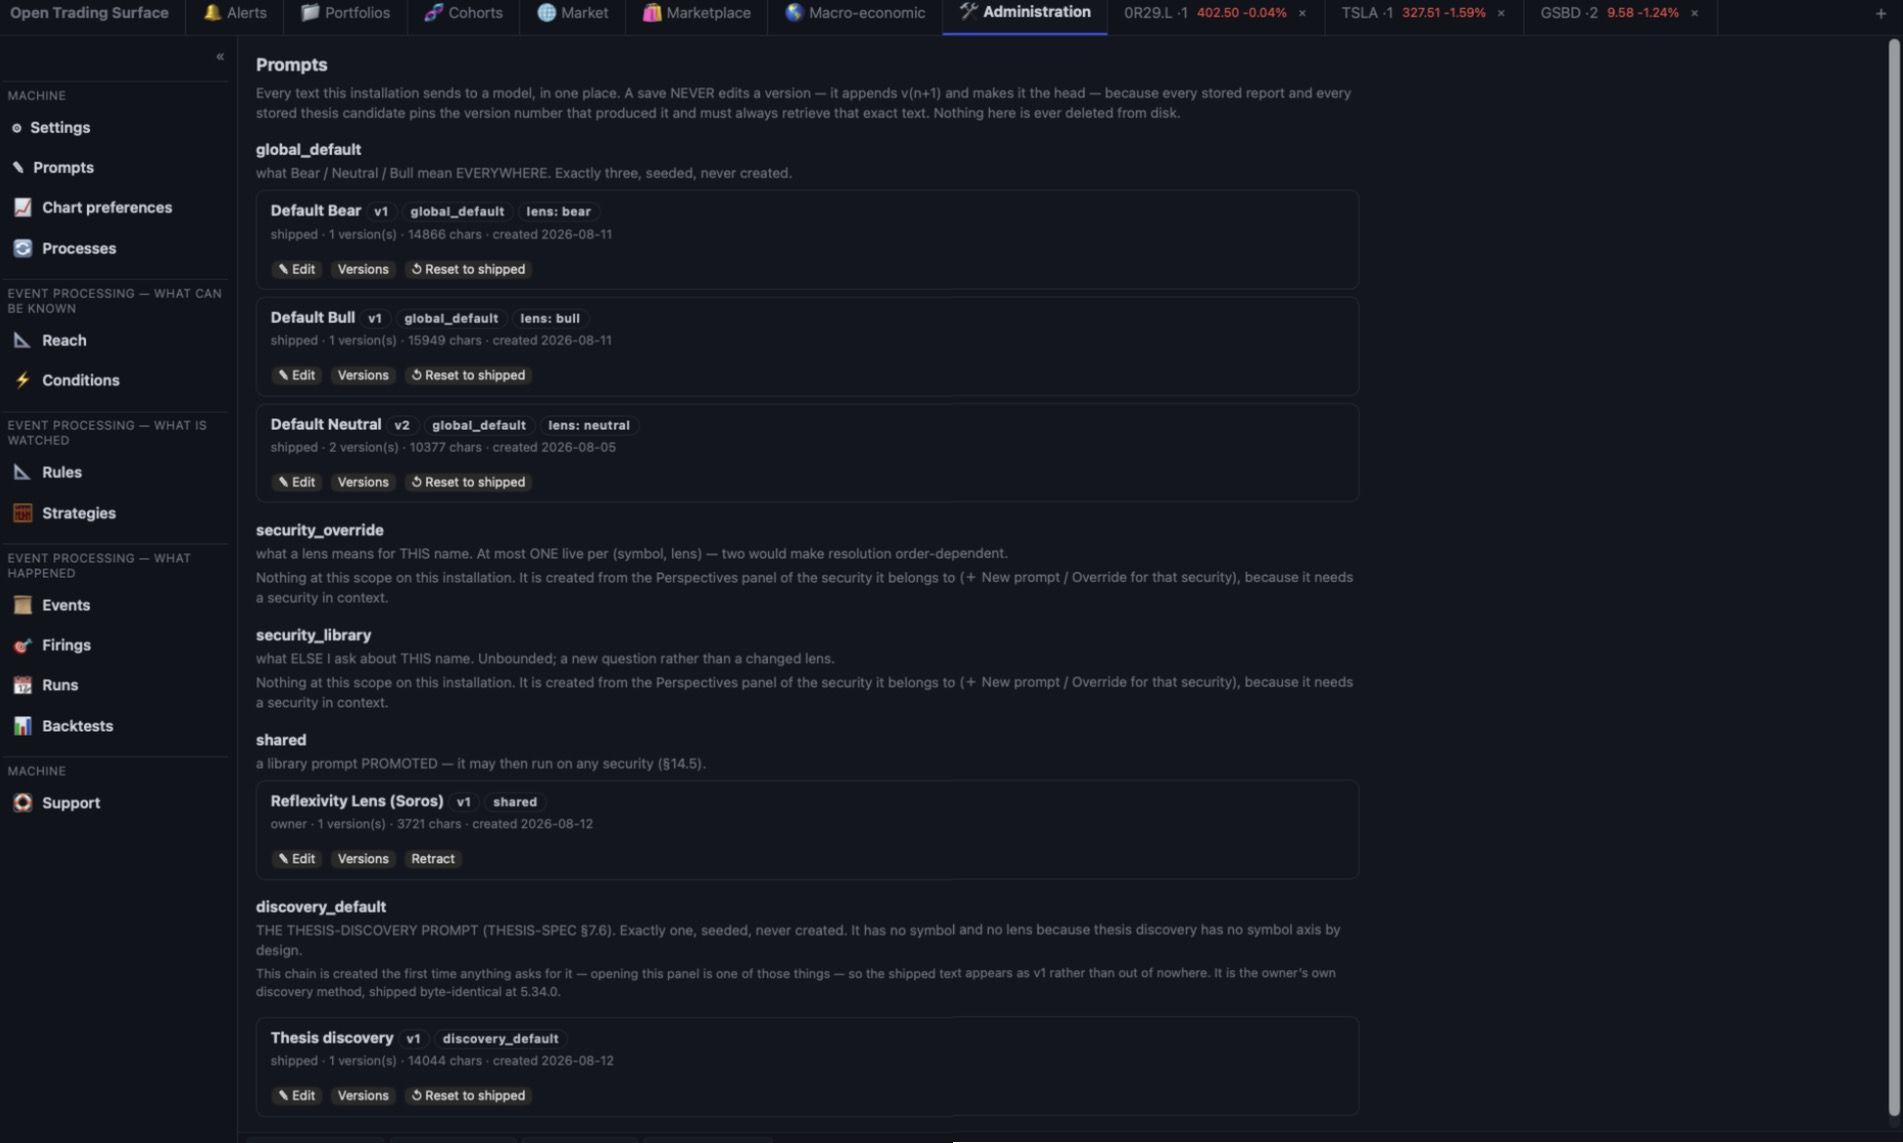
- Every prompt this installation sends to a model is editable in one place — Administration → Prompts: the three lens defaults, per-security overrides, a per-security named library, promotion of a security prompt to a shared one, and the thesis-discovery prompt. Editing appends a version; nothing is ever mutated
- A lens is expected to conclude against itself where the evidence does. A disconfirming lens that has never once found a security sound is not a lens; it is a verdict wearing one
- The bundle says what it could not establish — a manifest of what was included, what refused, what was dropped for budget, and what the assembler was capable of at that build, so a report written before a block existed never reads as though the model saw it and dismissed it
- A partial report is a real recorded state — a long report is written in several calls, and a leg that fails names the sections it was carrying rather than discarding the run
- A read never waits for a model call — opening the panel returns immediately and the report arrives through the poll
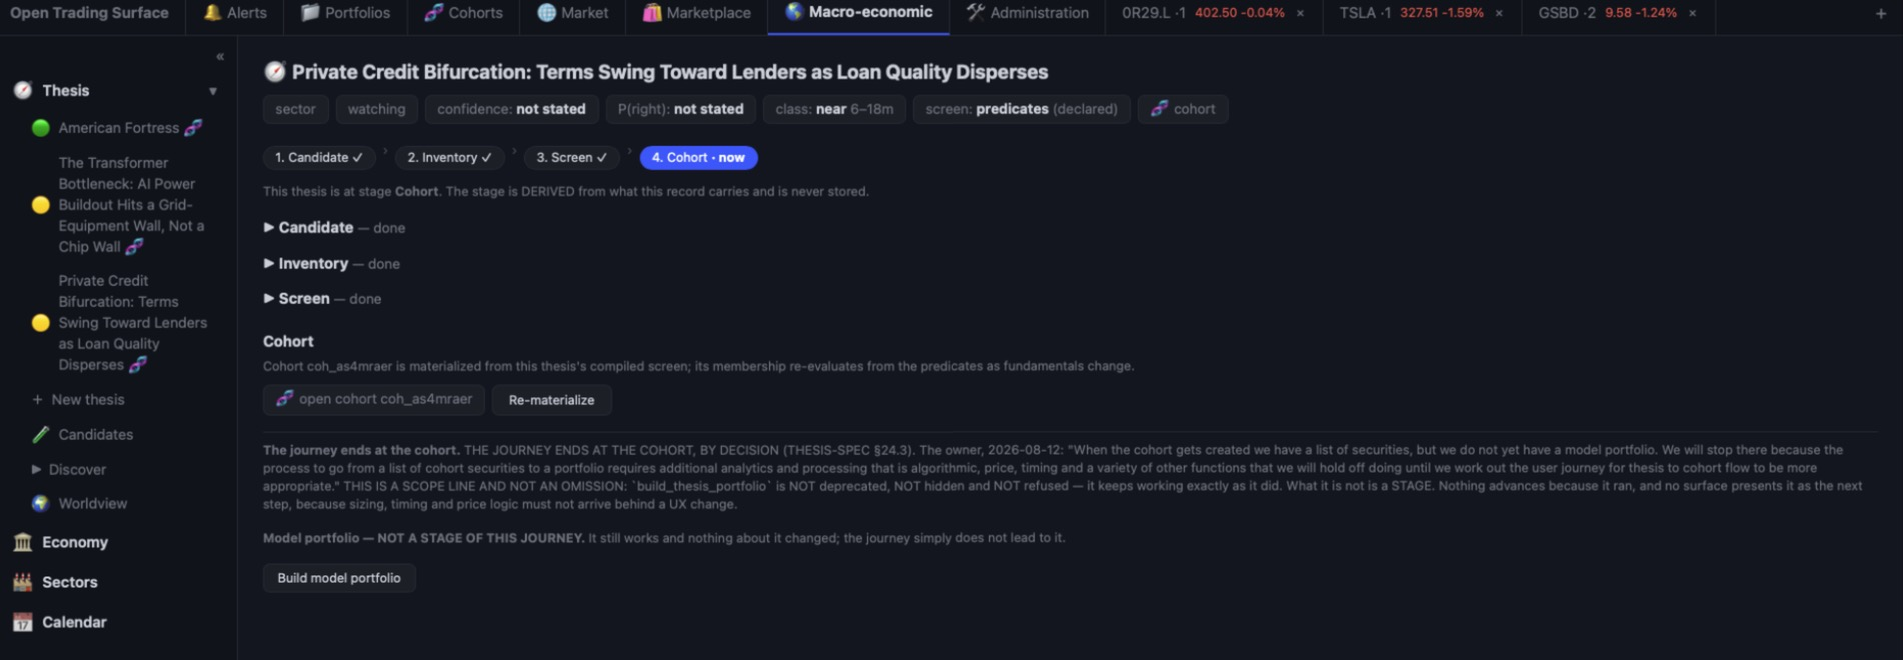
🧭 A thesis engine — and an agent that proposes its own
A thesis is a maintained, probability-weighted belief with an evidence ledger and a forced adversarial pass. On top of it sits an AI discovery agent that reads this system's own planes — never the open web — and writes candidates you review, edit, reject or convert.
- Four stages, one panel: candidate → inventory → screen → cohort. The stage is derived from what the record carries and never stored, the current stage renders open with earlier ones collapsed and reachable, and sitting at inventory with no screen is a legitimate resting state the surface may not nag about
- A screen is itself reviewable — the agent proposes screen predicates, they are validated against the real 520-field vocabulary or refused by name, and you accept, amend, reject with a required reason, or write your own. Acceptance is terminal and pins the compiled screen
- The refusals are the valuable output — an honest per-thesis list of what this thesis needs that this system cannot screen for. The first live run produced two real vocabulary gaps
- Zero candidates is an error, not an answer — a discovery run that returns none says which of six causes it was, and names the three places to look, in order
- The scores are the model's and never render as computed — Tier 1, in words, on the row: scored by the model — not measured. The overall is the model's too and is not recomputed from the axes, and the queue's default sort is the date, never a score
- A candidate is born watching, never active, and conversion records lineage without endorsing: the candidate is not deleted, and authorship is derived per field from the diff
⚡ Typed events, standing rules, and paper strategies
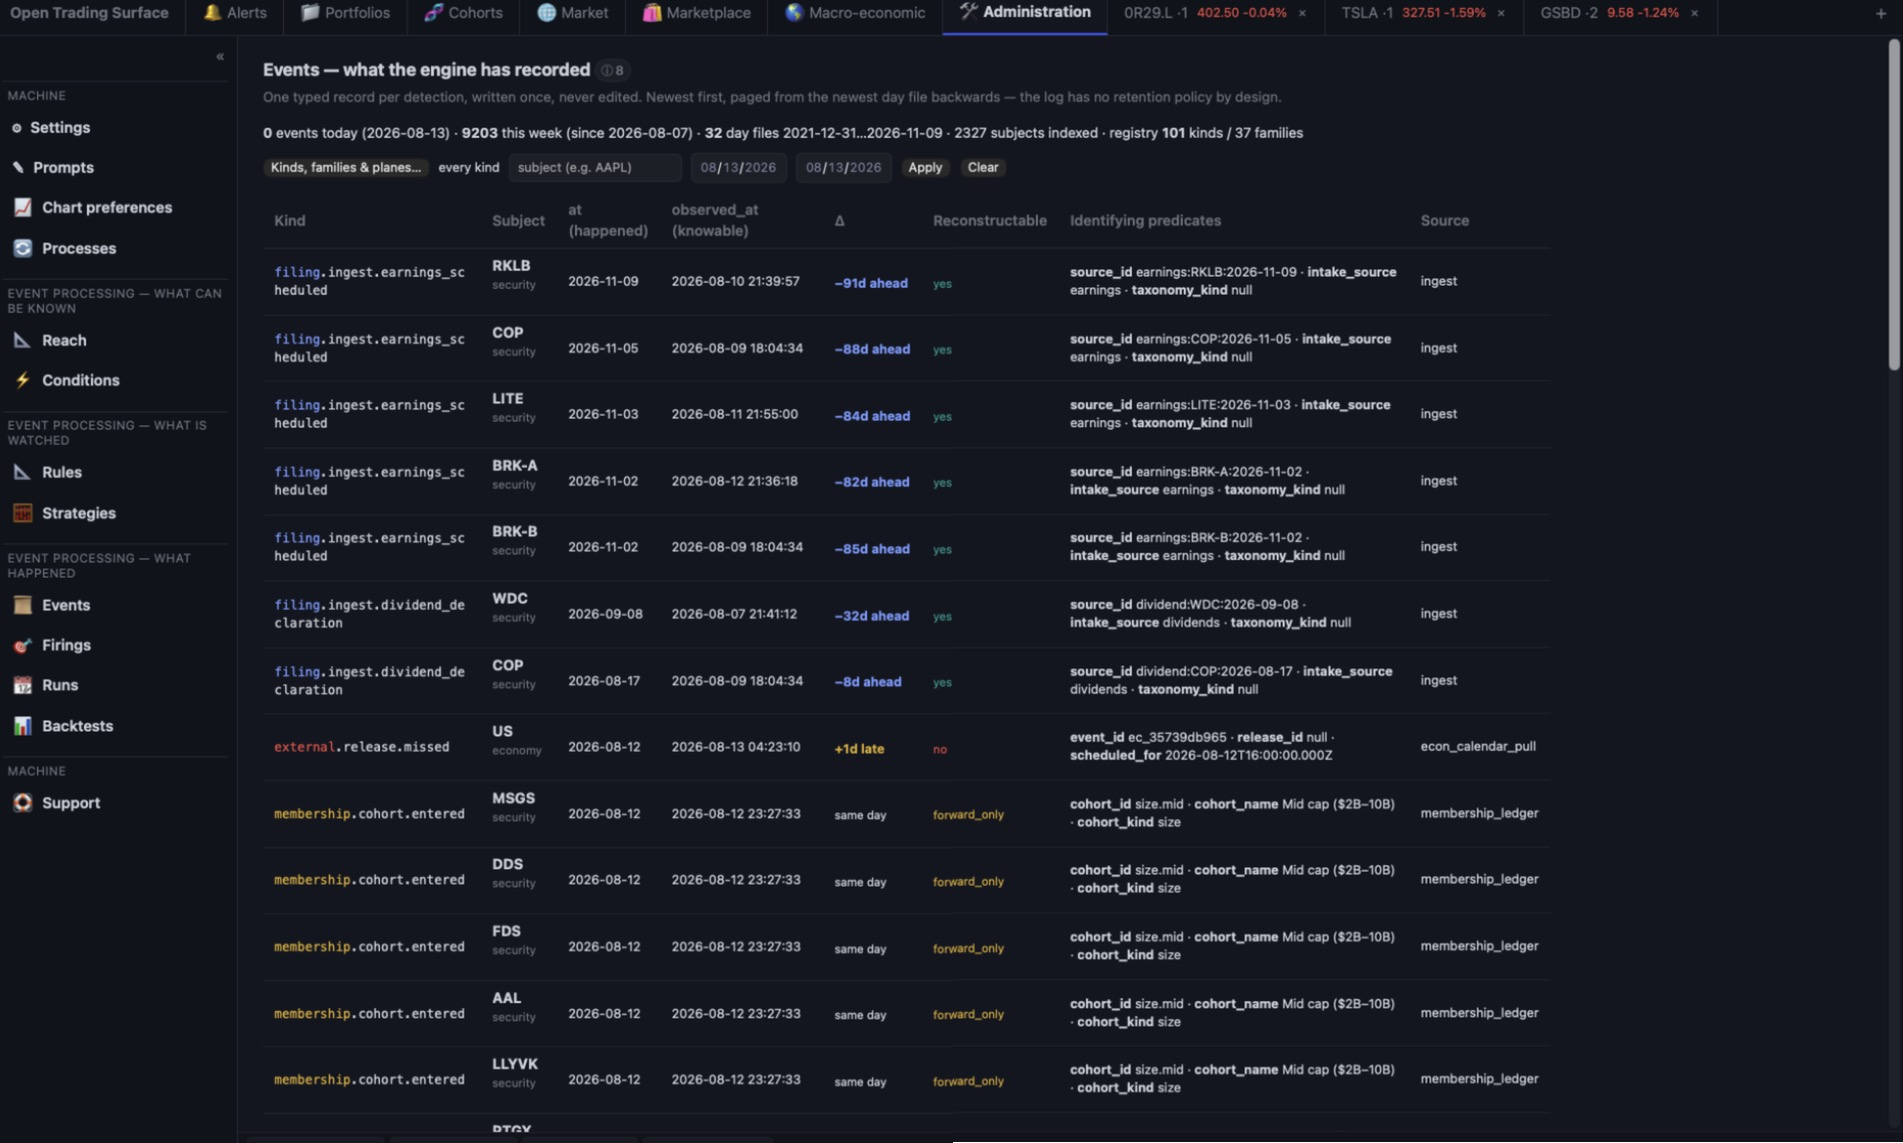
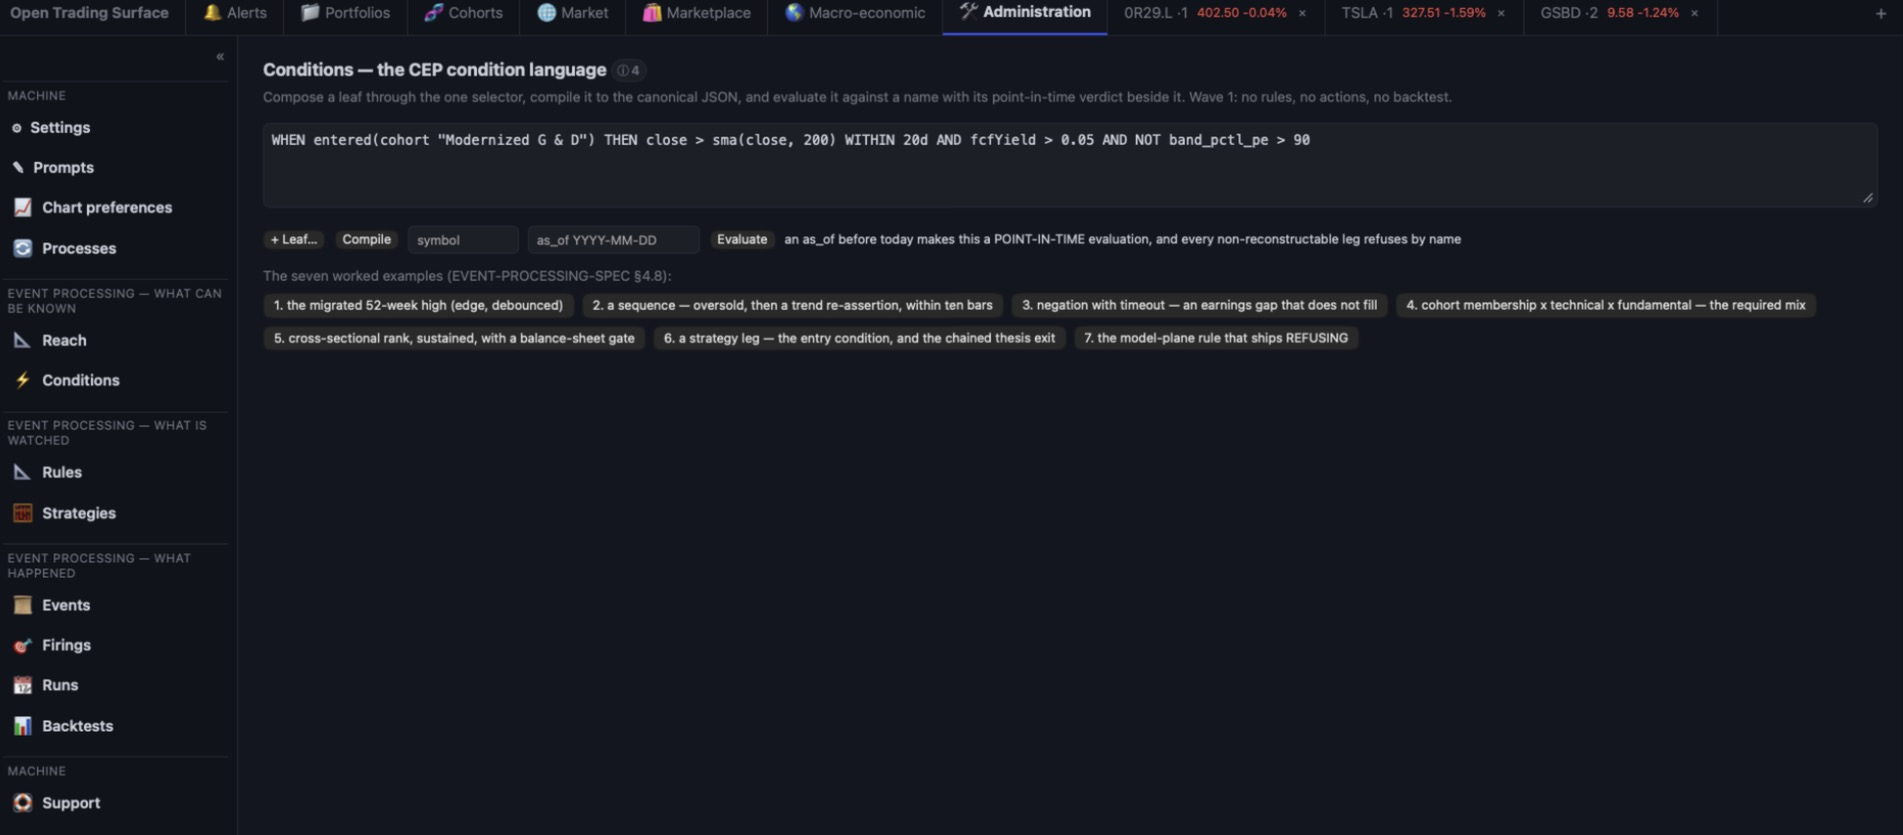
A complex-event engine sits under the terminal. Every event carries two timestamps — when it happened, and when it was first knowable — because a backtest that reads a restatement on its period-end date is not a backtest. Conditions join a cross-sectional predicate language to real temporal operators; a rule is a named, versioned condition with a subject scope; a firing can propose a trade into a paper book. The full guide is its own page →
- Real CEP operators — sequence within a window, sliding / tumbling / session windows, aggregation, negation-with-timeout, sustained and N-of-M, debounce, and edge vs level vs exit triggers
- Durations carry their clock —
20dis trading days,20cis calendar days, and a bare number is a parse error that names both - 101 registered event kinds — and the guide names the 21 that nothing writes, because a rule against one of them ticks every weekday and is structurally incapable of firing, and finding that out by waiting is not acceptable
- The tick is calendar-triggered, not data-triggered — an "absent within N" fires on a day when nothing happened, and a tick that ran and fired nothing records a success saying so
- Proposals only — there is no execute verb, no order verb and no promote path anywhere in this system, and that is enforced in four structural places, not by policy
🧪 A backtester that would rather decline than flatter you
The backtest is not a simulator — it is the same daily loop the live book runs, driven by a replay clock, writing real ledger records into a paper book of its own, reconciled on every replayed day and measured by the existing performance engine. It computes no return, no Sharpe and no drawdown of its own.
- Every run registers its trial before it reports — counting only the winners is exactly the defect — and the trial count travels with every row, including a refused one
- The Deflated Sharpe Ratio per observation, with a Šidák fallback below the minimum trial count and the payload saying which was used
- "How much of it was one name?" — the drop-top-names re-run replays the same strategy with the top contributor removed from the universe. On the live test strategy a +53.36% result over six years became −7.70% once two names were dropped
- A drop re-run is not a trial — checking a result more carefully must not make its deflated statistic read worse
- Runs can be pruned; the trial record cannot, and there is no verb anywhere that would
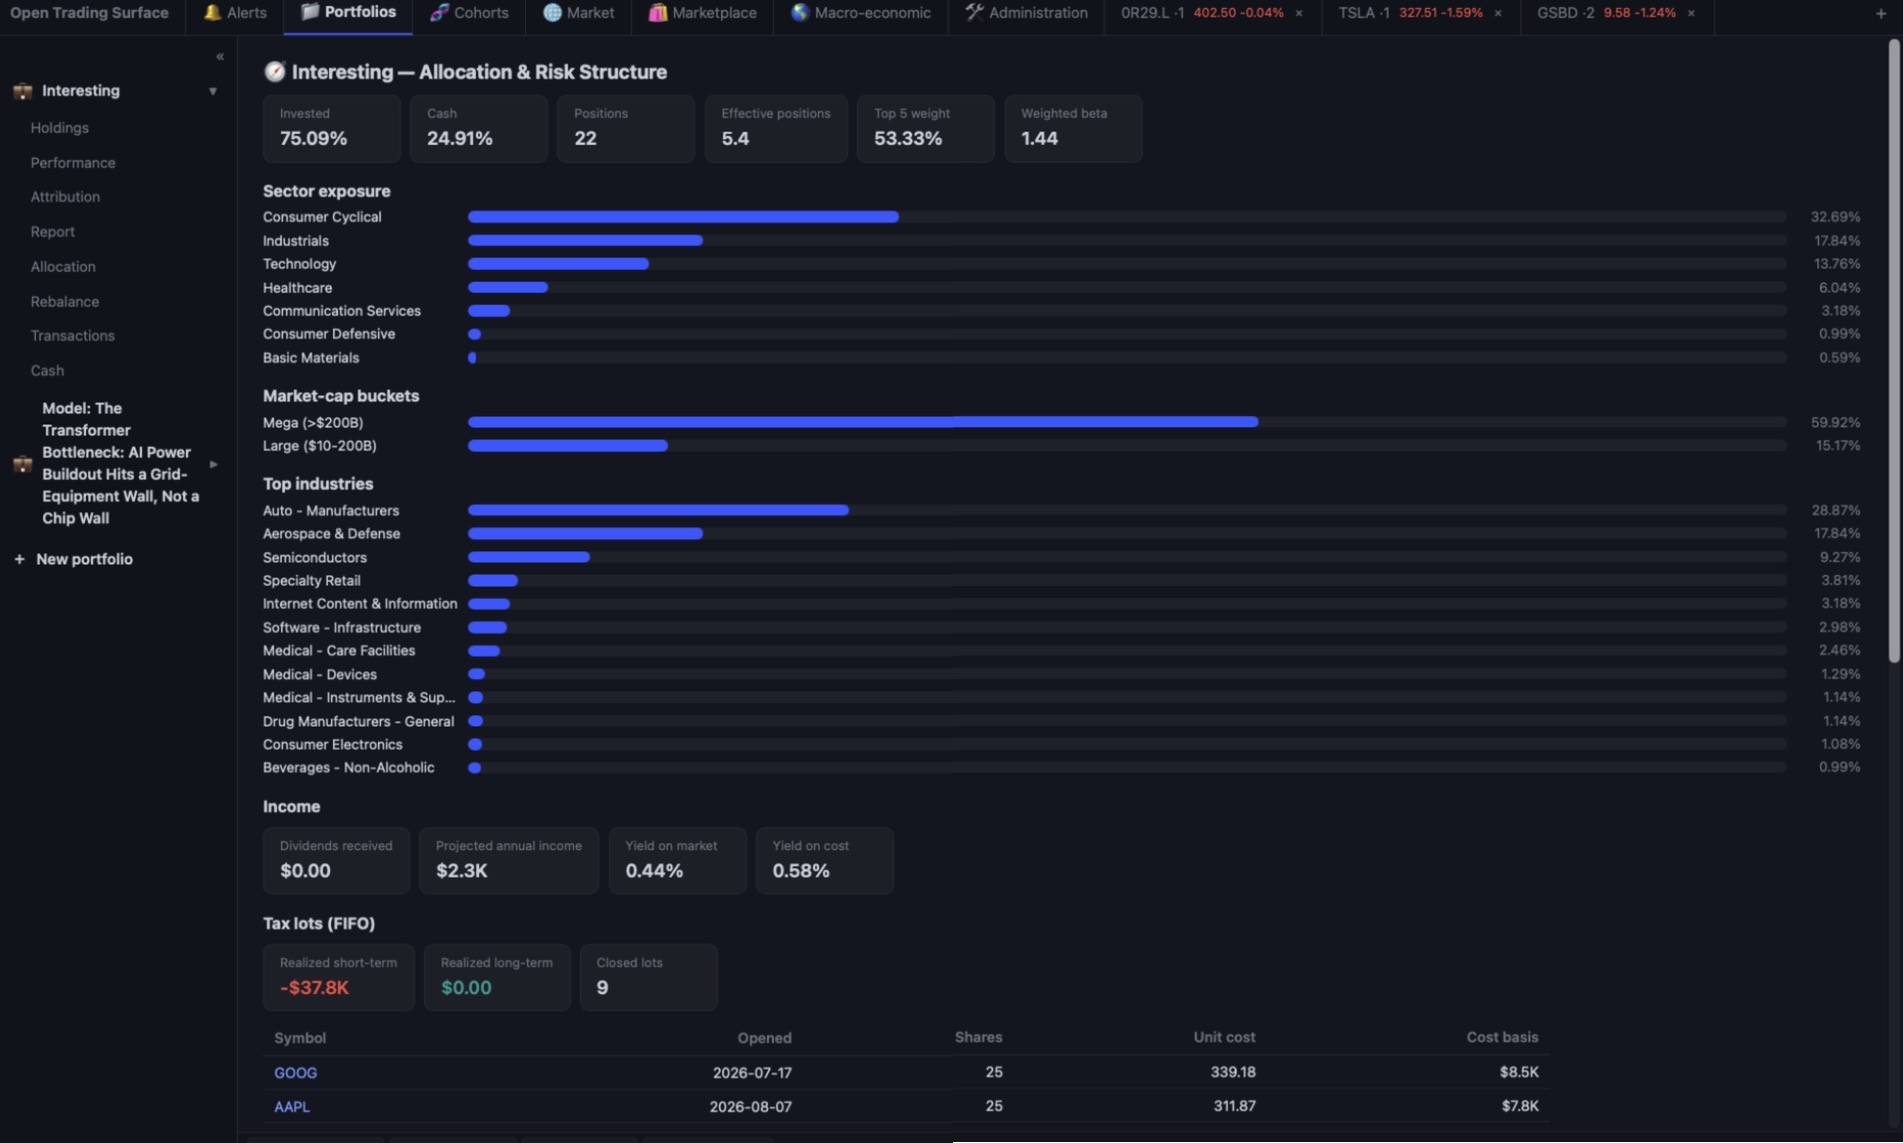
💼 Institutional portfolio analytics — in one house table
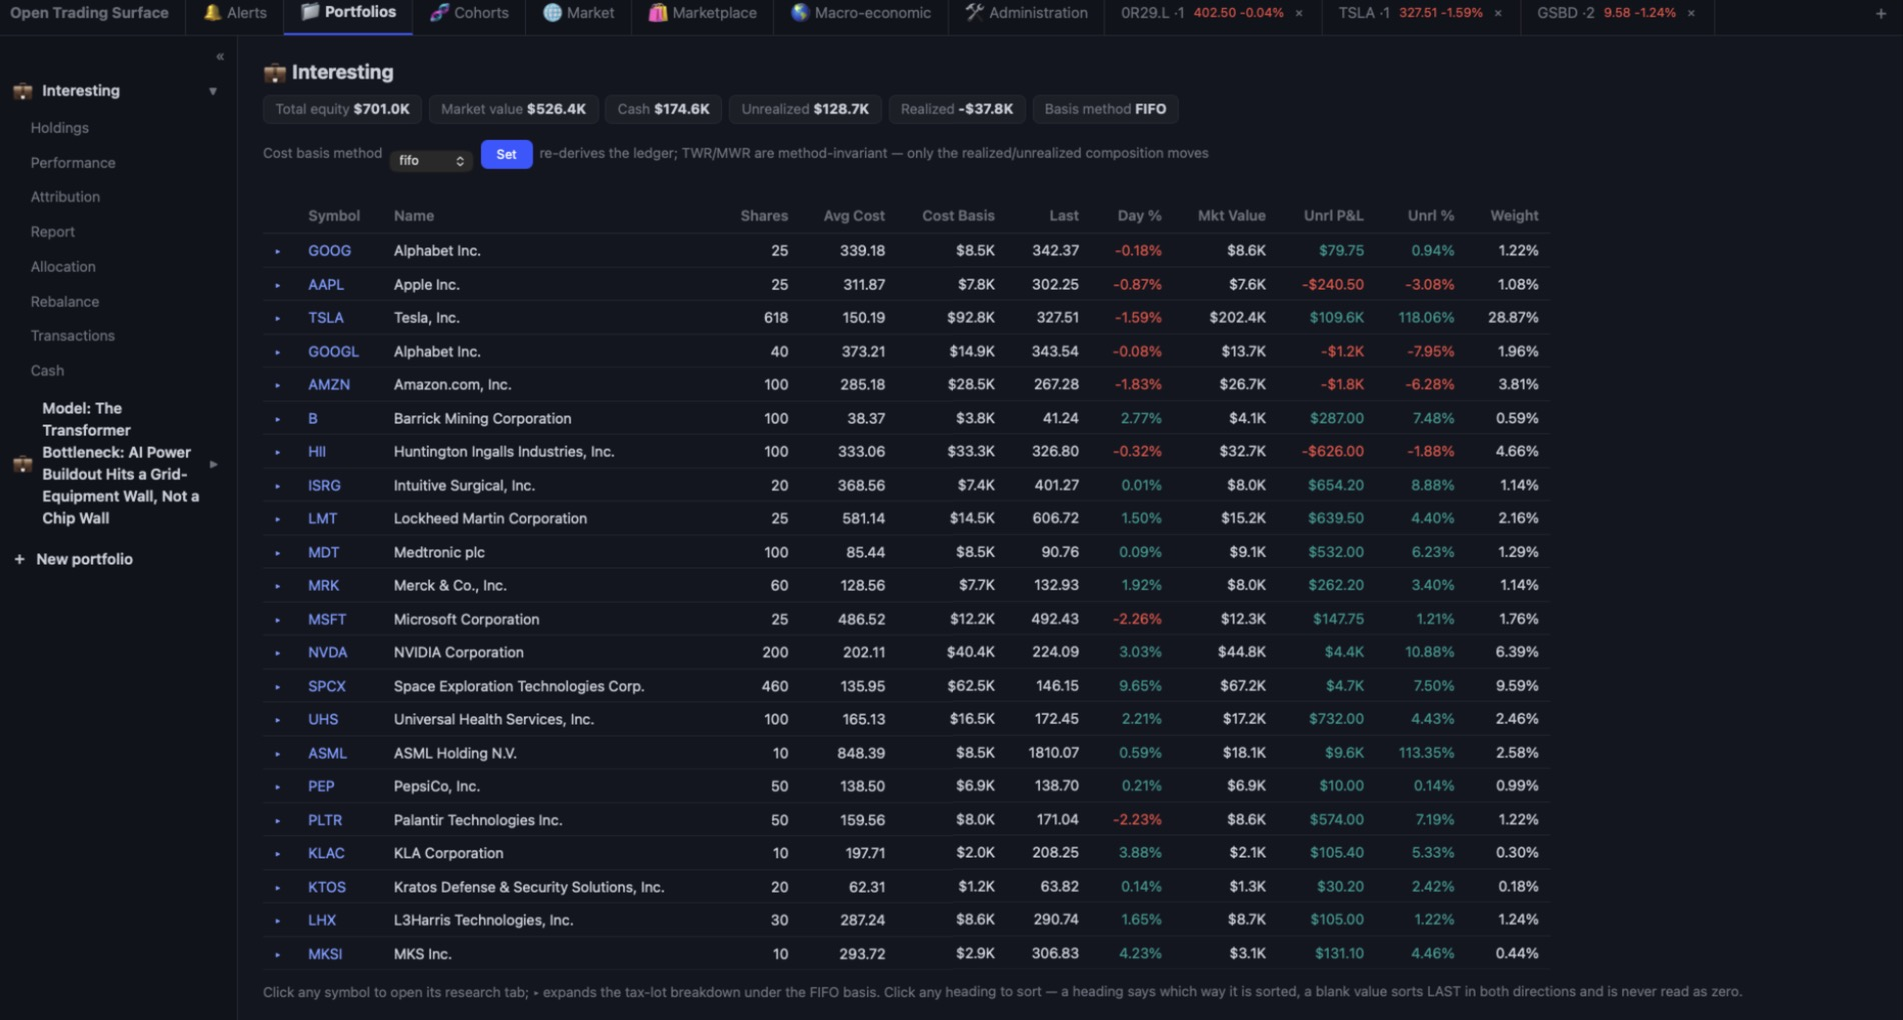
The measurement core professionals expect — verified against closed forms, and honest about what it cannot compute. Positions are derived from a transaction ledger; nothing is an opaque balance.
- Every table sorts, and it is derived rather than added table by table — a table declares its columns and the sort arrives with the declaration, so a build fails if any portfolio view emits a heading outside that one door. Column type comes from the values, never the rendered cell, because
"$1,000.00"sorting before"$9.00"is the defect the feature exists to remove - A missing value sorts last in both directions and is never read as zero, and the count is published
- Two tables refuse to sort, by name — the cash-flow reconciliation is an ordered identity, not a list, and reordering it leaves it numerically correct and meaningless
- One house table — a measured 1,120px maximum width, drag-resizable columns, and the current sort stated on the heading in words as well as a glyph
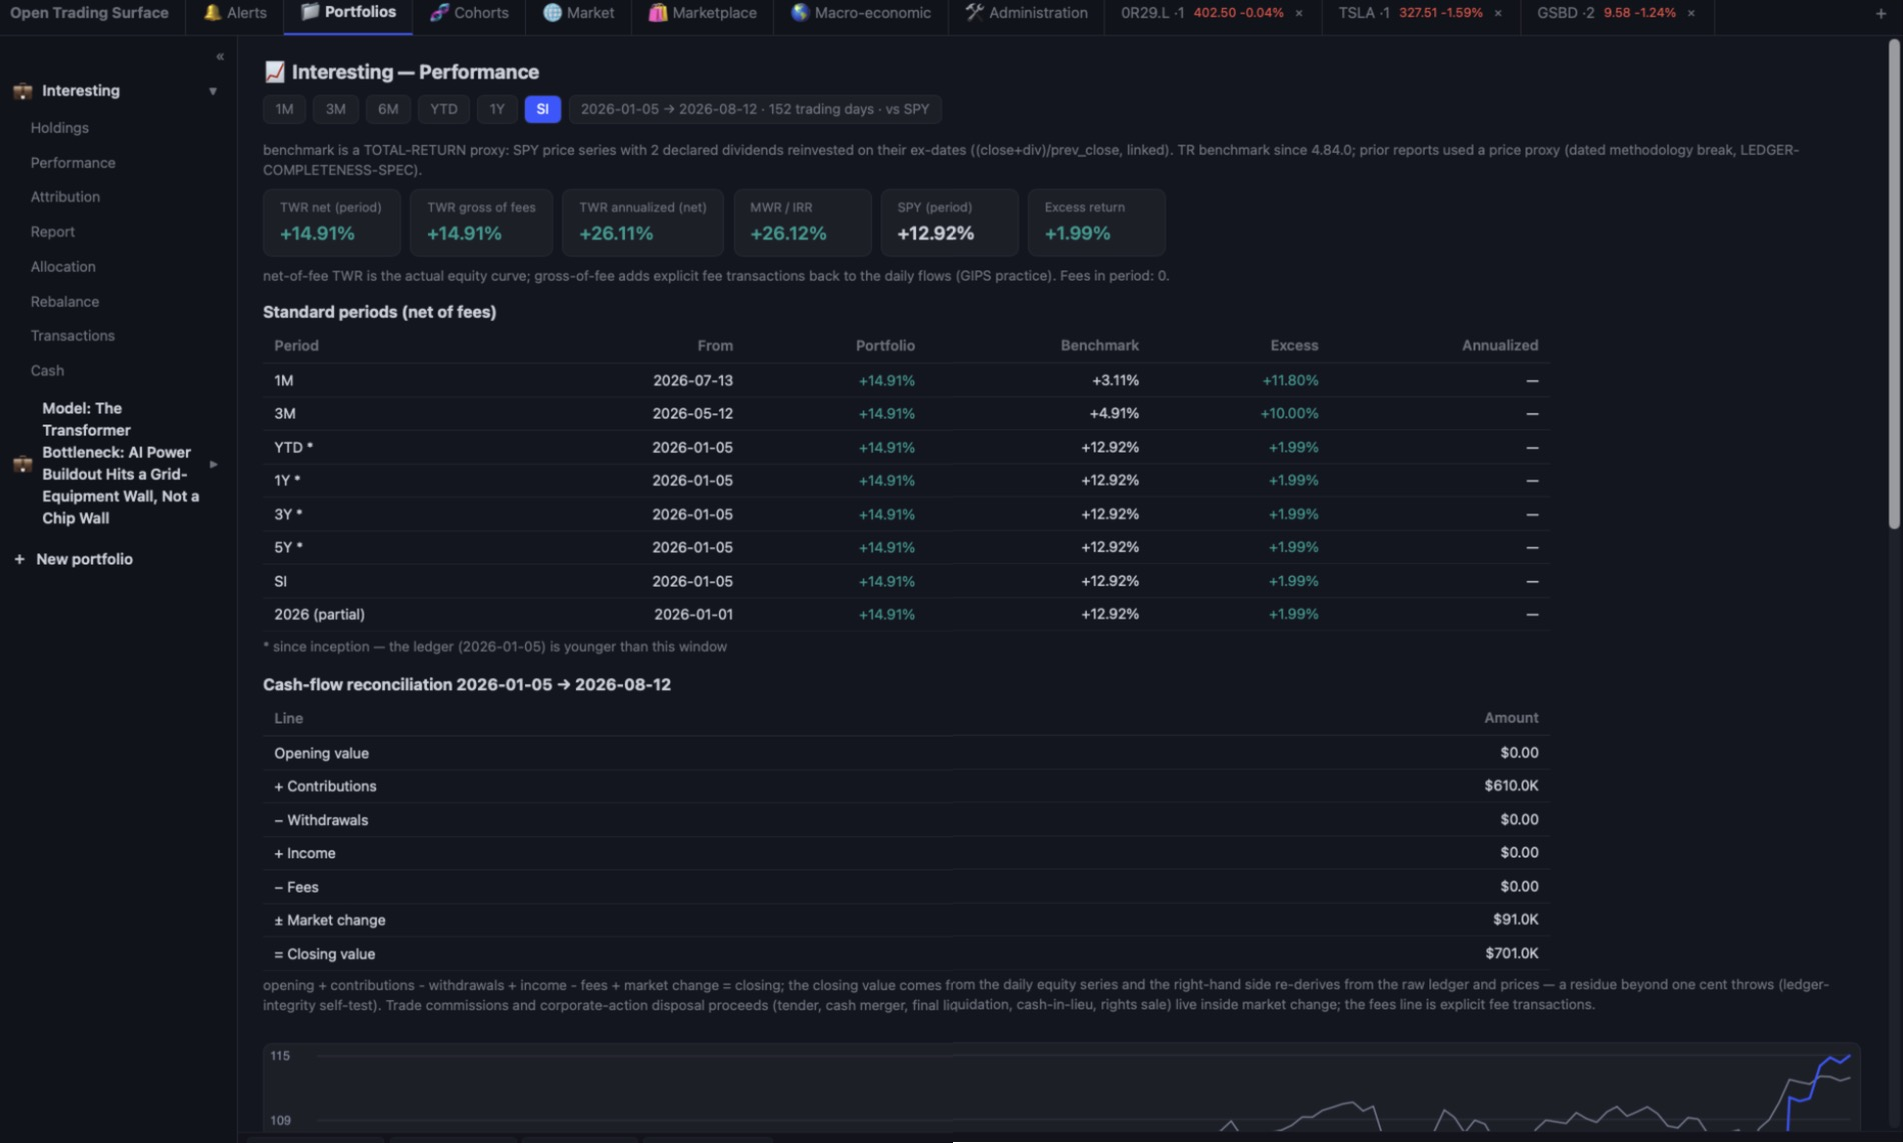
- Time-weighted and money-weighted returns, gross and net of fee, against a total-return benchmark — a change that lowered published excess returns and says so wherever the benchmark is defined
- Five cost-basis methods from one lot engine, with a short/long-term split, and performance that does not move when you change method
- A client-statement reconciliation that must sum — derived twice by independent routes; a residue beyond one cent refuses rather than printing
🔍 Analyst-grade screening, and a defensive standard retranslated
Cross-sectional factor composites, an expression language, and relative-valuation tables — well beyond boolean filters — over a vocabulary of 520 declared fields, each carrying its stage, its source block and its cost. And on top of it, Modernized G & D: Graham's defensive criteria retranslated instrument by instrument.
- Sector-neutral percentile / z-score ranks, Piotroski, Altman, 12-1 momentum, 13F crowding, and 148 technical readings derived from the chart's own indicator taxonomy
- A two-sided margin of safety — a name must be materially below its substantiated value and offer a required return on normalized cash earnings; clearing one side and failing the other is an exclusion with the failing side named
- No hard multiple cap anywhere — a P/B gate in an intangible economy is a filter for asset-heavy declining businesses, so the standard caps price against demonstrated earning power instead
- Accounting-quality gates — accruals, cash conversion, goodwill share of equity, stock-based compensation, and capitalized-vs-expensed divergence — the part every other "Graham screen" omits
- A screen that cannot see a name says so — a name whose fetch failed is removed and named, never silently dropped, and above a stated threshold the run refuses outright, because a shrunk list is a worse lie than an empty one
- Sector variants, one of which ships refusing — the financials variant creates no screen and no cohort, because the served balance sheet has no deposits line and the refusal is the finding
🛠
Administration, in one place
Thirteen panels behind one tab — Settings, Prompts, Chart preferences, Processes and Support under Machine, and the event-processing arc read in order: what can be known (Reach, Conditions), what is watched (Rules, Strategies), what happened (Events, Firings, Runs, Backtests).
🌎
Macro-economic, in four
Thesis — with every thesis, the New thesis affordance and the Worldview nested under it — plus Economy, Sectors and the release Calendar. The menu nests because an entry declares what is under it, so there is no second nesting mechanism to fall out of step.
🔔
Alerts, subscriptions & calendar
A type-first alert feed with per-type counts and click-through to each alert's evidence surface; cohort-first subscriptions that decide which alert types fire on which securities; and a unified calendar carrying the same economic events, under the same ids, as the Calendar panel.
🧬
Cohorts as lenses
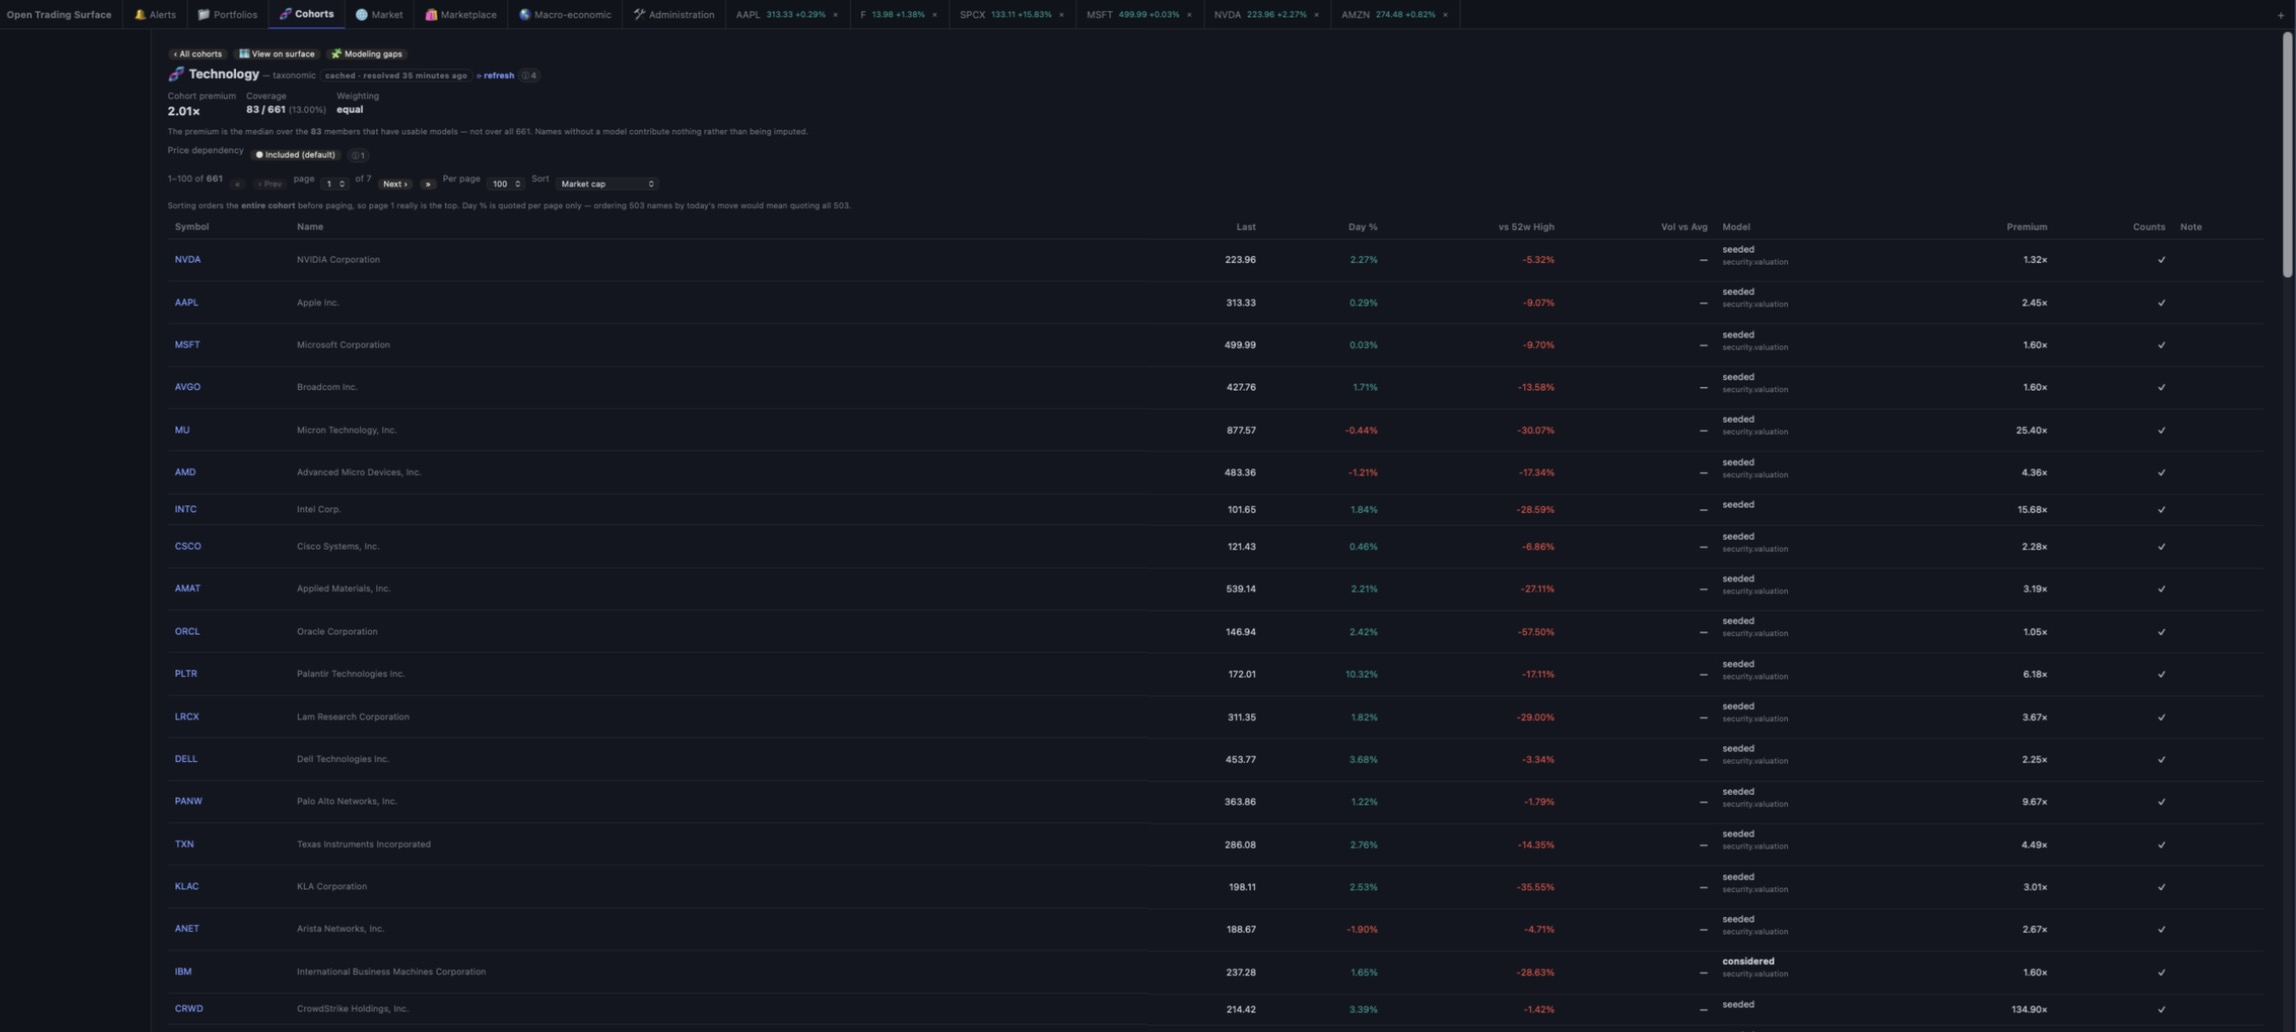
The peer groups every valuation is measured against — sector, size, index, factor screens, your own lists, a thesis materialized into a living cohort, or a portfolio whose membership is derived at read time so it cannot fall out of sync.
📄
A paginated PDF report
Cover, performance, attribution, risk and stress, holdings, and a drill-down page per position in contribution order — written by a zero-dependency PDF writer with no raster, no external font and no library, and downloaded straight from the Report view.
🎯
One selector, one taxonomy
Every dialog that asks you to choose something opens the same component, over one category taxonomy — fundamental · technical · model & attribution · macro & data · market & flows · identity — derived from the underlying registries rather than hand-maintained.
🛍
Marketplace & images
Export and install shareable images — reference surfaces, authored model books, configuration packs — with immutable versioned artifacts, checksum verification, and a provenance ledger: imported records never masquerade as your own history.
📰
News that stays factual
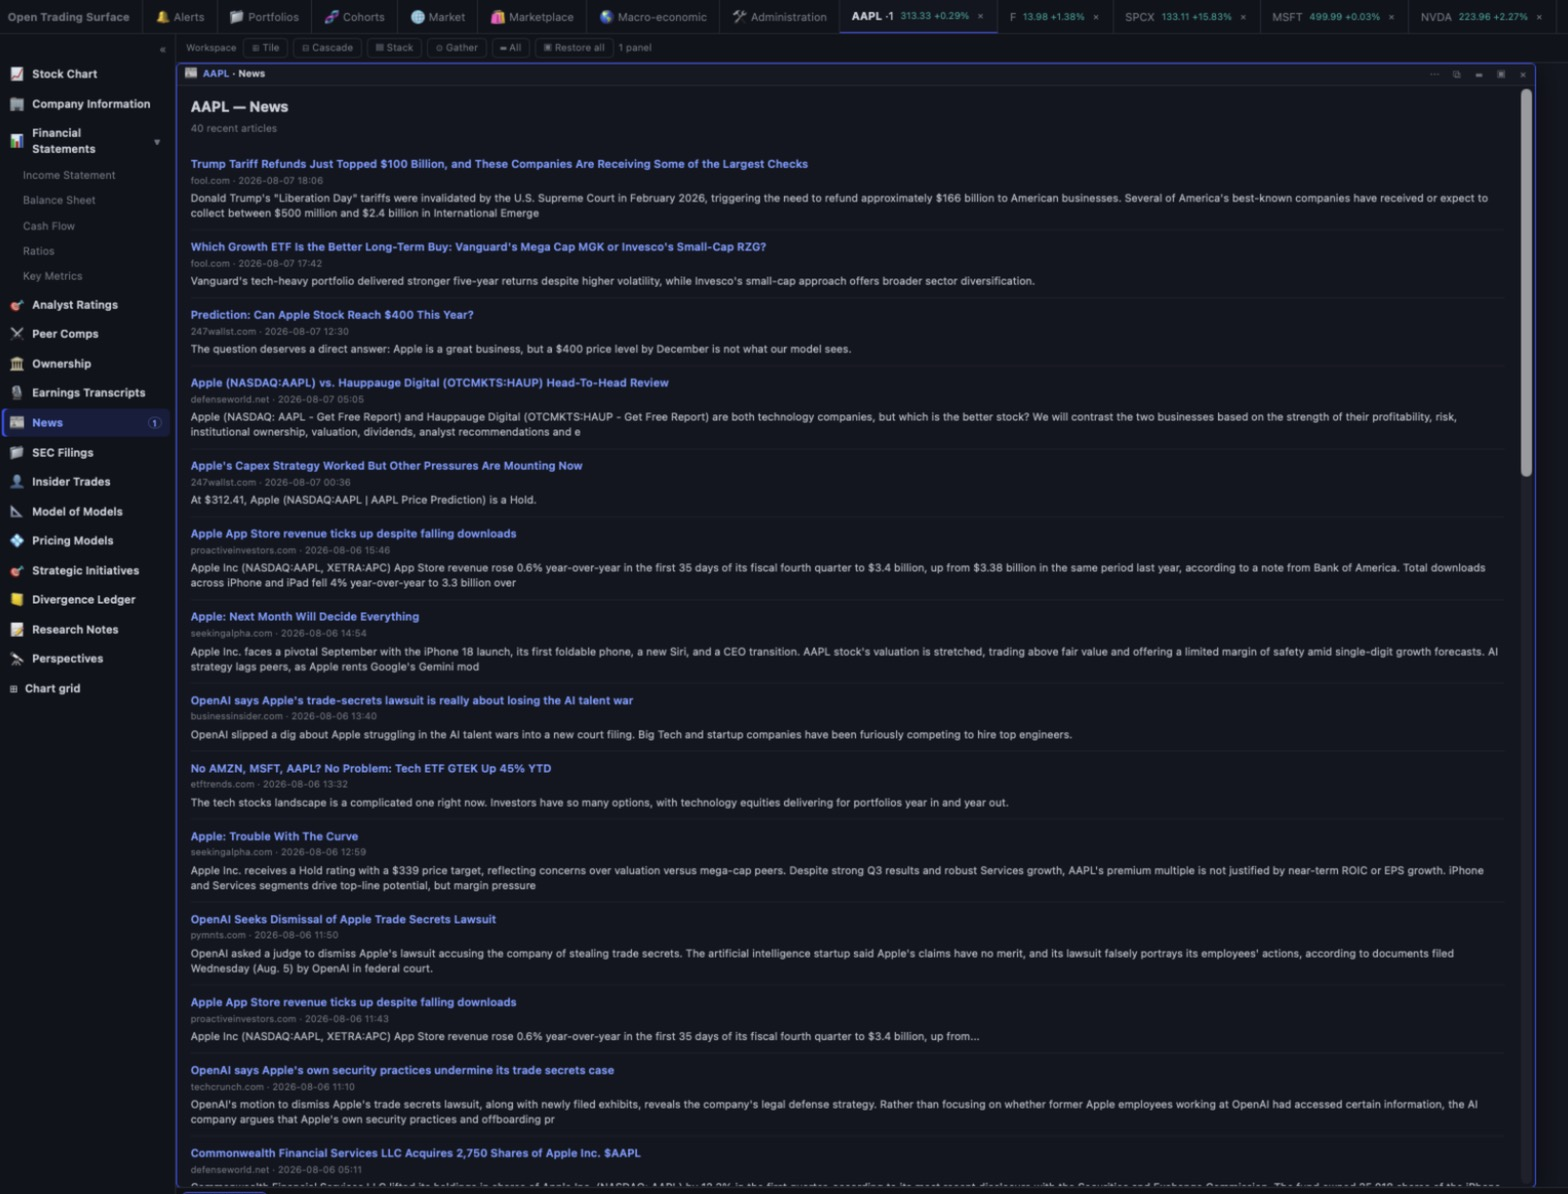
Headlines enter as typed events carrying only predicates that can be checked — publisher, published-at, symbols, the title verbatim, the URL. Sentiment, importance and materiality are withheld by name: a guess about a headline is not a fact about it.
🔐
Private & safe
Runs locally, keys stay on your machine, security-reviewed, fully test-covered, and it never places a trade.
Install in two minutes
Download the package, add it in Cowork, and ask the agent to open it.
- Download the packageGrab the latest package —
ots.plugin. - Install it as a pluginOpen the Cowork tab, then open Customize in the left sidebar → Plugins tab. Under Personal plugins click + and add the
ots.pluginfile you downloaded, then restart the session. - Start Open Trading SurfaceIn a Cowork chat, just tell the agent: “open the Open Trading Surface terminal.” That boots Open Trading Surface's local engine and opens the terminal in your browser. (First run: acknowledge the one-time disclaimer.)
- Add your keys under 🛠 Administration → SettingsIn the terminal, open 🛠 Administration and pick Settings from the left menu. Paste your FMP key, a free FRED key (the economic calendar and the macro series need it) and an SEC EDGAR contact string, and press Test on each. Keys never leave your machine.
- Turn on the batchesRun
/ots:automateand choose which scheduled jobs to install on this machine — the surface batch and the daily ledger are the ones that make the twin accrue. Administration → Processes then shows each one's light, cadence and next due. - GoAsk in plain language — e.g. “analyze NVDA” or “screen large-cap tech under 20× earnings.”
Requires Node.js 18+ (built and tested on Node 22 LTS). Stay current: the plugin tells you when a new version ships. Update & uninstall guide →